Hydraulic directional valve fault diagnosis using a weighted adaptive fusion of multi-dimensional features of a multi-sensor
Jin-chuan SHI,Yan REN,He-sheng TANG,Jia-wei XIANG
College of Mechanical and Electrical Engineering,Wenzhou University,Wenzhou 325035,China
Abstract:Because the hydraulic directional valve usually works in a bad working environment and is disturbed by multi-factor noise,the traditional single sensor monitoring technology is difficult to use for an accurate diagnosis of it.Therefore,a fault diagnosis method based on multi-sensor information fusion is proposed in this paper to reduce the inaccuracy and uncertainty of traditional single sensor information diagnosis technology and to realize accurate monitoring for the location or diagnosis of early faults in such valves in noisy environments.Firstly,the statistical features of signals collected by the multi-sensor are extracted and the depth features are obtained by a convolutional neural network (CNN) to form a complete and stable multi-dimensional feature set.Secondly,to obtain a weighted multi-dimensional feature set,the multi-dimensional feature sets of similar sensors are combined,and the entropy weight method is used to weight these features to reduce the interference of insensitive features.Finally,the attention mechanism is introduced to improve the dual-channel CNN,which is used to adaptively fuse the weighted multi-dimensional feature sets of heterogeneous sensors,to flexibly select heterogeneous sensor information so as to achieve an accurate diagnosis.Experimental results show that the weighted multi-dimensional feature set obtained by the proposed method has a high fault-representation ability and low information redundancy.It can diagnose simultaneously internal wear faults of the hydraulic directional valve and electromagnetic faults of actuators that are difficult to diagnose by traditional methods.This proposed method can achieve high fault-diagnosis accuracy under severe working conditions.
Key words:Hydraulic directional valve;Internal fault diagnosis;Weighted multi-dimensional features;Multi-sensor information fusion
1 Introduction
The hydraulic directional valve is the main control element in the hydraulic system.Its working principle is to use the dislocation movement of the valve spool and the valve sleeve to open,close or change the direction of the oil-way,so as to make the hydraulic actuator start the output and end,or change the direction of the flow.The hydraulic directional valve is widely used in hydraulic systems in engineering,so the condition monitoring or early fault monitoring of that valve is very important and can reduce or prevent the serious engineering losses caused by faults(Kordestani et al.,2018,2020,2021;Rezamand et al.,2020).In recent years,therefore,many researchers have tried to diagnose the faults of hydraulic valves by referring to the fault-diagnosis methods of bearings,motors,and other components (Toscano and Lyonnet,2003;Chen et al.,2022),and have taken a series of targeted measures to solve the unique problems of diagnosis of hydraulic directional valves (Ji et al.,2020;Shi et al.,2021).
The methods of hydraulic valve fault diagnosis are mainly divided into two categories:model-driven fault diagnosis and data-driven fault diagnosis.Modeldriven fault diagnosis is based on the close relationship between model parameters and fault features(Mousavi et al.,2020).Common model-driven fault diagnosis methods mainly include model reference (Peng et al.,2017),parameter estimation,parity equation (Song et al.,2018),state observation (Lefebvre,2014),and state prediction(Caccavale et al.,2008).Although the model-driven hydraulic valve fault-diagnosis technology has been applied,it is extremely difficult to establish an accurate hydraulic valve fault-diagnosis model because there are many hydraulic valve model parameters,not only limited to mechanical factors such as flow coefficient and channel geometry,but also including electromagnetic factors(Ji et al.,2021).
When it is difficult to establish an accurate model,the method of extracting fault features through a large amount of data or carrying out fault diagnosis based on data is also effective and feasible (Souza et al.,2021;Tan et al.,2021).Data-driven fault diagnosis is becoming more and more mature.For example,Zhu et al.(2021) used the wavelet packet transform to extract the time-frequency features of the signal,form a feature matrix,strengthen the relationship between the established features and the bearing fault signal,and enhance the ability of the feature set to express fault information.Moreover,Hoang et al.(2021)used convolutional neural network (CNN) to replace the traditional manual feature extraction to extract the features of the deep network for fault-diagnosis,reduce human intervention,and make the fault-diagnosis part more applicable and automated.Yuan et al.(2021)used the finite element method to extract the fault features of the wavelet packet decomposition sub-signals,and then combined them with the feature sorting algorithm to optimize the feature set,to improve the sensitivity of the feature set to faults.From the work of these researchers,feature extraction has certain advantages in processing a large amount of data for fault diagnosis;reducing manual intervention and redundant information interference in the feature extraction process can improve the accuracy of fault diagnosis.
However,most of the data itself comes from a single sensor and cannot completely and accurately retain the features of the fault,which will cause some faults to be inaccurately judged(for example,it is difficult to record the electromagnetic element in the pressure data of the hydraulic valve).Therefore,a variety of multi-sensor information fusion methods have been developed,but currently they are mainly used for fault diagnosis of bearing gears,and fewer hydraulic valves have been studied.For example,Liu et al.(2021)used CNN to fuse artificial features and hidden features extracted from multiple sensors so that the fault information content of the coupled feature set was enhanced,and the accuracy of rotating machinery fault diagnosis was improved.Similarly,Azamfar et al.(2020) used 2D CNN to extract the deep information from vibration sensors and fused it to monitor the state information of a gearbox.In addition,Tang XH et al.(2020)used the Dempster-Shafer evidence theory to fuse the diagnosis results given by multiple sensors,and their experiment proved that it could effectively reduce the uncertainty of single sensor data sampling and improve the accuracy and reliability of fault diagnosis in bearings.Much research has shown that multisensor information fusion can indeed improve the accuracy of fault diagnosis.
According to the aim of information fusion,multisensor information fusion is generally divided into data-level fusion (Liu QJ et al.,2020;Dong et al.,2021;Shao et al.,2021;Zhang Y et al.,2021),featurelevel fusion(Liu Z et al.,2020;Ye et al.,2020;Liang et al.,2021;Pan et al.,2021),and decision-level fusion (Tidriri et al.,2018;Sreekumar et al.,2019;Xu et al.,2020;Gao XE et al.,2021).Data-level fusion refers to the shallow fusion of multiple parallel data,which can retain the original data information most effectively,but its efficiency is low and its data dependence is high.Usually,research adopts the method of first extracting signal features and then fusion,which can effectively reduce the data required for fusion,thereby improving the efficiency and ability of fault data representation.However,the effect of fusion depends on whether the features can reflect the fault information.Therefore,some studies use multiple features to enhance the representation ability of feature sets.For example,Liu Z et al.(2020)extracted multidimensional features (time domain features,frequency domain features,time-frequency domain features,and wavelet features) to characterize braking system faults on heavy-duty trains.In addition to the common manual features,some studies have extracted implicit features from signals to enhance the fault characterization ability of feature sets.For example,Liu et al.(2021)extracted statistical features(such as time domain features) and extracted hidden features from signals through deep learning.These two types of features were combined to improve the ability of feature sets to describe induction motor faults.
However,there is information redundancy from a large number of features,and different features have different sensitivities to different faults.The adoption of low-sensitivity and redundant features will reduce diagnostic efficiency and cause fault misjudgment.Therefore,feature selection technology should be used to screen faults.Excellent features can be selected for subsequent classification,such as principal component analysis (Wan et al.,2018),maximum correlation and minimum redundancy (Yan and Jia,2019;Zhang and Zhou,2019),and feature selection technology based on Euclidean distance improvement (Patel and Upadhyay,2020),to reduce dimensions or to select features.For example,Yan and Jia (2019) used maximum correlation and minimum redundancy to select features and reduce feature redundancy in diagnosing gear faults.However,such selection technology can easily delete fault information,and incorrect threshold setting will result in low accuracy.
Combined with the above methods and theories of multi-sensor information fusion,the fault diagnosis of a hydraulic directional valve is preliminarily studied here.The purpose of this study is to propose a fault diagnosis method to diagnose faults in hydraulic directional valves,including faults in electromagnetics and in mechanical wear.The characteristic of this method is that it can adaptively fuse the data of different types of sensors to judge different types of faults and effectively eliminate fault misjudgment caused by insufficient and incomplete information from a single sensor.First,the sensor signals (two pressure sensors and two acceleration sensors)are decomposed by variational mode decomposition (VMD) to obtain subsignals with multiple frequencies from low to high frequencies.Next,the extracted time domain,frequency domain,and time-frequency domain features of the sub-signals are combined with the depth features(network features) of the original signal extracted by the CNN to form a multi-dimensional feature set.Then,the features obtained from two pressure sensors or two vibration sensors are fused to obtain two improved multi-dimensional feature sets.Based on the multidimensional feature set,the entropy weight method is used to weight each type of feature,and the weighted multi-dimensional feature set is obtained.Finally,the attention mechanism is introduced to improve the twochannel CNN,and the improved network is then used to fuse the weighted multi-dimensional feature set of different types of sensors to realize the fault diagnosis of the hydraulic directional valve.The advantages of this method are summarized as follows:
1.The proposed information fusion method of heterogeneous sensors enhances the fault expression ability of the feature set,so that various fault types(electromagnetic faults and mechanical faults) can be characterized.
2.The personalized weighting method (the use of the entropy weight method and attention mechanism) enhances the effective signal and weakens the interference source.
3.A diversified feature extraction method is proposed,and the acquired multi-dimensional feature set has robust and complete health information.Most importantly,this method provides a way to diagnose different types of faults by processing the data of different types of sensors.
2 Experimental
A hydraulic directional valve fault diagnosis testbed was built,as shown in Fig.1,including the control platform,the pressure sensor,the acceleration sensor and corresponding data acquisition equipment,the valve test-bed,the hydraulic actuator,and the hydraulic pump station.The oil supply pressure was set to 2 MPa through the control platform,the sensor data acquisition time was 30 min,the acquisition frequency was 6 kHz,and the reversing cycle of the hydraulic valve was 8 s.The tested valve was installed on the valve test platform,the acceleration sensors were installed separately on the top and side of the valve body,and the pressure sensors were installed separately on port A(oil inlet)and port B of the valve,to obtain vibration signals and pressure signals of the different health conditions of the valve.In this study,a total of 10 groups of experiments were designed,corresponding to 10 health conditions of the hydraulic directional valve,and the same experimental parameters were set for each experiment.
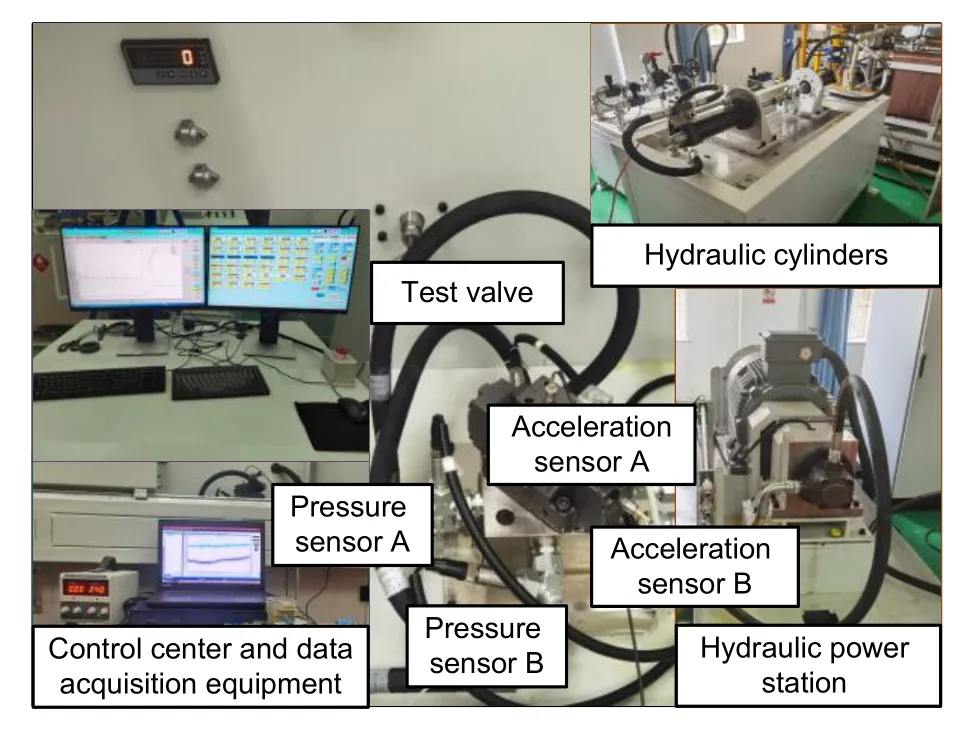
Fig.1 A total test rig used for the experiments
The clearance between the valve core and valve body of the selected hydraulic directional valve is 0.005 mm,so different wear depths are designed to simulate the faults of directional valve with different wear degrees.Wear depth in the range of 0.015-0.035 mm is defined as mild wear.Damage depth of 0.035-0.060 mm is defined as moderate wear.Severe wear is defined as showing damage greater than 0.060 mm.Fig.2 shows the different degrees of wear that occur at the spool position.Wear is artificially formed by laser processing,and the depth of the treated surface can be measured by a 3D morphology microscope.

Fig.2 Different severities of valve spool wear:(a) mild wear;(b)moderate wear;(c)severe wear
In addition to the wear of the valve core,there is wear at other positions,e.g.spring failure and electromagnetic fault,and the locations of the faults are shown in Fig.3.
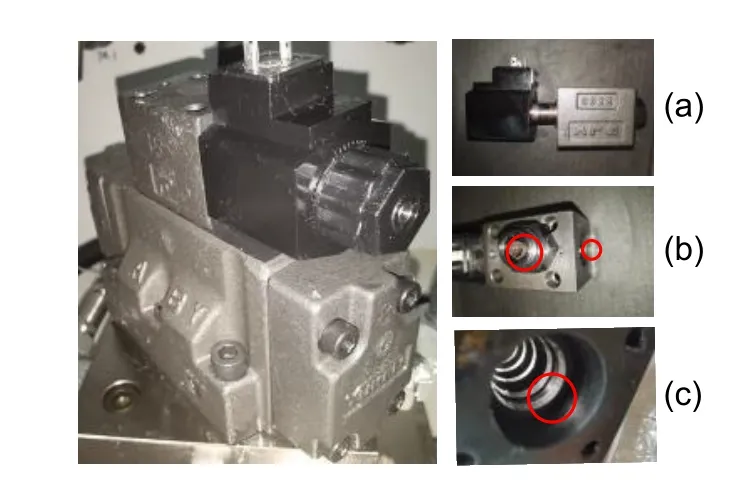
Fig.3 Partial fault positions of the directional valve:(a) electromagnetic fault location;(b) spring failure fault location;(c)valve body wear fault location
In short,the fault types and their locations are given in Table 1,in which one normal state,and nine fault types and corresponding locations of the hydraulic directional valve are listed.These faults mainly include wear,spring fatigue or failure,and degradation of electromagnetic parts.
Table 1 Fault types and locations
3 Methods
A multi-dimensional feature weighted fusion method is proposed to diagnose different types of faults of hydraulic directional valve.It has two parts:the weighted fusion of similar sensor information and the weighted fusion of heterogeneous sensor information.The feature extraction and weighting mechanism are shown in Fig.4,where the feature extraction includes manual feature extraction and the deep feature extraction using CNN.Fig.5 shows the flow of the fault-diagnosis method of the hydraulic directional control valve.

Fig.4 Multi-dimensional feature set acquisition mechanism
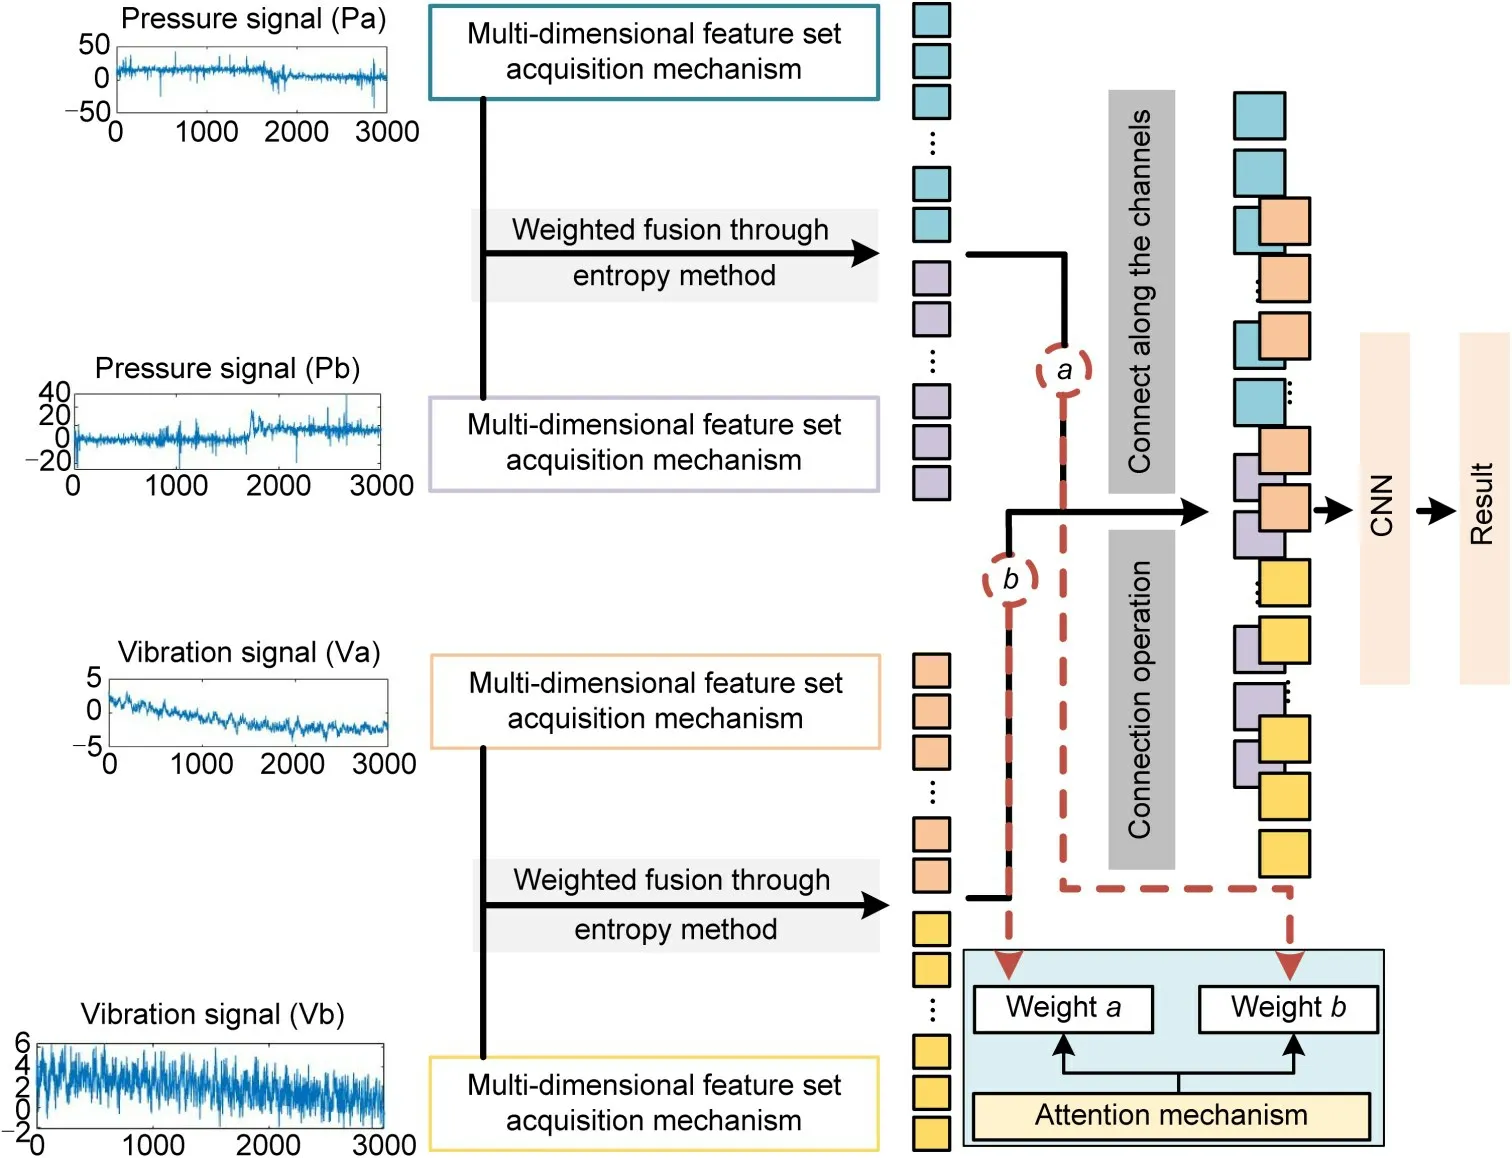
Fig.5 Directional valve fault diagnosis flow chart
3.1 Signal preprocessing and feature extraction
The large amount of data in the original signal will lead to a large number of calculations,and due tothe influence of noise,the features directly extracted from the original signal often have a weak ability to express faults.Therefore,it is necessary to take measures to highlight fault features and improve the ability of the feature set to describe faults.
The signals (30 min) collected by the four sensors (acceleration sensor A,acceleration sensor B,pressure sensor A,and pressure sensor B) are shown in Fig.6.It can be seen that a high impact signal will be generated during the movement of the hydraulic directional valve,which will cause the subsequent signal fault information to be submerged or disturbed.
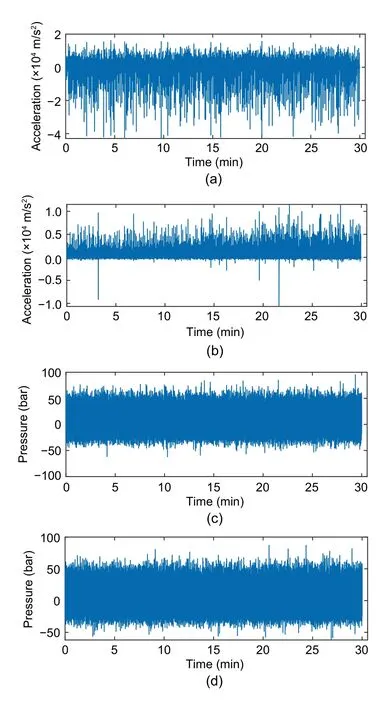
Fig.6 Signals (30 min) collected by the four sensors:(a)acceleration sensor A;(b)acceleration sensor B;(c)pressure sensor A;(d)pressure sensor B(1 bar=100 kPa)
For the signals in Fig.6,the single cycle signals(8 s) are intercepted and displayed in Fig.7.Because there are several high impact signals generated during the reversing process of the hydraulic directional valve,some signals before the impact signals are selected as sample signals and the pressure data during the reversing process is intercepted as sample signals to supplement the changing-over information.This ensures sufficient fault information samples.
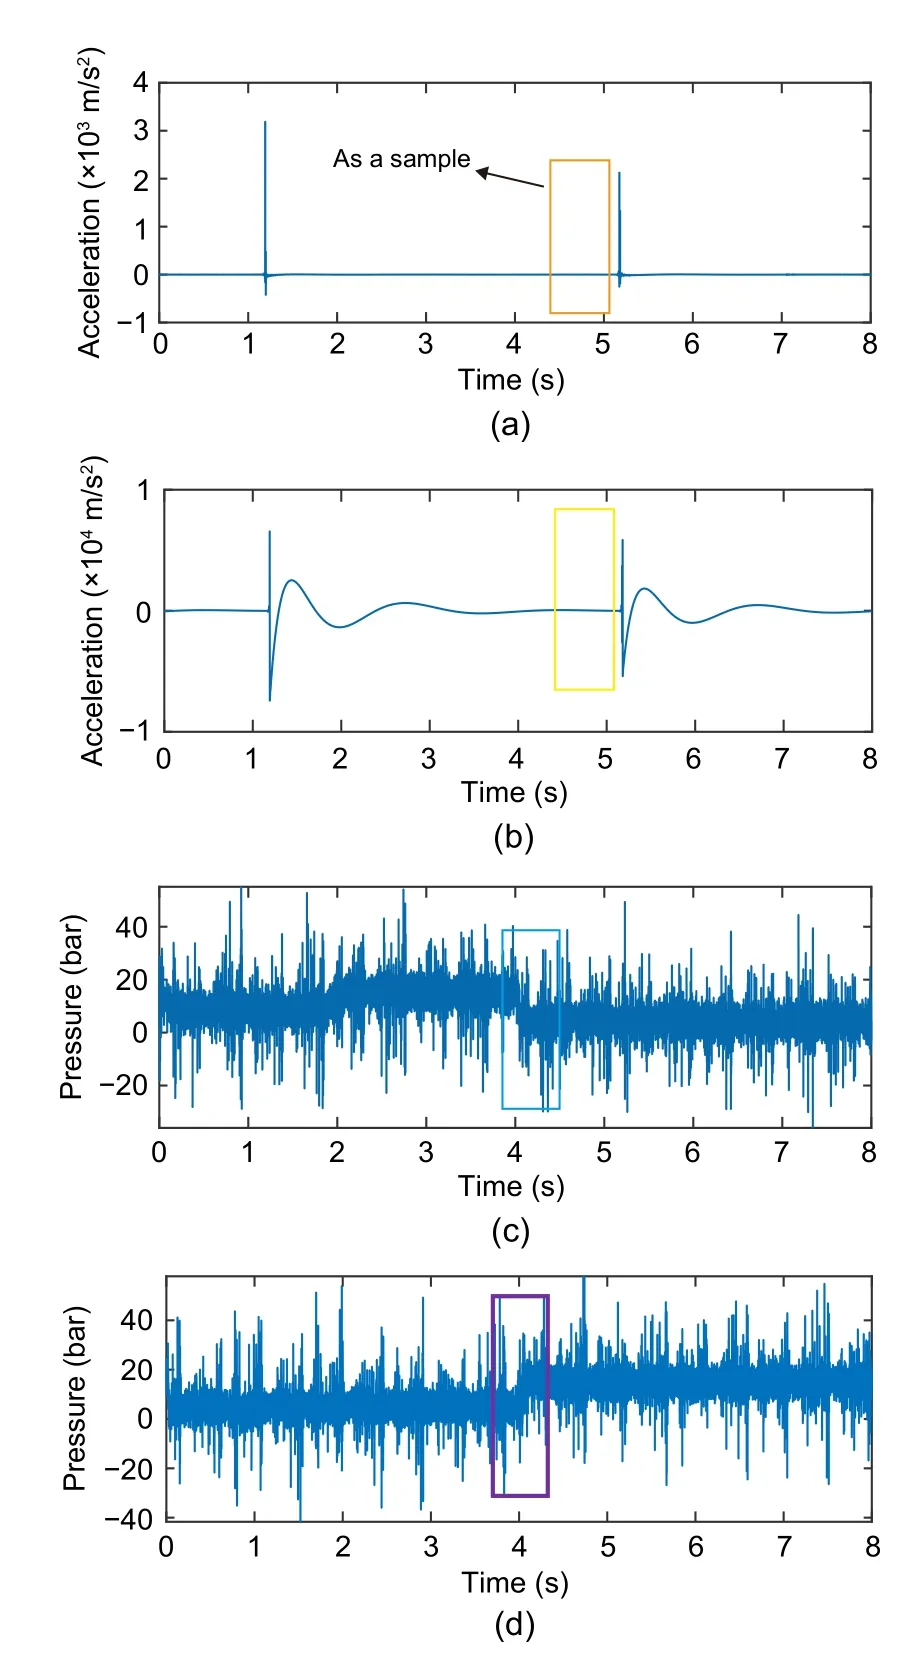
Fig.7 Multi-sensor signal sample selection in a single cycle(8 s)collected by:(a)acceleration sensor A;(b)acceleration sensor B;(c)pressure sensor A;(d)pressure sensor B
Then,VMD is used to decompose the original signal to obtain multi-band sub-signals from low frequency to high frequency.Compared with other signal decomposition methods,this method can adaptively determine the correlation frequency bands and estimate the corresponding modes,so as to properly balance the error between them (Dragomiretskiy and Zosso,2014;Xue et al.,2016;Isham et al.,2018;Yan and Jia,2019;Jiang et al.,2020).The expression of the VMD decomposition method is shown as
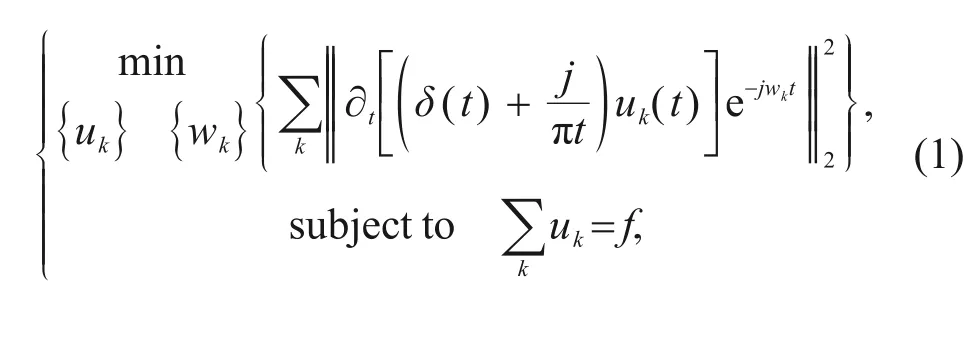
u
is thek
th decomposed component,w
is the center frequency of thek
th component of VMD,t
is the time variable,δ
(t
) is the impulse function,j
is the imaginary unit,andf
is the original signal.To solve the variational problem,a Lagrange multiplier and quadratic penalty function are introduced to transform the above constrained variational problem into an unconstrained problem.The formula is shown as follows:
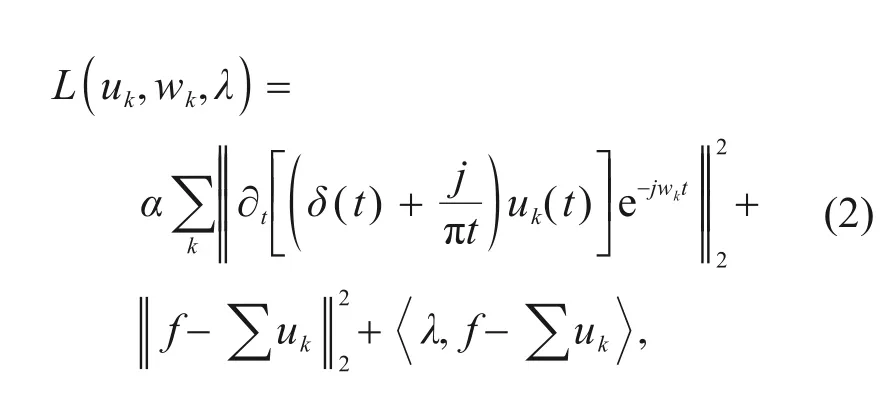
λ
is the Lagrange multiplier,andα
is the quadratic penalty factor.u
,w
,andλ
are updated according to the formulas as follows: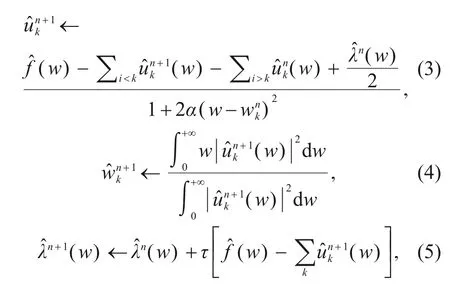
w
is the angular frequency variable,andτ
is the update parameter.The detailed steps of the VMD method are shown as follows:
Step 1:Initialize.
Step 2:Whenn
=n
+1,enter the loop.Step 3:Iterate according to the iterative formula until the number of decompositions reachesk
.Step 4:Given the accuracyε
,repeated iteration makes the following formula meet the convergence condition:
k
.When the selected value ofk
is small,the VMD algorithm is equivalent to an adaptive filter bank,which will filter out some important information in the original signal and affect the accuracy of subsequent prediction.If the selectedk
value is too large,the center frequency of adjacent modal components will be closer,resulting in modal repetition or additional noise.Therefore,it is necessary to select an appropriatek
value.Based on the center frequency distribution under different modal numbers,thek
value is 6.The time domain image and frequency domain image of the variable mode function of the four sensor sample signals are shown in Fig.8.The decomposed signals have no mode aliasing and can satisfy the experiment.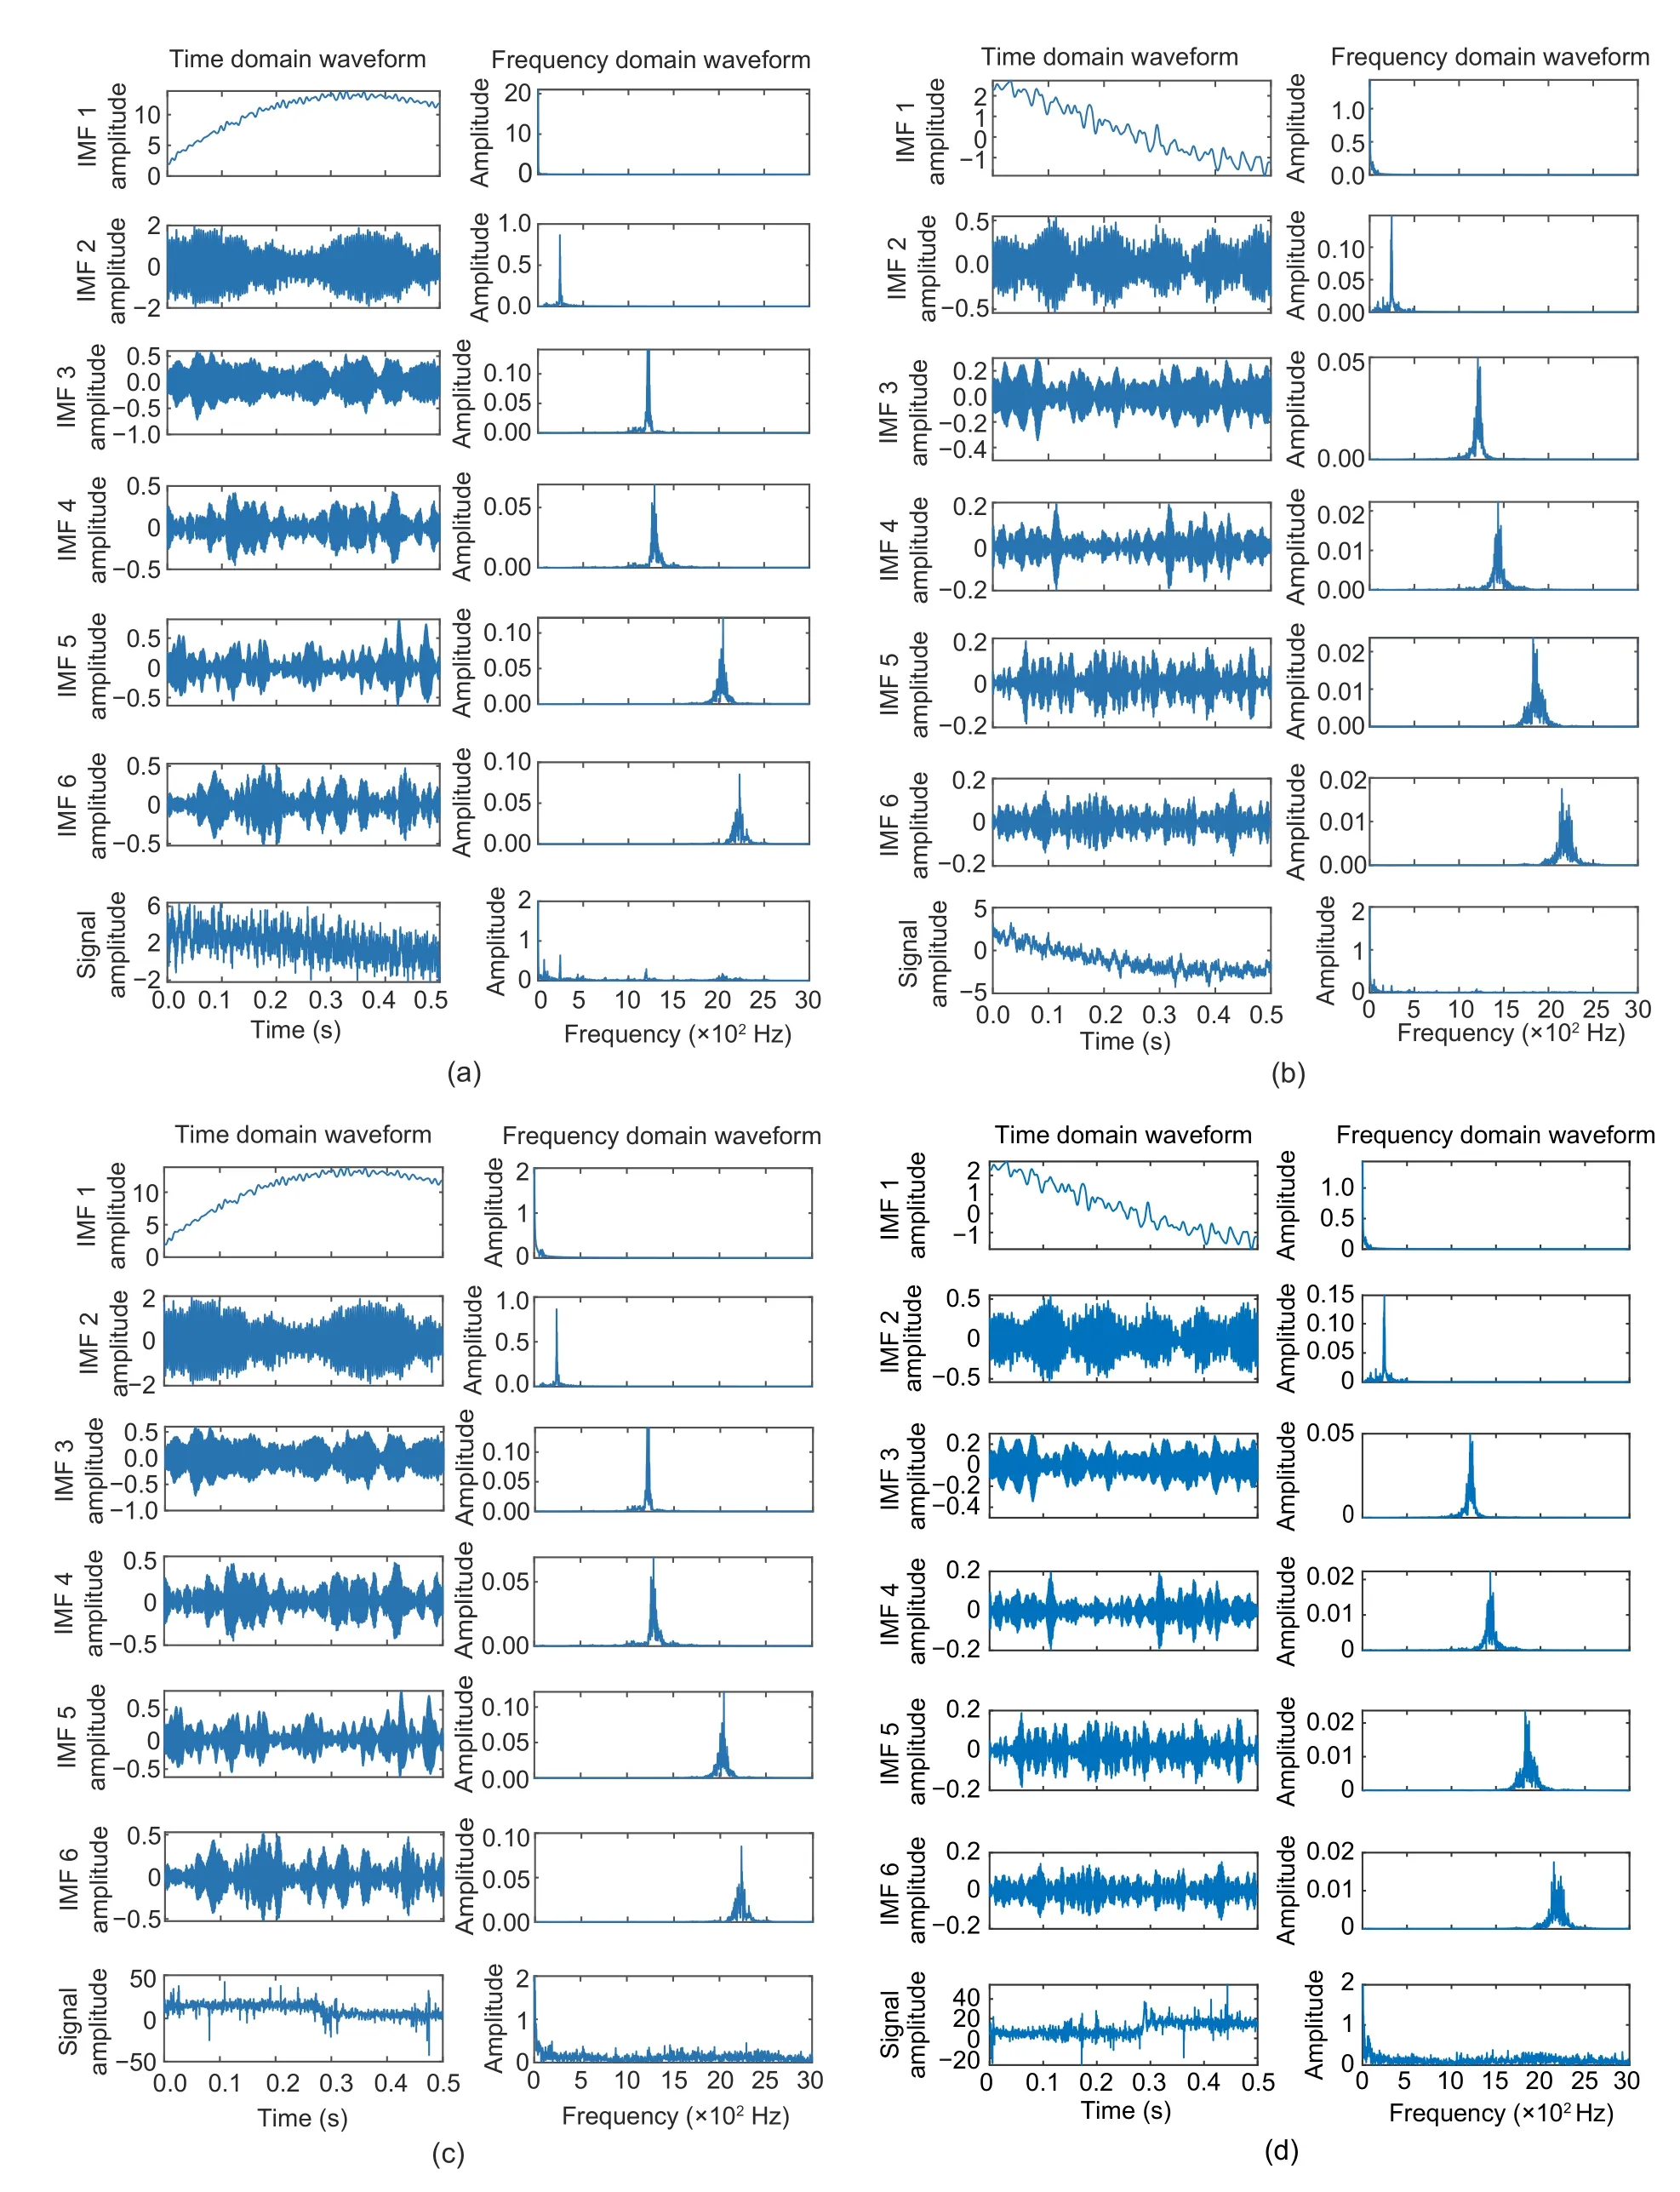
Fig.8 Signals decomposed by VMD and the time domain and frequency domain images transformed by fast Fourier transform (FFT):(a) signal from acceleration sensor A;(b) signal from acceleration sensor B;(c) signal from pressure sensor A;(d)signal from pressure sensor B.IMF represents the component of VMD
After signal decomposition,the traditional artificial features are used to extract the features of multiple frequency bands.Here,the manual features include time domain features,frequency domain features,and time-frequency domain features,as shown in Table 2.CNN is used to automatically extract deep features from the original signal.The structure of CNN is shown in Fig.9.In addition,CNN can also be combined with artificial features to increase the diversity of features and improve the fault representation ability of the feature set.

Fig.9 CNN structure for feature extraction.Conv.represents the convolutional layer,Maxpool represents the max-pooling layer,and Dense represents the fully connected layer
Table 2 Feature types
3.2 Homogeneous sensor information weighted fusion
In different feature sets,each feature has a different ability to express a fault.Therefore,the entropy weight method is used in the feature extraction stage to give different weights to each type of feature,and thus highlight the fault sensitive features and weaken the interference of the fault insensitive features.The method can enhance the robustness and sensitivity of the feature set.The entropy weight method is shown below(Liu et al.,2018;Zhang HR et al.,2021).
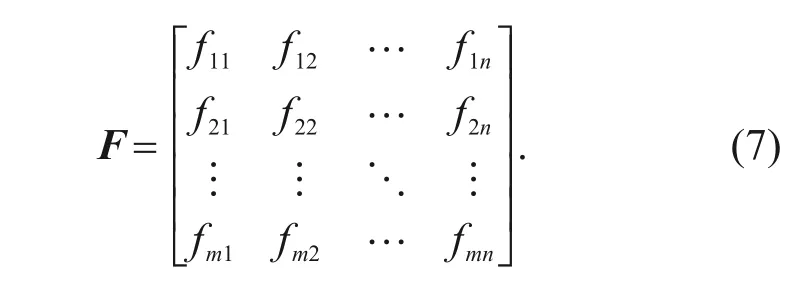
Step 1:Calculate the values of each index to obtain the feature index matrixF
:
F
to get a new matrixR
:
E
of thej
th indicator:
n
is the number of evaluation objects,m
is the number of evaluation indicators,andis the proportion of the value of the indicator.If
P
=0,then defineStep 4:Calculate the weight of each indexw
:
V
according to the entropy and weight of each index:
After the weighted feature set is obtained and to avoid the inaccuracy and incompleteness of the information expression of a single sensor,the feature information extracted from two homogeneous sensors is preliminarily fused.A robust feature set composed of two sensor features is obtained.This feature set contains diversified features,which can improve its ability to express faults and reduce interference from insensitive features.
3.3 Heterogeneous sensor information fusion weighted adaptively
In heterogeneous sensor fusion,the sensitivity of each sensor to different types of failures is different.Therefore,sensors need to be weighted adaptively according to the characteristics of their own information expression to give full play to the advantages of different types of sensors for different faults.In this study,the attention mechanism shown in Fig.10 is introduced to improve the two-channel CNN for the fusion of weighted multidimensional feature sets of heterogeneous sensors(heterogeneous sensor information fusion).First,the attention mechanism is used to learn the multi-dimensional feature set to generate initial weights,and the initial weights are added to the heterogeneous sensor information and a two-channel CNN is used for training.Secondly,a loss function is generated during the two-channel CNN training process,and the loss function is used to update the initial weight to obtain the updated weight.Finally,iterative updates are continued until the training of the twochannel CNN is completed.
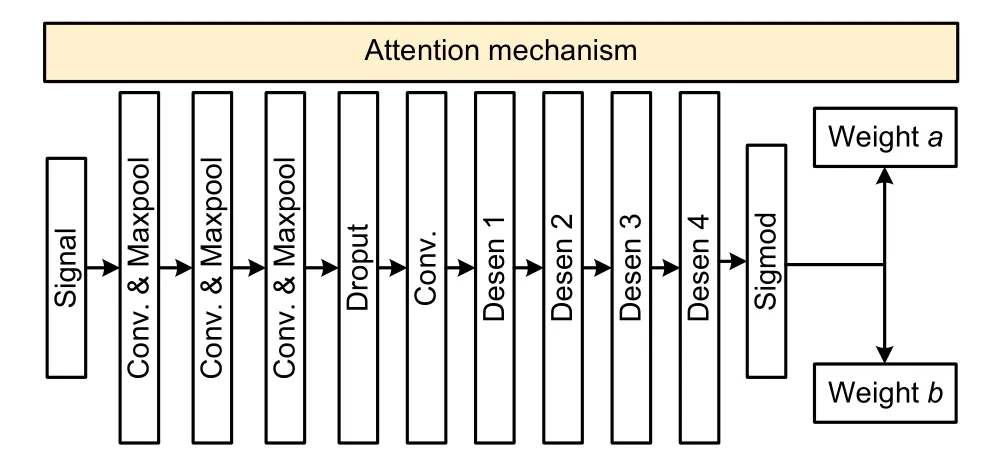
Fig.10 Structure of attention mechanism based on CNN
With the training of the classifier,the attention mechanism constantly adjusts the weight of the channel.When the classifier training is completed,a channelweighted classifier is obtained.That classifier is then used to classify the test sample to get the final classification result.
4 Data analysis and discussion
4.1 Data processing
The experimental data includes the data of two pressure sensors and two vibration sensors collected from the hydraulic directional valve experiment.By preprocessing the data of four sensors,four groups of samples can be obtained.There are 200 samples for each type of fault,and there are 10 types of faults,for a total of 2000 samples.Each sample contains 3000 data points.In this study,theK
-fold cross-validation method was used to segment the data samples and train the classifier.To avoid specificity of the diagnosis,five tests were performed.Finally,the average test accuracy of the five tests was calculated.4.2 Results of different training samples
The comparison results of dividing the dataset using theK
-fold method (Refaeilzadeh et al.,2009)and then performing the diagnosis are shown in Fig.11.Five tests were conducted for eachK
value from 2 to 8,and the results of these five tests were denoted as Nos.1-5,respectively.Table 3 shows the maximum,lowest,and average diagnostic accuracies of eachK
value.Table 4 shows the comparison results without additional weights or without additional attention mechanisms.In addition,there are four separate classification results of sensor information.These results were all datasets partitioned based on theK
fold method whenK
=6 and were tested five times respectively.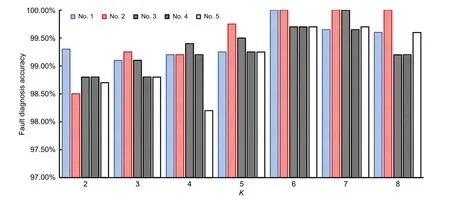
Fig.11 Fault diagnosis accuracies based on K-fold cross-validation
Table 3 The maximum,lowest,and average diagnostic accuracies based on-fold cross-validation
As shown in Fig.11 and Table 3,the proposed method still has high diagnostic accuracy and robustness under differentK
values,and the proposed method has the highest accuracy whenK
=6.Based on the experimental data,the highest diagnostic accuracy rate of the proposed method can reach 100%,but if the experimental data expands and the data is complex,the diagnostic rate may decrease.In addition,Table 4 shows the comparison results of different sensor diagnosis methods.The diagnosis effect of the multi-sensor fusion method is higher than that of the single-sensor diagnosis method.In addition,the weight and attention mechanism are used to improve the multi-sensor method,which can effectively improve the fault diagnosis accuracy of the multi-sensor method.Table 4 Fault diagnosis accuracies of different sensor methods
4.3 Results of different multi-sensor information fusion methods
To further demonstrate the advantages of this fusion method,this study chooses the common data-level fusion method (Shan et al.,2020) and the decisionlevel fusion method (Xiao et al.,2021) as a comparison.The proposed fusion of data level and decision level has been adopted in other studies and has achieved good results.
Figs.12 and 13 show the flow charts of the datalevel fusion method and the decision-level fusion method,respectively.Table 5 shows the time required for CNN model training and the final diagnosis effect in the various methods.

Fig.13 Decision-level fault diagnosis method flow
The data obtained in Table 5 is based on the network structure mentioned in this paper.The modeltraining time of the method mentioned in Table 5 is much lower than that of the comparison method.This is because the feature set is used as the training set in this study,which can reduce the computational burden caused by excessive data.Moreover,according to the average accuracy rate from a comparative point of view,the use of the feature-level fusion method (the method mentioned in this paper) to achieve hydraulic valve fault diagnosis has advantages.
Table 5 Comparison of average diagnostic accuracy and average model training time consumption
4.4 Results of different classifiers
In this study,CNN is selected as a classifier and a network structure is designed.AlexNet (Yuan and Zhang,2016),LetNet5 (Bai et al.,2021),multilayer perceptron(MLP)(Le et al.,1997),deep convolutional neural network with wide first-layer kernels(WDCNN)(Gao YD et al.,2021),and deep neural network(DNN)(Tang SN et al.,2020)are good network architectures and have been successfully used in other fault diagnostics.Therefore,they are chosen as the objects of comparison.Table 6 shows the main parameters for AlexNet,LetNet5,WDCNN,MLP,and DNN,respectively.Table 7 shows the diagnostic results of different classifiers forK
-fold cross-validation whenK
=6.Table 6 Main parameters of network structure
“*1” represents the size of the convolution kernel;“Conv1D.” represents a 1D convolutional layer with convolution kernels;“/”represents the parameter stride;Maxpool1D represents a 1D pooling layer;“Dense”represents the parameter of a fully connected layer
Table 7 Fault diagnosis accuracies of different classifier methods
Classifiers with different structures use the same training set and test set to show different results,and the classification effect proposed in this paper is more accurate and robust than other classifiers,so the results of each classifier show that the CNN structure proposed in this paper is more suitable for hydraulic valve data classification.
4.5 Visualization of classification results
The classification results are compared with the prediction result through the confusion matrix to show the accuracy of the classification results.For 10 different faults of hydraulic valves,Fig.14 shows the diagnosis results of different faults.It can be seen from Fig.14 that there is one wrong diagnosis for two faults,and the rest are correctly diagnosed.The reason for the misdiagnosis may be that the fault information of the sample is incomplete,or the extracted features do not reflect the information of the sample.However,the overall diagnosis results reflect that the accuracy of fault diagnosis can meet actual needs.
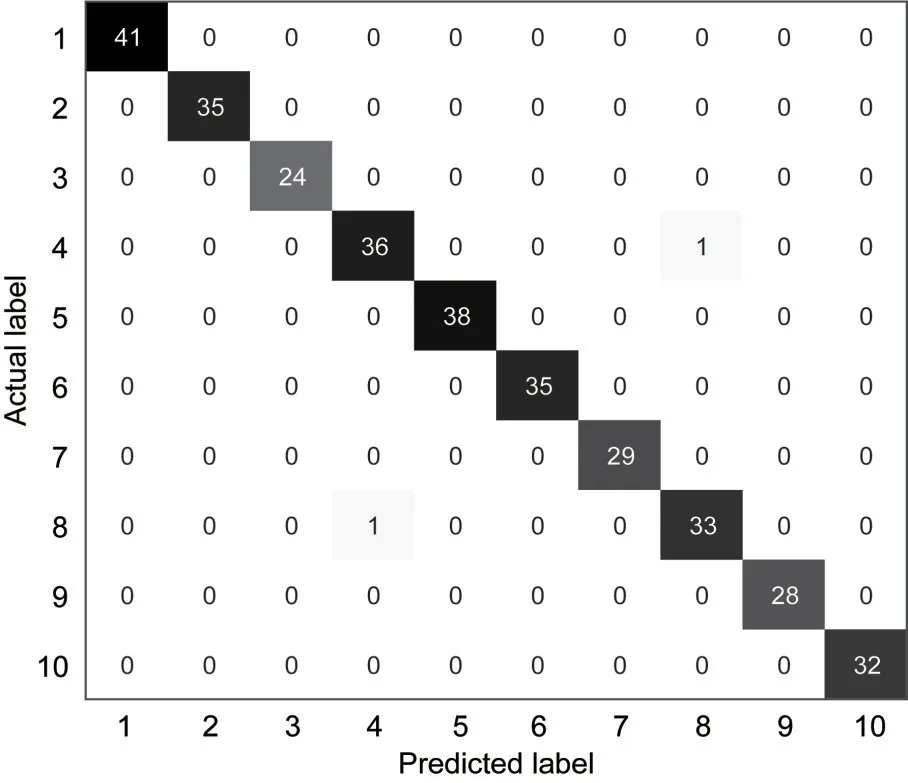
Fig.14 Confusion matrix of multi-sensor diagnostic results
T-distributed stochastic neighbor embedding(T-SNE)shows the clustering effect of the features extracted by the classifier,showing the training quality of the classifier.Fig.15 shows the feature clustering effect of the weighted method and the unweighted method.The feature points of the unweighted method are relatively scattered,and the weighted method still has some discrete feature points.It can be seen from Fig.15b that the clustering effect is better than Fig.15a,and the attention mechanism improves the training quality of the classifier.The results show that the improved information fusion technology based on the weighted method can effectively improve the fault diagnosis accuracy of hydraulic valves.
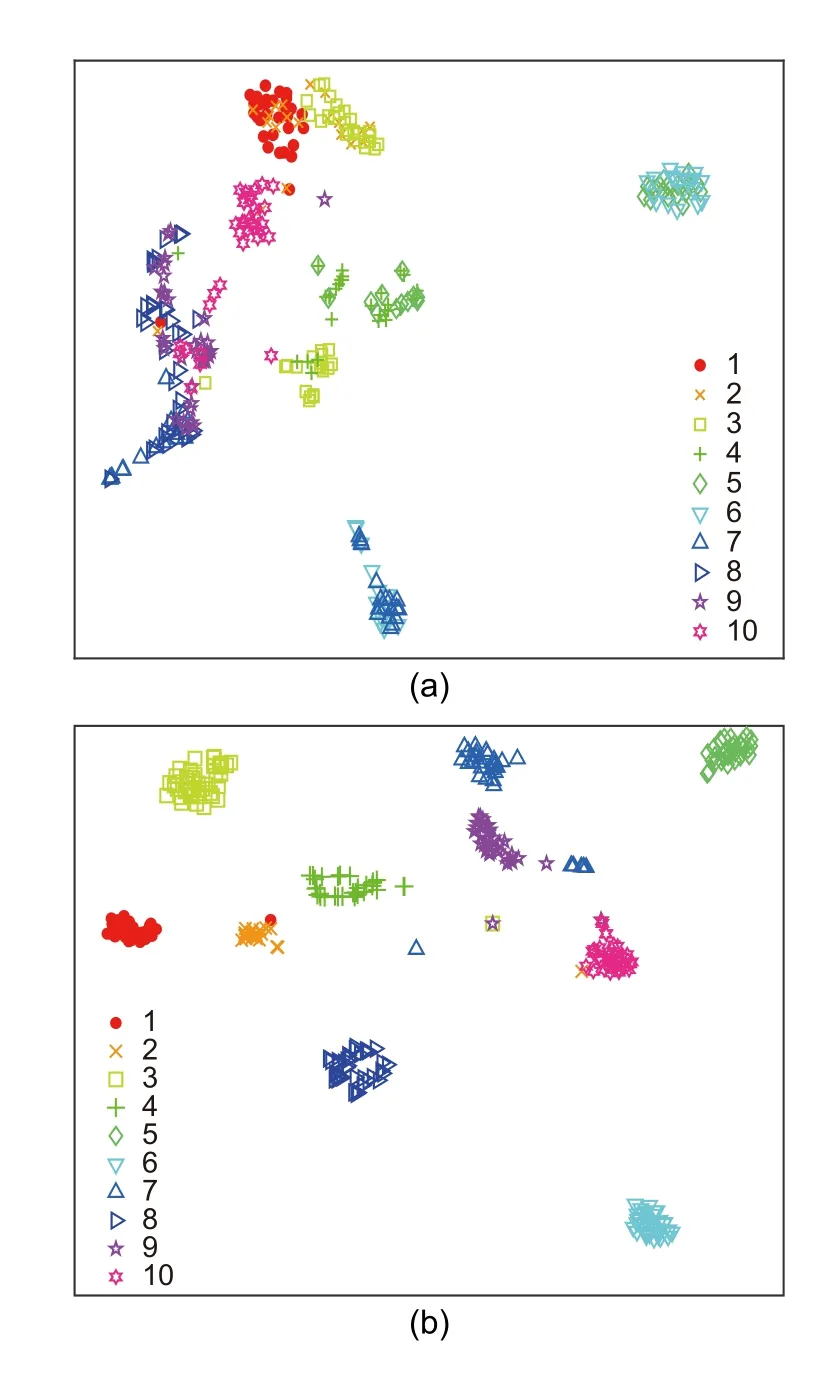
Fig.15 Unweighted and weighted T-SNE visualization results:(a)unweighted method;(b)weighted method
The visualized results show whether they are from the diagnosis result of a single fault or the clustering effect of features.Compared with the traditional diagnosis methods,the methods proposed in this paper further improve the accuracy of fault diagnosis,even if those faults include electromagnetic factors and mechanical factors.
5 Conclusions
This paper proposes a method for multi-sensor multi-dimensional feature weighted adaptive fusion to diagnose faults in a hydraulic directional valve,including mechanical wear and electromagnetic fatigue.In this method,the multi-dimensional fault information of a hydraulic directional valve is expressed by a feature set composed of multi-dimensional features.To eliminate information redundancy and interference between homogeneous sensors and multi-dimensional features,the features are weighted by the entropy weight method,and a feature set highlighting fault sensitive features is obtained.In addition,in the process of heterogeneous sensor information fusion,the attention mechanism is introduced to highlight the advantages of various sensors in heterogeneous sensor information fusion,when considering the different diagnostic abilities of different sensors for different faults.Consequently,better feature fusion results are obtained,and the accuracy of fault diagnosis is improved.In the experiment,the highest average accuracy of the proposed method can reach 99.82%.The theoretical and experimental results show that the information fusion of different types of sensors can solve the problem of a single sensor not being able to accurately describe the fault in a hydraulic directional valve.
Future research will focus on fault diagnosis technology combining digital twins and experiment.The model of the real hydraulic directional valve is established in digital space,and the sensors are fully synchronized with the real state of the hydraulic directional valve,so as to continuously reflect its state of health.
Acknowledgments
This work is supported by the National Natural Science Foundation of China (Nos.51805376 and U1709208) and the Zhejiang Provincial Natural Science Foundation of China(Nos.LY20E050028 and LD21E050001).
Author contributions
Jin-chuan SHI and Yan REN designed the research and wrote the first draft of the manuscript.Jin-chuan SHI and Hesheng TANG processed the corresponding data.Jin-chuan SHI,Yan REN,and Jia-wei XIANG revised and edited the final version.
Conflict of interest
Jin-chuan SHI,Yan REN,He-sheng TANG,and Jia-wei XIANG declare that they have no conflict of interest.
 Journal of Zhejiang University-Science A(Applied Physics & Engineering)2022年4期
- Journal of Zhejiang University-Science A(Applied Physics & Engineering)的其它文章
- Practice of flow control and smart valves
- Eccentric actuator driven by stacked electrohydrodynamic pumps
- Analysis of fretting wear behavior of unloading valve of gasoline direct injection high-pressure pump
- Data-driven fault diagnosis of control valve with missing data based on modeling and deep residual shrinkage network
- Mechanism analysis and evaluation of thermal effects on the operating point drift of servo valves
- Dynamic performance and control accuracy of a novel proportional valve with a switching technology-controlled pilot stage
