Influence of Megaregolith on the Thermal Evolution of Mercury’s SilicateShell
Jing-Chun Xie,Mian Zhang,and Cheng-Li Huang2,
1 Shanghai Astronomical Observatory,Chinese Academy of Sciences,Shanghai 200030,China
2 School of Physical Science and Technology,ShanghaiTech University,Shanghai 201210,China
3 CAS Key Laboratory of Planetary Sciences,Shanghai Astronomical Observatory,Chinese Academy of Sciences,Shanghai 200030,China;clhuang@shao.ac.cn
4 School of Astronomy and Space Science,University of Chinese Academy of Sciences,Beijing 100049,China
Abstract A so-called megaregolith layer that is considered to be produced by continuous impacts in Mercury’s early stages is integrated into the thermal evolution models of Mercury to study its influence on the thermal evolution of Mercury’s silicate shell.This research first implements a one-dimensional parametric global thermal evolution model.Our results indicate that megaregolith directly affects the thermal evolution of Mercury’s silicate shell by virtue of its good insulation performance.The way megaregolith exerts its influence is by prolonging the process of partial melting and reducing the heat loss,resulting in a thicker crust and thinner stagnant lid.As for the deep parts of the silicate shell,it is suggested that more energy is taken away from the mantle due to the longer partial melting,leading to lower temperatures below the crust compared with the case in the absence of megaregolith,which further helps to advance the formation time of the inner core and promote its final size.In addition,we also carry out a simplified two-dimensional mantle convection simulation as a supplement to the one-dimensional model.The two-dimensional simulation depicts a typical mantle plume fractional melting scenario.Our calculations indicate that megaregolith may be key to the long-term volcanic activities on Mercury.As far as the megaregolith itself is concerned,the thermal structure of this particular layer is more sensitive to thermal conductivity,suggesting that for such a highly fragmented structure,the thermal conductivity coefficient plays a key role in its evolution.Our work emphasizes the importance of megaregolith to the evolution of Mercury.
Key words:planets and satellites:terrestrial planets–planets and satellites:physical evolution–planets and satellites:interiors
1.Introduction
Establishing thermodynamic models is one of the most important methods to study planetary evolutionary history.The most commonly used one is the inversion model based on known detection findings,for example,studies of geometries of shortening tectonic features distributed across Mercury provide constraints on the thermal state of Mercury as well as possible internal compositions (e.g.,Watters et al.2009;Grott et al.2011;Achille et al.2012;Michel et al.2013;Tosi et al.2013;Byrne et al.2014;Knibbe &van Westrenen 2015).For a long time,since few evidences of younger geological activities have been found,Mercury has been suggested to be an inactive planet.However,with in-depth dig of the data returned by NASA’s MErcury Surface,Space ENvironment,GEochemistry,and Ranging (MESSENGER) mission (e.g.,Johnson &Hauck 2016),recent studies on the remnants of volcanic activities of Mercury suggested that Mercury may be more active than thought,and its volcanic activities may have continued until less than one billion years ago (Thomas et al.2014;Thomas &Rothery 2019).These works concluded that there should be some kind of insulation mechanism to keep the inside of the planet warm.
Geomorphological studies on the impact craters across the planets’ surfaces indicated that the inner solar system planets experienced intense impact bombardment incidents in their early stages,which profoundly changed and effected these planets’ surface characteristics and evolutionary processes(e.g.,Bottke &Norman 2017).Samples from the Moon’s surface and the data obtained from Apollo passive seismic network confirmed the existence of a so-called megaregolith layer that covers the lunar surface,defined as a thin,highly fragmented structure,which was caused by long term impact events (Lucey et al.2006;Petro &Pieters 2006;Zhang et al.2013;Han et al.2014;Wiggins et al.2019).Similar to the Moon,it has been suggested that megaregolith exists on Mercury’s surface as well (Grott et al.2011;Bottke &Norman 2017).However,impactors that hit Mercury can have a higher impact velocity,making Mercury’s surface more fragmented and resulting in a higher porosity of megaregolith than the Moon’s (Minton &Malhotra 2010).On the other hand,compared to the underlying crust,megaregolith shows some different characteristics,such as a much smaller thermal conductivity and a lower density,which makes it easy for megaregolith to exhibit good thermal insulation properties(e.g.,Ziethe et al.2009).Overall,megaregolith might be one of the key mechanisms to keep Mercury’s interior warm and influence the evolutionary processes of the planet,especially on its silicate shell (i.e.,from the surface to the core-mantle boundary (CMB)).
In the past few decades,there have been many studies devoted to studying the thermodynamic state of Mercury.Among them,some works focused on the generation of Mercury’s magnetic field (Cao et al.2014;Breuer et al.2015;Knibbe&van Westrenen 2018),and some studies concentrated on the evolution of the overall or local area of the planet in the context of planetary contraction (e.g.,Tosi et al.2013;Egea-González &Ruiz 2014).Methodologically,one of the most popular research methods is numerical simulations including one-dimensional (1D) and two-dimensional simulation (2D)cases.As an efficient method,a 1D simulation usually divides the study area into different compositional layers,including the crust,mantle and so on.In recent years,megaregolith has been increasingly integrated into the 1D model as an intrinsic structure (e.g.,Tosi et al.2013;Egea-González &Ruiz 2014;Knibbe &van Westrenen 2018).However,few studies have discussed the influence of megaregolith on the evolution of Mercury’s silicate shell.In addition,with the in-depth analysis of the data returned by MESSENGER and the ground-based observations,our understanding of Mercury is constantly being updated.For example,a Fe–Si–C core instead of the traditional Fe–S core is gradually being accepted(see below)(e.g.,Nittler et al.2011;Knibbe &van Westrenen 2018).In short,it is necessary to rebuild such a thermodynamic model of Mercury with the help of some renewed knowledge,to study the influence of megaregolith on the thermal evolution of Mercury’s silicate shell.
In this paper,we establish a 1D parametric global thermal evolution model,taking the megaregolith as the single variable to study the role of megaregolith.Moreover,we further carry out a simplified 2D convection simulation as a supplement to the 1D model with the help of the fully open source finite element convection code—Advanced Solver for Problems in Earth’s ConvectTion,ASPECT (Kronbichler et al.2012),for details on ASPECT,refer to:https://aspect.geodynamics.org.
The structure of this paper is as follows.We first introduce the models and methods for the 1D global model and the 2D simulation in Section 2.Next,the results are presented in Section 3.Finally,the summary is discussed in Section 4.Other details are contained in the Appendices.
2.Models and Methods
2.1.1D Model
The 1D model radially divides the planet into several layers,and the schematic diagram is depicted in Figure 1.The simulation strategy is to describe these structures with their energy-related equations.Finally,these equations are iteratively solved under the constraints of the given initial and boundary conditions until a self-consistent and stable solution is obtained.
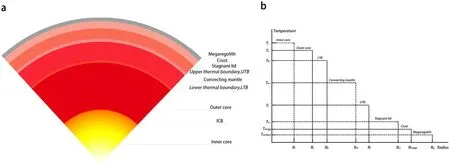
Figure 1.Schematic figure.The planet is divided into megaregolith,crust,stagnant lid,UTB,convecting mantle,LTB,outer core and inner core.(a)The 1D radial ideal model of Mercury.(b) The non-proportional Radius–Temperature diagram.
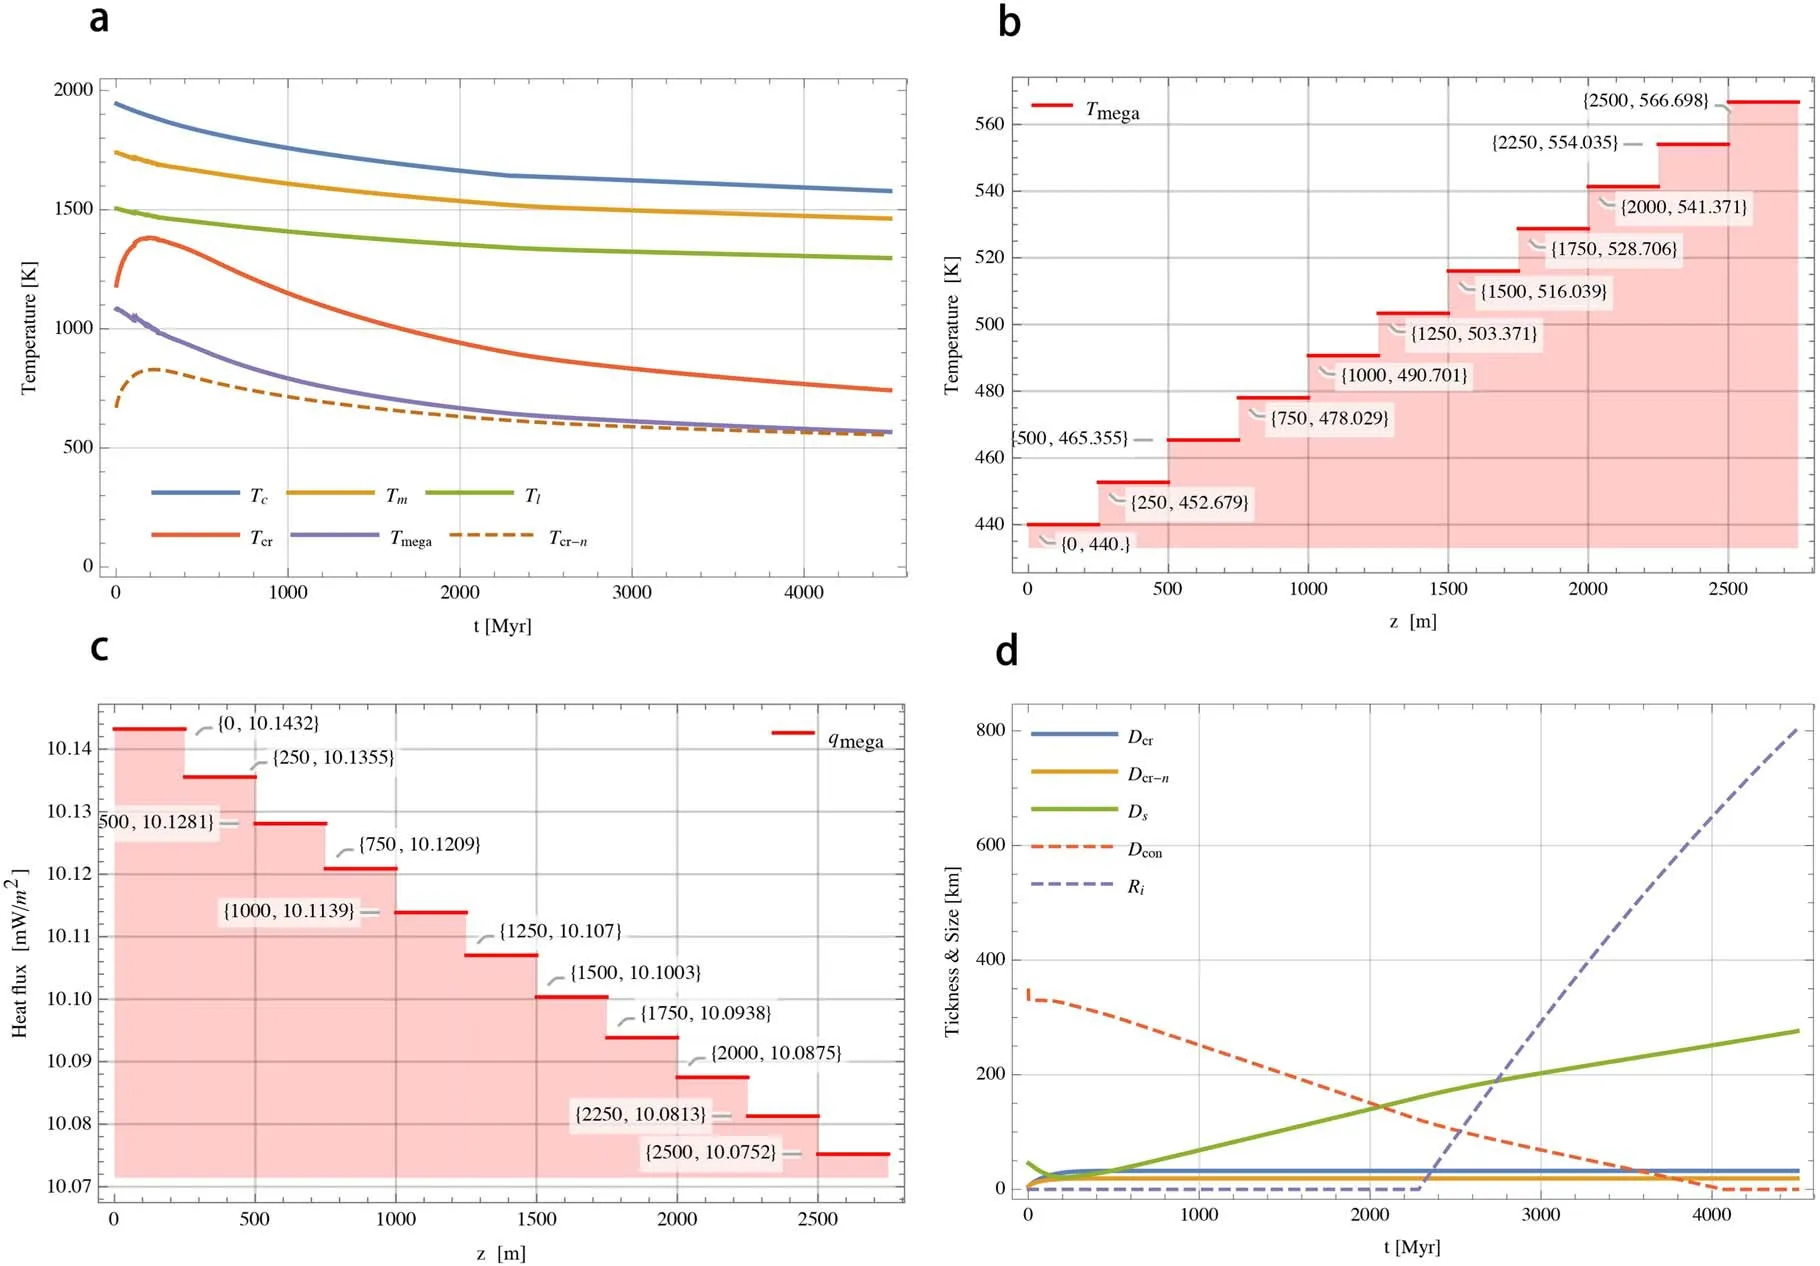
Figure 2.A set of representative results obtained using parameters listed in Tables 1 and 2.(a) Temperature versus time of several layers within Mercury’s silicate shell.Tc is the temperature at CMB,Tm is the temperature at the upper convecting mantle,Tl is the temperature at the bottom of the stagnant lid,Tcr is the temperature at the bottom of the crust and Tmega is the temperature at the bottom of megaregolith.(b)The current temperature profile in the megaregolith.(c)The current heat flux profile in the megaregolith.(d)The thickness of several layers within Mercury’s silicate shell and the size of the inner core versus time.Dcr is the thickness of the crust,Ds is the thickness of the stagnant lid,Dcon is the thickness of the convecting mantle and Ri is the inner core radius.The suffix?n signifies the case when megaregolith does not exist.
2.1.1.Thermal Evolution Model for the Silicate Shell
As mentioned in the Introduction,megaregolith is one of the products of impact events.In addition to some differences in material properties (e.g.,density,porosity),one can regard megaregolith as a part of the crust.Therefore,the heat transfer in the crust or megaregolith is controlled by the steady heat-conduction equation,which is given by

where k is the thermal conductivity and Q is the radiogenic heating production rate (RHPR).x is the thermal depth,which represents an effective thickness of a layer such that the accumulated radioactive heat equals the whole radioactive heat generated in a particular layer.This coefficient indicates the uneven distribution of the radiogenic heating producing elements (RHPE) (Srivastava &Singh 1999).i is the index representing different layers (i.e.,the crust and megaregolith).If i=mega,it means the current calculation object is megaregolith.
Combining with corresponding boundary conditions,this equation can be solved.For megaregolith,they are

where Rmegais the radius at the bottom of megaregolith,q*is the heat flow from the crust into megaregolith,Rpis the radius of the planet and Tsis the surface temperature.
Given the boundary conditions,the temperature field can be solved as follows

where Dmega=Rp?Rmegais the thickness of megaregolith.Accordingly,we can get the heat flow equation from

The above equations allow us to model megaregolith separately and obtain information such as temperature profile or heat flow profile.Moreover,for a planet with one plate like Mercury(Byrne et al.2014),a structure with high viscosity contrasts(stagnant lid) in the mantle is assumed (Pato?ka et al.2017).For the stagnant lid,its thickness variation depends on the energy equation at the base of the lithosphere (Morschhauser et al.2010),which is

where ρmand cmare the average density and specific heat capacity of the mantle,respectively.Tmis the temperature at the upper convecting mantle and Tlis the temperature at the base of the lithosphere.kmis the mantle’s thermal conductivity,Tcis the temperature at the CMB and Tbis the temperature at the lower mantle.δuand δcrepresent the thickness of the upper thermal boundary (UTB) and lower thermal boundary (LTB),respectively.ρcris the average density of the crust,Lcris the latent heat of fusion and ccris the specific heat capacity of the crust.The last two terms on the left side of this equation represent the heat flowing into the stagnant lid and through the CMB.
The energy equation of the convecting mantle is
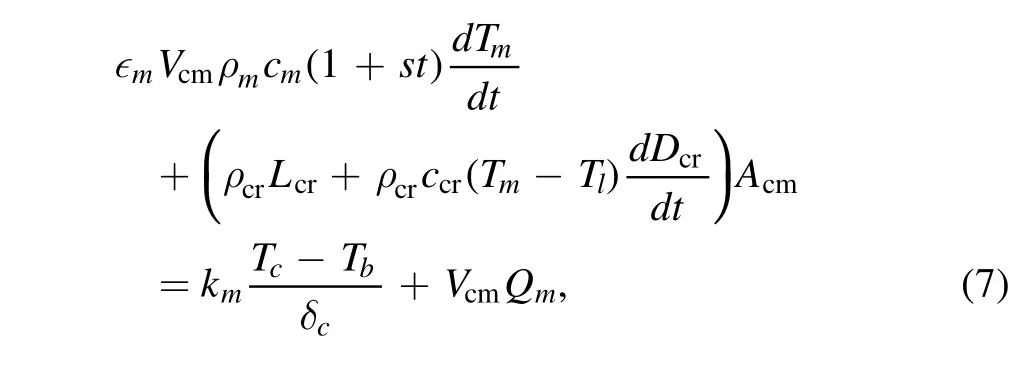
where ∈mis the ratio of the convecting mantle’s temperature to the average temperature of the convecting mantle,Vcmand Acmare the volume and the surface area of this layer,respectively,and Qmis the RHPR in this layer.
For the 1D model,the premise of Equations(4)or(5)is that the thickness of megaregolith or crust remains unchanged.For the sake of simplicity,we set the megaregolith’s thickness as a constant value.For a typical terrestrial planet,the crust is composed of the primitive crust and the secondary crust.The latter is largely related to partial melting (for details see Appendix A),which occurs in the mantle wherever the ambient temperature exceeds the solidus of one or more substances that make up the mantle.Following previous works,peridotite is regarded as the first melting partial material for planets like Mars and Mercury (Morschhauser et al.2010;Knibbe &van Westrenen 2018).In summary,considering the process of thickening of the crust,we apply a typical heat-condition equation instead of Equations (4) or (5) to describe the crustal heat equation,i.e.,where kcris the thermal conductivity of the crust and Qcris the RHPR in the crust.
2.1.2.Thermal Evolution for the Core
The geodetic studies of Mercury suggested that Mercury contains a molten outer core and solid inner core(Margot et al.2007;Knibbe&van Westrenen 2015;Steinbrügge et al.2018;Genova et al.2019).In addition,geochemical studies on major chemical elements distributed on the surface of Mercury indicated that Mercury was formed and differentiated in a highly reduced environment (Nittler et al.2011;Weider et al.2012).In this situation,it is likely that the element silicon (Si)is the dominant light constituent of Mercury’s core,to form a Fe–Si binary or a Fe–Si–X ternary/quaternary core,where X is other small contents of light elements,such as sulfur (S) or carbon (C) (e.g.,Nittler et al.2011;Knibbe et al.2020;Steenstra&van Westrenen 2020).However,due to the lack of understanding of a ternary system under high-temperature and high-pressure conditions,we chose a Fe–Si core instead.For the energy changes involved in the core’s evolutionary processes,only the latent heat and the gravitational energy contribution are taken into account.Lastly,an adiabatic core is assumed,which allows the change of the inner core radius to be associated with the temperature at CMB.
We follow the core’s energy equation from Grott et al.(2011).

where,Vcand ccare the core’s average density,volume and specific heat capacity respectively,Acis the surface area of the core,Egand Lcare the gravitational contribution and latent heat generated during the formation of the inner core respectively,and Riis the inner core’s radius.
In Equation (8),T represents the ambient temperature in the core.It can be obtained by an adiabatic relation,which is

where α0and K0are the reference thermal expansion and isothermal bulk modulus respectively,P is the ambient pressure and ρ is the local density.We can solve P and ρ by Labrosse et al.(2001),Zhang &O’Neill (2016)
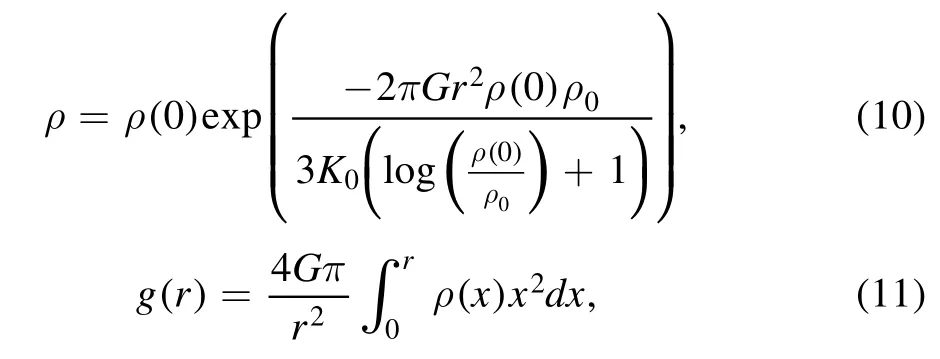
where ρ(0)is the density at the core’s center and ρ0is the core’s density at zero pressure.
Accordingly,the pressure can be calculated through

For solutions to these equations of state,see Appendix B.
Last is the melting temperature of the Fe–Si core (Tmelting),which is reported by Knibbe &van Westrenen (2018)

where X1varies between 1578 and 1678 K,β1and β2are experimentally determined parameters,Xsiis the weight fraction (wt%) of the element silicon in the core,which is constant during our simulation,and P is the local pressure.
As long as the ambient temperature equals to or is less than the melting temperature,solidification begins.Therefore,the inner core radius Rican be solved by the pressure at the intersection point,which is given by Breuer et al.(2007)

whereP(0) is the pressure at the center of the core,is the pressure at the inner-core boundary (ICB) and gcmbis the gravitational acceleration at CMB.
2.2.2D Model
Regarding the 2D model,as part of the qualitative study,we simplify the configurations of the 2D model,among which there are two very significant simplifications.The first one is to fix the temperature at CMB (Tc) as a constant,rather than evolving with time as in the 1D model.Because the simulation time of the 2D model is not as long as the 1D simulation,the temperature change at the bottom boundary is not significant.The second is that the model is only divided into three layers(conventionally named compositional fields in the ASPECT code),including megaregolith,crust and mantle.The only criterion to distinguish different layers is their respective thermal conductivities.The geometric model we use is a quarter spherical shell,with inner (Rc) and outer (Rp) radius of 2020 km and 2440 km,respectively.This model is heated from the bottom and cooled from the top,with additional heat sources in the form of shear heating and related processes,and all sides are prescribed as free-slip boundaries.The temperature boundary conditions are prescribed according to the initial values at each side,and a temperature anomaly of 150 K is added near the bottom of the shell to make the geometry asymmetric to start the model running.
The 2D numerical simulation is carried out through the finite element convection code,ASPECT.The framework for calculating the generation and migration of molten materials is provided by Dannberg &Heister (2016).Based on their work,we further make some appropriate adjustments,mainly modifying the code to make the framework support multiple field (e.g.,crust,megaregolith) calculation and replacing the melting parameterization by what we apply in the 1D simulation.For melting parameterization,refer to Appendix C.Additional technical details can be accessed through the link provided by supporting information.
2.3.Parameters
The input values of parameters play a key role in the computational results of a thermal model.There are basically two kinds of parameters.The first category is the data obtained through observations,including ground-based observations and spacecraft in situ detections,namely fixed parameters,such as the average radius of the planet and the mean surface temperature (e.g.,Solomon et al.2007;Peplowski et al.2011;Perry et al.2011;Williams et al.2011).The second category is empirical/experimental parameters,which are characterized by a high degree of uncertainty,called uncertain parameters,such as the thickness of the silicate shell and the concentrations of RHPE in the mantle (e.g.,Peplowski et al.2011;Michel et al.2013;Knibbe &van Westrenen 2018;Knibbe et al.2020).
Among these uncertain parameters,the temperature at CMB(Tc) and the weight fractions of the main light constituent of Mercury’s core (Xwt%) have attracted much attention.An important aspect is that these two parameters are closely related to the formation time and size of the inner core,and the latter can have significant influences on the evolution of the entire planet (Dumberry &Rivoldini 2014;Breuer et al.2015;Genova et al.2019).According to our arguments in Section 2.1.2,the formation of an inner core requires the ambient temperature everywhere in the core to be lower than(or equivalent to) the melting temperature,which is controlled by Tcand Xwt%.In general,we can start from two examples.Previous research proposed a possible solid FeS layer at the top of the core to account for the large average bulk density inferred for Mercury’s silicate shell given by MESSENGER’s X-Ray Spectrometer (XRS) measurements (Smith et al.2012).However,this assumption requires the core to be sulfur-rich,so that FeS would precipitate within the core at moderate pressure(Hauck et al.2013;Breuer et al.2015).If this hypothesis is true,then the current CMB temperature could be in the range 1600–1700 K,which can provide constraints on the input parameters (e.g.,Michel et al.2013).As we discussed in Section 2.1.2,Mercury is more likely to contain a Fe–Si–X than a Fe–S dominant core (Nittler et al.2011;Knibbe et al.2020;Steenstra&van Westrenen 2020),which implies that the FeS layer may not exist (Cartier et al.2020).Therefore,whether there is a FeS layer is still debatable.On the other hand,since Mercury’s magnetic field was found (Anderson et al.2008,2011,2012),multiple implemented dynamo simulations that are consistent with the field intensity of the magnetic field require the inner core to be smaller than 1200 km (e.g.,Cao et al.2014;Tian et al.2015;Takahashi et al.2019).Moreover,as for the core’s composition,Knibbe et al.(2020) suggested a series of possible combinations of weight fractions of liquid Fe–Si–C metal alloys that meet the constraints by geodetic measurements and dynamo simulations.Although only a few binary composition(Fe–Si)combinations satisfy the constraints,we still can get a rough range for silicon’s concentration around 5wt%and Tcabout 2000 K.For the other fixed parameters,we choose those parameters that are widely applied in thermodynamic studies of terrestrial planets(e.g.,Grott et al.2011;Hauck et al.2013;Tosi et al.2013;Padovan et al.2017;Knibbe &van Westrenen 2018).Part of them can be found in Table 1.
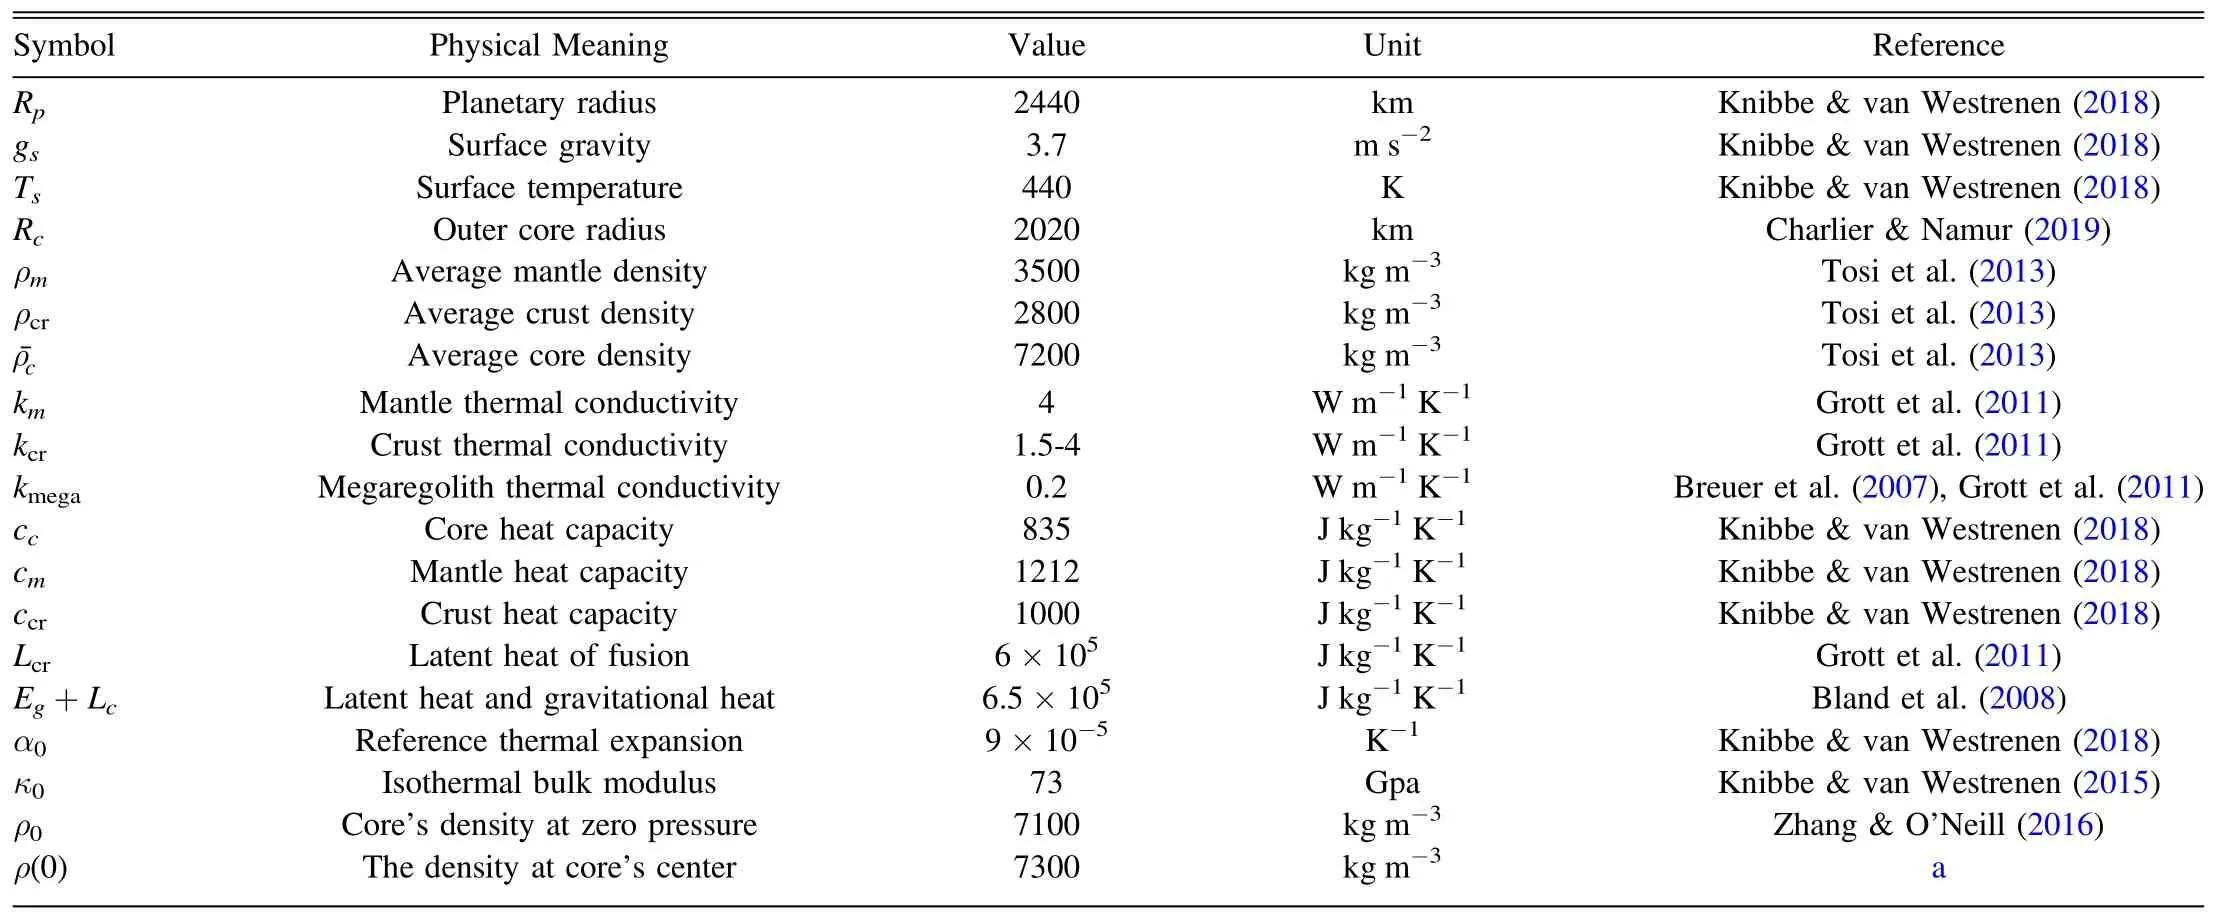
Table 1 Part of the Parameters used in Simulation
Since we introduce megaregolith into our model,it is necessary to explain the key parameters related to this layer.As is obvious from Equation (1),the RHPR (in fact,the bulk density of megaregolith,the contents of RHPE),thermal conductivity and thermal depth control the process of heatconduction for megaregolith.Traditionally,high-resolution gravity field and topography data can be used to investigate crustal density for terrestrial bodies (Gong et al.2016;Goossens et al.2017),but the resolution of Mercury’s field is too low to calculate a precise crustal density (Mazarico et al.2014).In addition,the XRS and Gamma-Ray Spectrometer(GRS) carried by the MESSENGER spacecraft measured the contents and distribution of the main elements on the surface of Mercury and the main terrane types as well(Nittler et al.2011;Evans et al.2012;Kaaden et al.2017).A new method was proposed to calculate the grain density of the crust by using normative mineralogy,and the bulk density can be obtained through the relation with the grain density:where ρbis the bulk density,φ is the porosity and ρgis the grain density(Sori 2018).Compared to the Moon,an impactor that hits Mercury generally has a higher velocity,resulting in a larger porosity in Mercury’s megaregolith (e.g.,Minton &Malhotra 2010).For this reason,we assume a porosity that is between 18%and 20%,which is consistent with the value used in other studies (e.g.,Grott et al.2011).Generally,for thermal evolution studies,the RHPE is assumed to be uniformly distributed in the crust and mantle (Grott et al.2011;Michel et al.2013;Tosi et al.2013;Egea-González &Ruiz 2014;Knibbe &van Westrenen 2018).Taking into account that the materials of megaregolith originate from the crust,we also assume that the RHPE in megaregolith is evenly distributed,that is to say,set the thermal depth:x=Dmega.At the same time,the contents of RHPE are re-distributed according to the mass ratio of megaregolith to the crust,i.e.,0 <γ <1,whereare the mass of RHPE in megaregolith and initial mass of RHPE in the crust,respectively,noting that the thickness used to calculate mmega(the mass of megaregolith) varies from 1 km to 5 km (Egea-González et al.2012).The measurement of MESSENGER GRS reveals that the average abundances of the main heating producing elements on the surface of Mercury are 1150±220 ppm K (potassium),90±20 ppb U (uranium)and 220±60 ppb Th(thorium)at present day(Peplowski et al.2011).We assume that the present-day surface concentrations are representative of the average crust,resulting in the initial crustal radioactive heating rates on the order of 10?10W kg?1,which is consistent with other studies’ assumptions (e.g.,Peplowski et al.2011;Knibbe &van Westrenen 2018).Meanwhile,the initial concentration of RHPE in the mantle is assumed to be about 37% of the surface measured value (e.g.,Tosi et al.2013;Padovan et al.2017),which implies the concentrations in the primordial mantle of 425.5±81.4 ppm K,33.3±7.4 ppb U and 81.4±22.2 ppb Th.Details of the fractionation of heat producing elements can be found in Morschhauser et al.(2010).
For the thermal conductivity,this coefficient is closely linked to porosity,temperature or pressure and other factors.In the superficial environment of a terrestrial planet,giving priority to porosity (e.g.,Schumacher &Breuer 2006),and the thermal conductivity of megaregolith and crust can differ by one or two orders of magnitude,while the former is usually considered in the range of 0.075–0.2 W m?1K?1(Breuer et al.2007;Grott et al.2011).For the remaining parameters,we list them in Table 1.
For the 2D simulation,all the necessary files (including the parameters file) are stored in a repository that can be accessed through the link provided by the Supporting Information.The descriptions of the initial temperature profile can be found below.
3.Results
3.1.1D Model
3.1.1.Representative Results
In order to compare the results,we specify that all models have the same initial condition parameters,which are listed in Table 2.The models are iterated until a self-consistent result is obtained.Hereafter,we show a set of representative results.By default,these displayed results are calculated in the presence of megaregolith.If there is a suffix?n after the name of the result,it means that the result is computed in the absence of megaregolith.
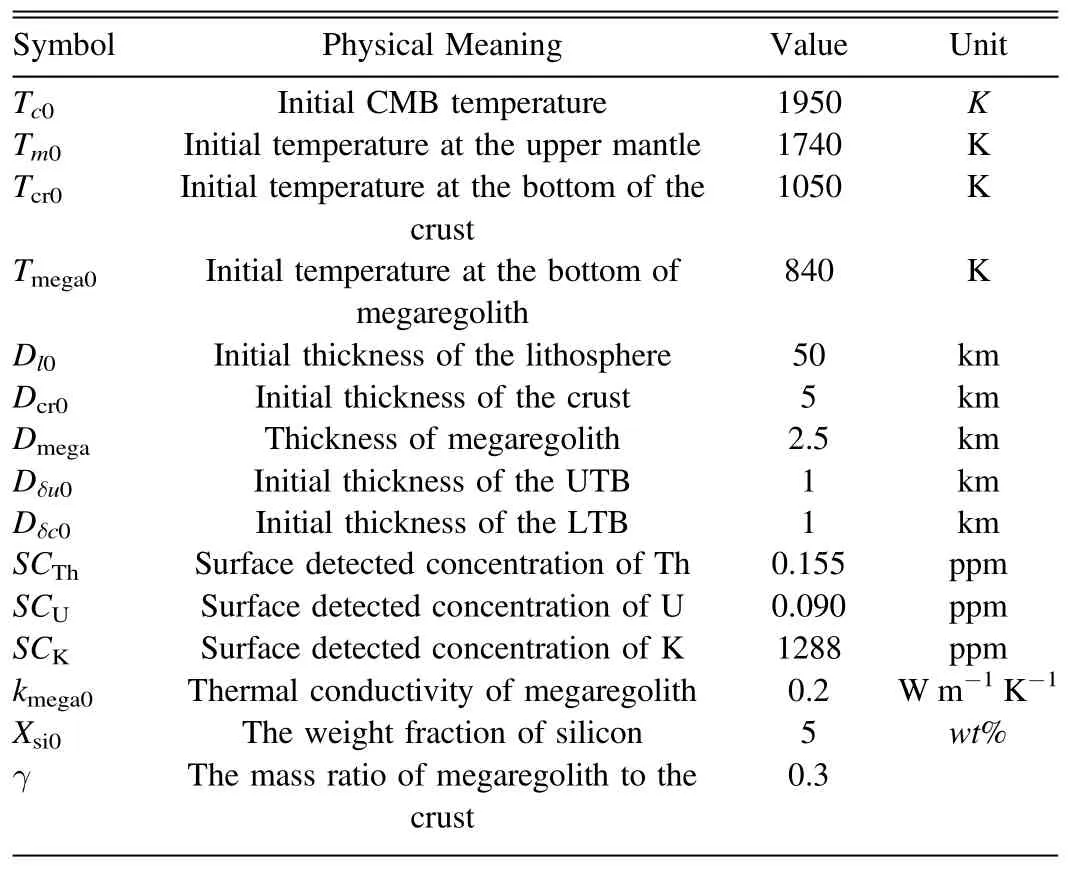
Table 2 Representative Initial Condition Parameters
As we can see in Figure 2(a),it depicts the temperature versus time of several layers within the silicate shell.A notable feature is that all temperatures decrease with time except for the temperature at the bottom of the crust (Tcr),which experiences a dramatic rise in the early stages.On the other hand,for the temperature at the CMB (Tc),the temperature in the upper convecting mantle (Tm) and the temperature at the bottom of the stagnant lid (Tl),the decrease of these temperatures begins to slow down due to the energy released during the formation of the inner core at the time of about 2.3 Gyr.At present,the values of Tc,Tmand Tlare about 1578,1462 and 1296 K,respectively.At the shallow depth,the current value of Tcris close to 741 K,compared to the temperature at the bottom of the crust without megaregolith (Tcr?n),and the temperature difference is around 190 K.Previous studies have suggested that Tcr?nranges around 700–900 K to satisfy the temperature calculated by the ductile strength model in a homogenous crust when faults initiated as early as 3.8 Gyr years ago(e.g.,Nimmo&Watters 2004;Egea-González et al.2012).The computed Tcr?nat that time is about 787 K,which is located within the temperature range above.For these computed temperatures,we compare them to some parametric works (e.g.,Figure 4(a) in Tosi et al.2013;Figure 3(a)in Knibbe&van Westrenen 2018),and we find that our results are generally smaller.We think that the possible reasons for this result are as follows.First,we follow Morschhauser et al.(2010)to model the fractionation of RHPE in the crust and mantle.Part of RHPE belonging to the mantle enters the crust along with partial melting,thereby reducing the internal heating rate in the mantle (see below).Second,the choice of the core’s composition leads to the late formation and a smaller size of the inner core,which in turn reduces the energy released by the core (see below).The third point is that the difference in the initial conditions will affect the final results.Nevertheless,since this paper focuses on the analysis of the influences brought by megaregolith,these differences in model settings would not affect the validity of our conclusions.
In terms of megaregolith,the present value of the temperature at the bottom of megaregolith (Tmega) is close to 566 K,and the difference between the initial temperature and the current temperature is not as large as other presented temperatures.We further compute the temperature and heat flux profile with a depth interval of 250 m in megaregolith at present day,which are shown in Figures 2(b) and 2(c),respectively.Both results are presented in the form of a data set,where the first data represent depth and the second data correspond to the temperature or heat flux.It is easy to point out that the precise current value of Tmegaand the surface heat flux (qs) are 566.7 K and 10.1 mW m?2,respectively.In addition,the present derivative of the temperature with respect to depthis of order of 5.0×10?2K m?1,and the present derivative of the heat flux with respect to depthis of order of?2×10?5mW m?3(see Supplementary Figure S1).These results suggest that megaregolith has good insulation performance.In order to analyze the key factors that control the thermal structure of megaregolith,we implement end-member calculations.According to Equation(4),we mainly discuss the thermal conductivity(k)and the amount of internal radioactive heating source (represented by γ,see Section 2.3).Our calculation demonstrates that compared to γ,a slight change in k would bring dozens of temperature changes and a larger fluctuation of heat flux.This calculation concludes that k is the key factor controlling the thermal profile of megaregolith.Meanwhile,it is clearly apparent that both temperature and heat flux oscillate violently in the early stages of the simulation,and then gradually stabilize until close to zero.The oscillation time is roughly the same as the partial melting time,indicating the relationships between megaregolith and the process of partial melting (see below).This part of the results is shown in Supplementary Figures S2 and S3.
Figure 2(d)illustrates the thickness of several layers and the size of the inner core against time.After the model running is done,we have a crust with a thickness (Dcr) of around 32 km and a 20 km thick crust(Dcr?n)in the absence of megaregolith.Both results are located within the range of the mean crustal thickness calculated by geoid-topography ratios(Padovan et al.2015;Sori 2018).At the same time,a stagnant lid 276 km thick(Ds) in the presence of megaregolith is also obtained.We further calculate the thickness of the convecting mantle (Dcon).It is defined as the region between Rm(the radius of the upper convecting mantle) and Rb(the radius at the bottom of convecting mantle) (e.g.,Knibbe &van Westrenen 2018).If the thickness is equivalent to zero,the mantle convection stops.Our calculations conclude that the mantle convection ceases near 4 Gyr in the presence of megaregolith,which is around 600 Myr longer(i.e.,3.4 Gyr)than the case when megaregolith does not exist.Both of the results are in line with the views of some studies that Mercury’s mantle convection stopped at least 500 Myr ago (e.g.,Tosi et al.2013;Knibbe &van Westrenen 2018;Thiriet et al.2019).
As mentioned earlier,the geodetic studies suggested that Mercury possesses a solid inner core.We calculate that the inner core’s radius (Ri) is about 803.5 km,which accounts for 40% of the radius of the entire core (Rc=2020 km).Meanwhile,it can be seen from this figure that the inner core is formed at around 2.29 Gyr.We compare our results with other parametric studies,and find that our calculations are smaller(e.g.,about 1200 km in Knibbe &van Westrenen 2018;admissible value of around 1000 km in Cao et al.2014).The possible reasons we suggest are as follows.First,we chose a binary Fe–Si core,which excludes other light elements,like sulfur.However,the presence of other light elements (e.g.,S and C) can not only change the concentrations of silicon but also effectively reduce the melting temperature within the core(Morard et al.2007;Buono &Walker 2011;Knibbe et al.2020).Second,we assume the temperature in the core follows an adiabatic relationship (Section 2.1.2).Previous studies implied that Mercury contains a thermally stratified outer core,which results in a sub-adiabatic heat flow at the CMB (e.g.,Christensen &Wicht 2008;Dumberry &Rivoldini 2014;Edgington et al.2019),and such a stratified core would favor an early formation of inner core and a larger size(e.g.,Knibbe&van Westrenen 2018).Nevertheless,a precise size of the inner core is still unknown,although several studies suggested that the size is smaller than 1200 km (Steinbrügge et al.2018;Charlier &Namur 2019;Genova et al.2019;Takahashi et al.2019).However,the formation of the inner core has been suggested to be associated with generation of the magnetic field(Laneuville et al.2014;Rückriemen et al.2015).There were studies found that Mercury’s magnetic field already existed as early as 3.7 Gyr ago (Johnson et al.2015),and the conflict in time suggests that a thermally driven dynamo is needed to support the magnetic field before the inner core’s growth(e.g.,Grott et al.2011;Tosi et al.2013).
3.1.2.Comparison of the Results
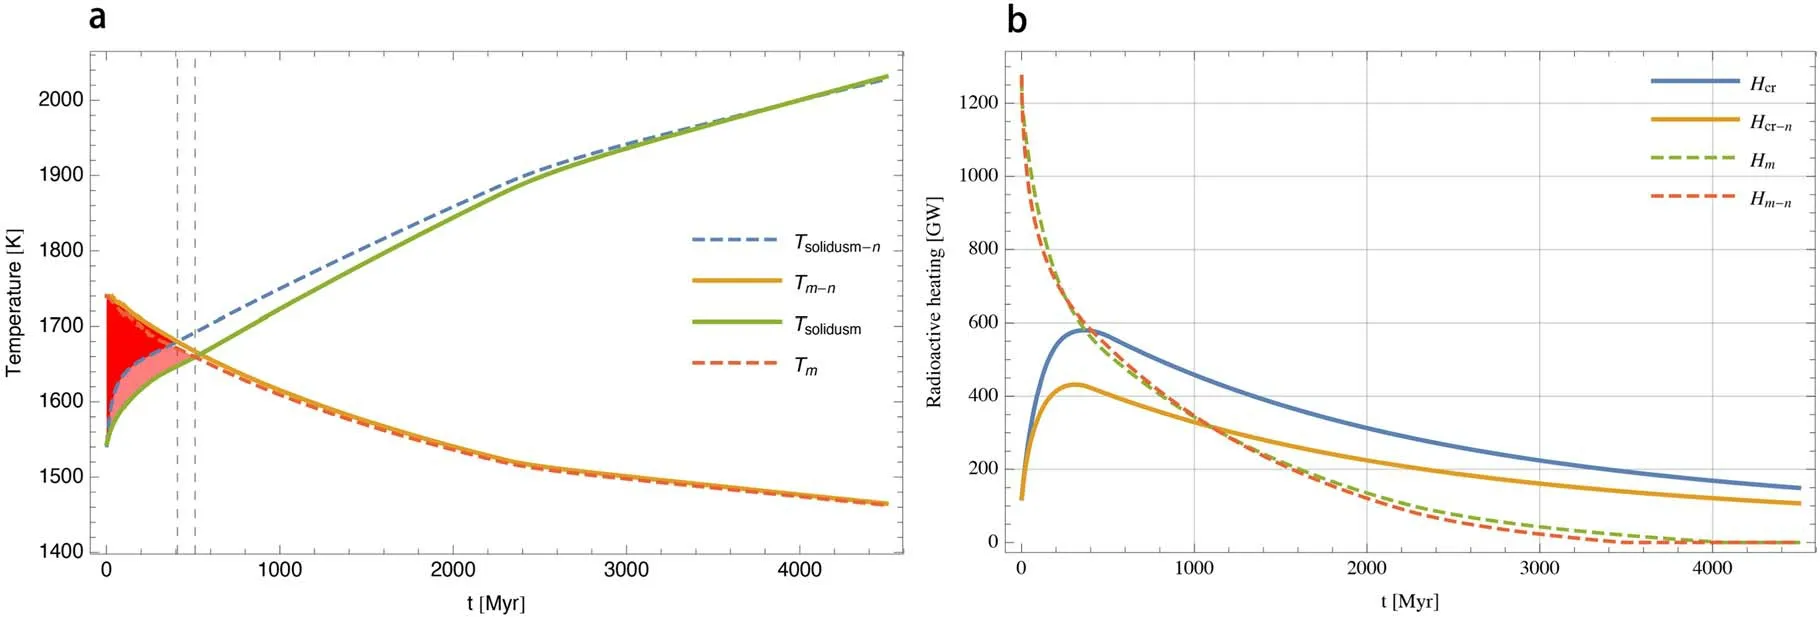
Figure 3.(a) The partial melting scenario in the presence of megaregolith.Tsolidusm is the solidus at the upper convecting mantle.Tm is the temperature at the upper convecting mantle.(b) The amount of radioactive heating in the crust (Hcr) and mantle (Hm).The suffix?n signifies the case when megaregolith does not exist.
We can ascertain that,first,all these three shown temperature differences are negative,which mean that the temperature is lower in the presence of megaregolith.Second,all have a similar variation curve against time,displaying a“V”shape.In other words,before the end of partial melting,the temperature differences manifest a rough tendency to increase.In addition to the temperature difference at the CMB (TDc),both the temperature difference in the upper convecting mantle (TDm)and the temperature at the bottom of the stagnant lid(TDl)have violent oscillations in the early stage of evolution,while TDcis more significantly affected by the formation of the inner core.
Before we analyze the reasons for this result,our calculations indicate that TDm>TDl>TDc,implying that the temperature in the upper convecting mantle(Tm)is the most affected.As we know from Section 2.1.2,both the temperature at CMB (Tc)and the temperature at the bottom of the stagnant lid (Tl) are related to Tm.Hence,we only analyze TDm.According to Equation (7),the factors affecting Tmcan be roughly divided into two categories.The first one is concerned with partial melting,which includes the thickening of the crust,the energy exchange associated with the phase change of mantle material and the migration of RHPE (Morschhauser et al.2010).The other one is about the net heat flow.
We determine whether partial melting occurs according to the relative value between the ambient temperature and the solidus of the main constituent of the lithosphere-mantle (for details refer to Appendix A).The partial melting scenarios are depicted in Figure 3(a).The region where partial melting occurs is marked in red,while the pink region indicates that the melting lasted longer when megaregolith was present.The gray dashed lines mark the end time of partial melting and the time lag is near 100 Myr.Figure 3(b) displays the amount of radioactive heating over time in the convecting mantle (Hm)and the crust (Hcr).It is evident that Hcrincreases rapidly with the thickening of the crust (refer to Figure 2(d)),and a lower radioactive heating rate in the mantle (Qm) is also obtained(Supplementary Figure S4(a)).All of these suggest that more radioactive heat and the energy stored in material itself are extracted from the mantle in the presence of megaregolith.As for the heat flux,our calculations suggest that the heat flow has limited impacts on the overall temperature compared with the radioactive heating.The results above explain why the temperature differences are negative.In short,we conclude that the reduction of radioactive heating rates in the mantle is the main reason that causes TDmto be negative.
Next,we show the differences in thickness and size of several layers due to existence of megaregolith,and the results are given in supplementary Figure S4(b).In addition to Ds,none of the other values are less than zero.In fact,a thinner stagnant lid (Ds<0) and a thicker convecting mantle region(Dcon>0)are the results of less internal heat loss(e.g.,Thiriet et al.2019),and a thicker crust means that more molten materials are created to form a secondary crust (e.g.,Beuthe et al.2020;Tosi&Padovan 2021).We can also find that when megaregolith exists,the radius of the inner core is about 8.5 km larger at present,and the time when the inner core formed is advanced by 20 Myr(Supplementary Figure S4(b)).The reason is that the formation of the inner core is the result when the temperature at CMB (Tc) is less than or equal to the core’s melting temperature (Tmelting),and the latter is determined by the pressure at the ICBOne can easily find that the crystallization temperature is fixed at a certain point radius (r)when the content of silicon is constant (see Section 2.1.2).Therefore,Tccontrols the time of the formation of the inner core and its final size,and it reduces the temperature inside the core to the temperature satisfying the beginning of crystallization through an adiabatic relation.As we discussed earlier,we already know that TDc<0,hence,the time of the formation of inner core is earlier and its final size is larger in the presence of megaregolith.
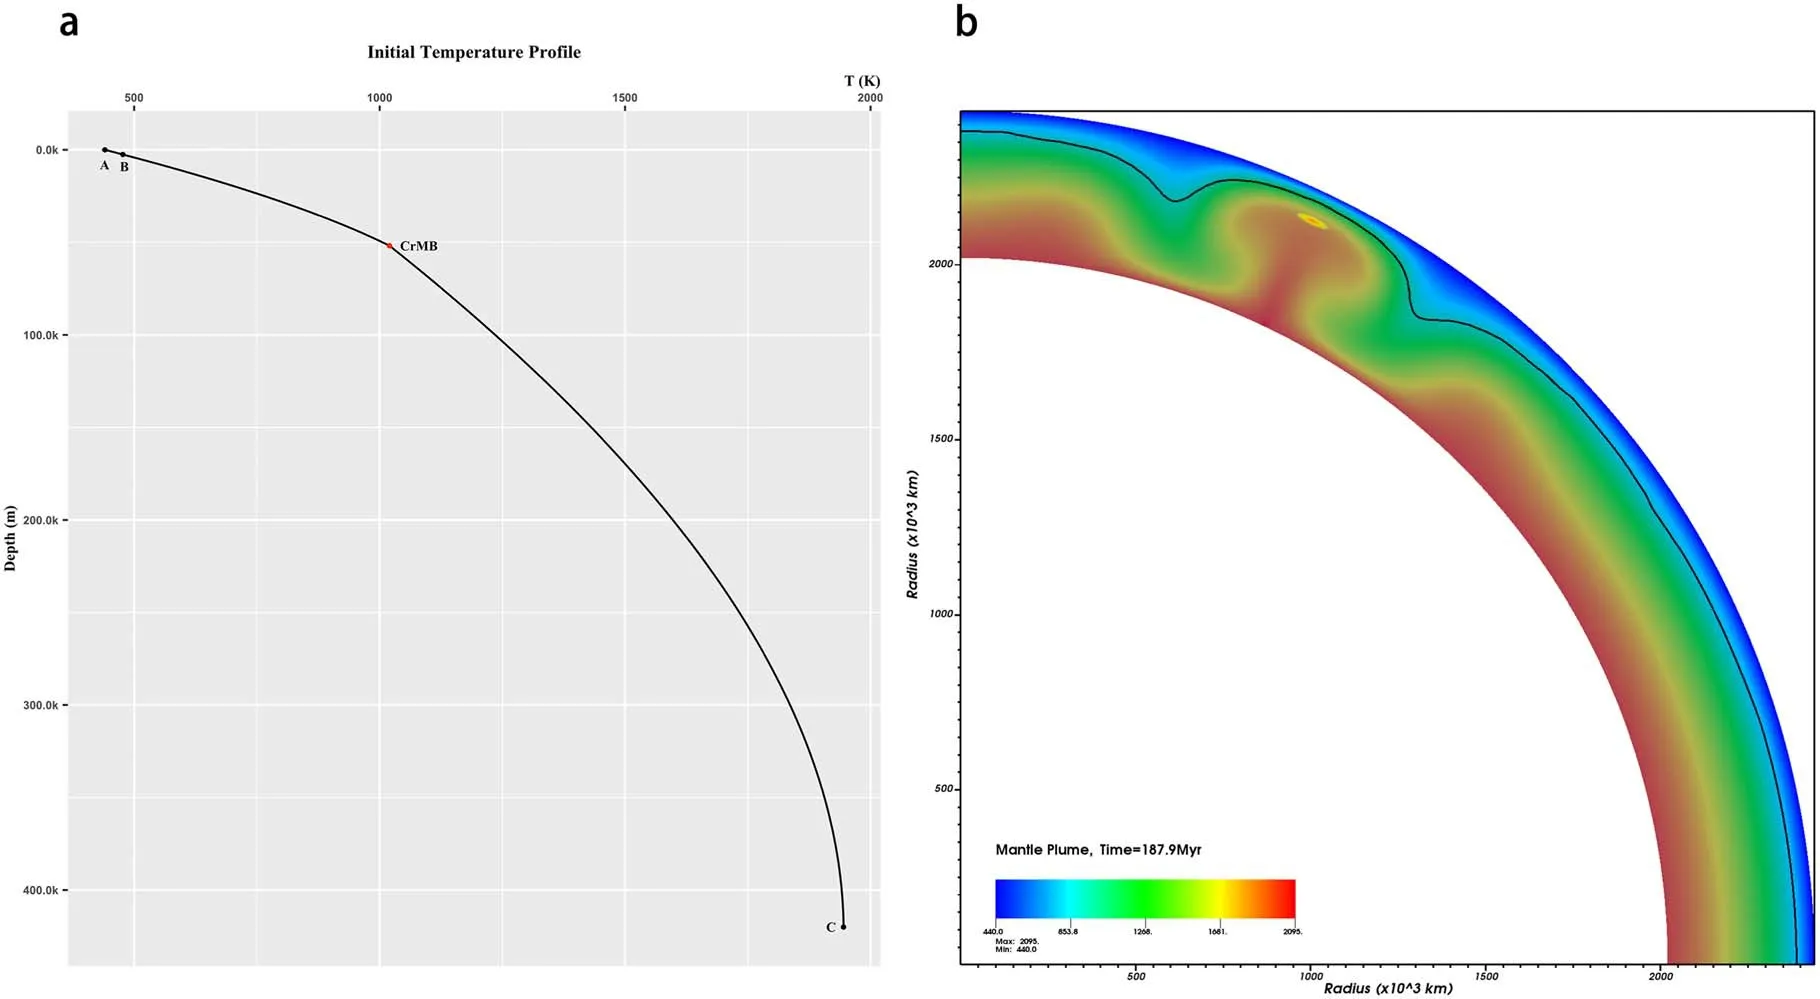
Figure 4.(a) The initial temperature profile,where the surface (point A) and the bottom temperatures (point C) are 440 K and 1945 K,respectively.The point B represents the boundary between megaregolith and crust,and the red point indicates the crust-mantle boundary (CrMB).Note that the crust and the stagnant lid are integrated into one layer,collectively referred to as the crust.The tick marks on the vertical(depth)axis are in km,which stands for 103 m.(b)The snapshot of the 2D model at 187.9 Myr.The black solid line represents the outline of the mantle,and at the top of the plume is the enriched material.The legend shows the temperature range where the minimal temperature is 440 K and the maximal temperature is 2095 K (bottom temperature (1945 K)+temperature anomaly (150 K)).
Overall,from our 1D simulation,owing to the good thermal insulation properties of megaregolith,it has great influences on the evolution of Mercury,especially in the early stages of the evolutionary process.The main way megaregolith exerts its impacts is to significantly prolong the process of partial melting that occurs in the early stage of evolution and reduce the internal heat loss,so as to obtain a thicker crust and a larger inner core.
3.2.2D Model
As mentioned in the Introduction,the long-term volcanic activities on Mercury suggest some kinds of mechanisms to help produce or preserve molten materials(Thomas et al.2014;Thomas &Rothery 2019).Although the results from our 1D simulation indeed suggest that a longer partial melting process can be a result of the existence of megaregolith,it does not seem to explain whether megaregolith can help preserve the molten materials.Therefore,we further implement a simplified 2D simulation aiming to reveal the possible link between them.As required by the 2D model,a user-defined initial temperature profile is needed.For this purpose,we assume that the thermal profile of the research domain can be determined by the conductive heat transfer equation.The boundary conditions that are used to solve the conductive equation(e.g.,qc,Tcr)are taken from our 1D model(the version without megaregolith)at 1 Myr.The computed initial temperature profile is plotted in Figure 4(a),where the surface temperature is 440 K and the bottom temperature is 1945 K.
As part of the qualitative study,our 2D model only simulates 300 Myr.Although the simulation time is much less than the 4500 Myr of the 1D model,the 2D simulation has captured the key features.In principle,this 2D simulation depicts a typical mantle plume fractional melting scenario (Figure 4(b)).Specifically,the plume moves upward from the CMB due to its high buoyancy (temperature).The high temperature materials inside the plume reach a shallower place and cause the ambient temperature to exceed the solidus,and melting occurs with the rise of the mantle plume,moving further up and spreading laterally along the base of the lithosphere (e.g.,Loper 1991;Nikishin et al.2002;Ziegler &Cloetingh 2004).As the melting continues,the molten material moves upwards and accumulates in the top layer while the depleted source rocks remain in a layer below.Once the molten materials freeze,enriched materials will be created (Dannberg &Heister 2016).
As we know,buoyancy is the main driving force for the plume’s ascent(e.g.,Brown&Lesher 2014).According to the conclusions obtained from our 1D model,the existence of megaregolith drops the cooling rate of the planet,resulting in a higher internal average temperature,which can further reduce the density of the materials in the plume,thereby leading to a greater buoyancy or a greater ascending speed.This allows the melting to start earlier in the presence of megaregolith,which can be observed in Figure 5.Next,we calculate the value of depletion,which measures the fraction of the source rock that has been molten.The results are depicted in Figure 5(a).It is clear that when megaregolith is present,the value of depletion is larger,meaning that more molten materials are produced from the source rocks.On the other hand,in Figure 5(b),we give the maximal melt fraction,which is used to indicate how much enriched materials are created.Therefore,what Figure 5(b) tells us is that when megaregolith is present,there is less molten material to freeze into enriched material.
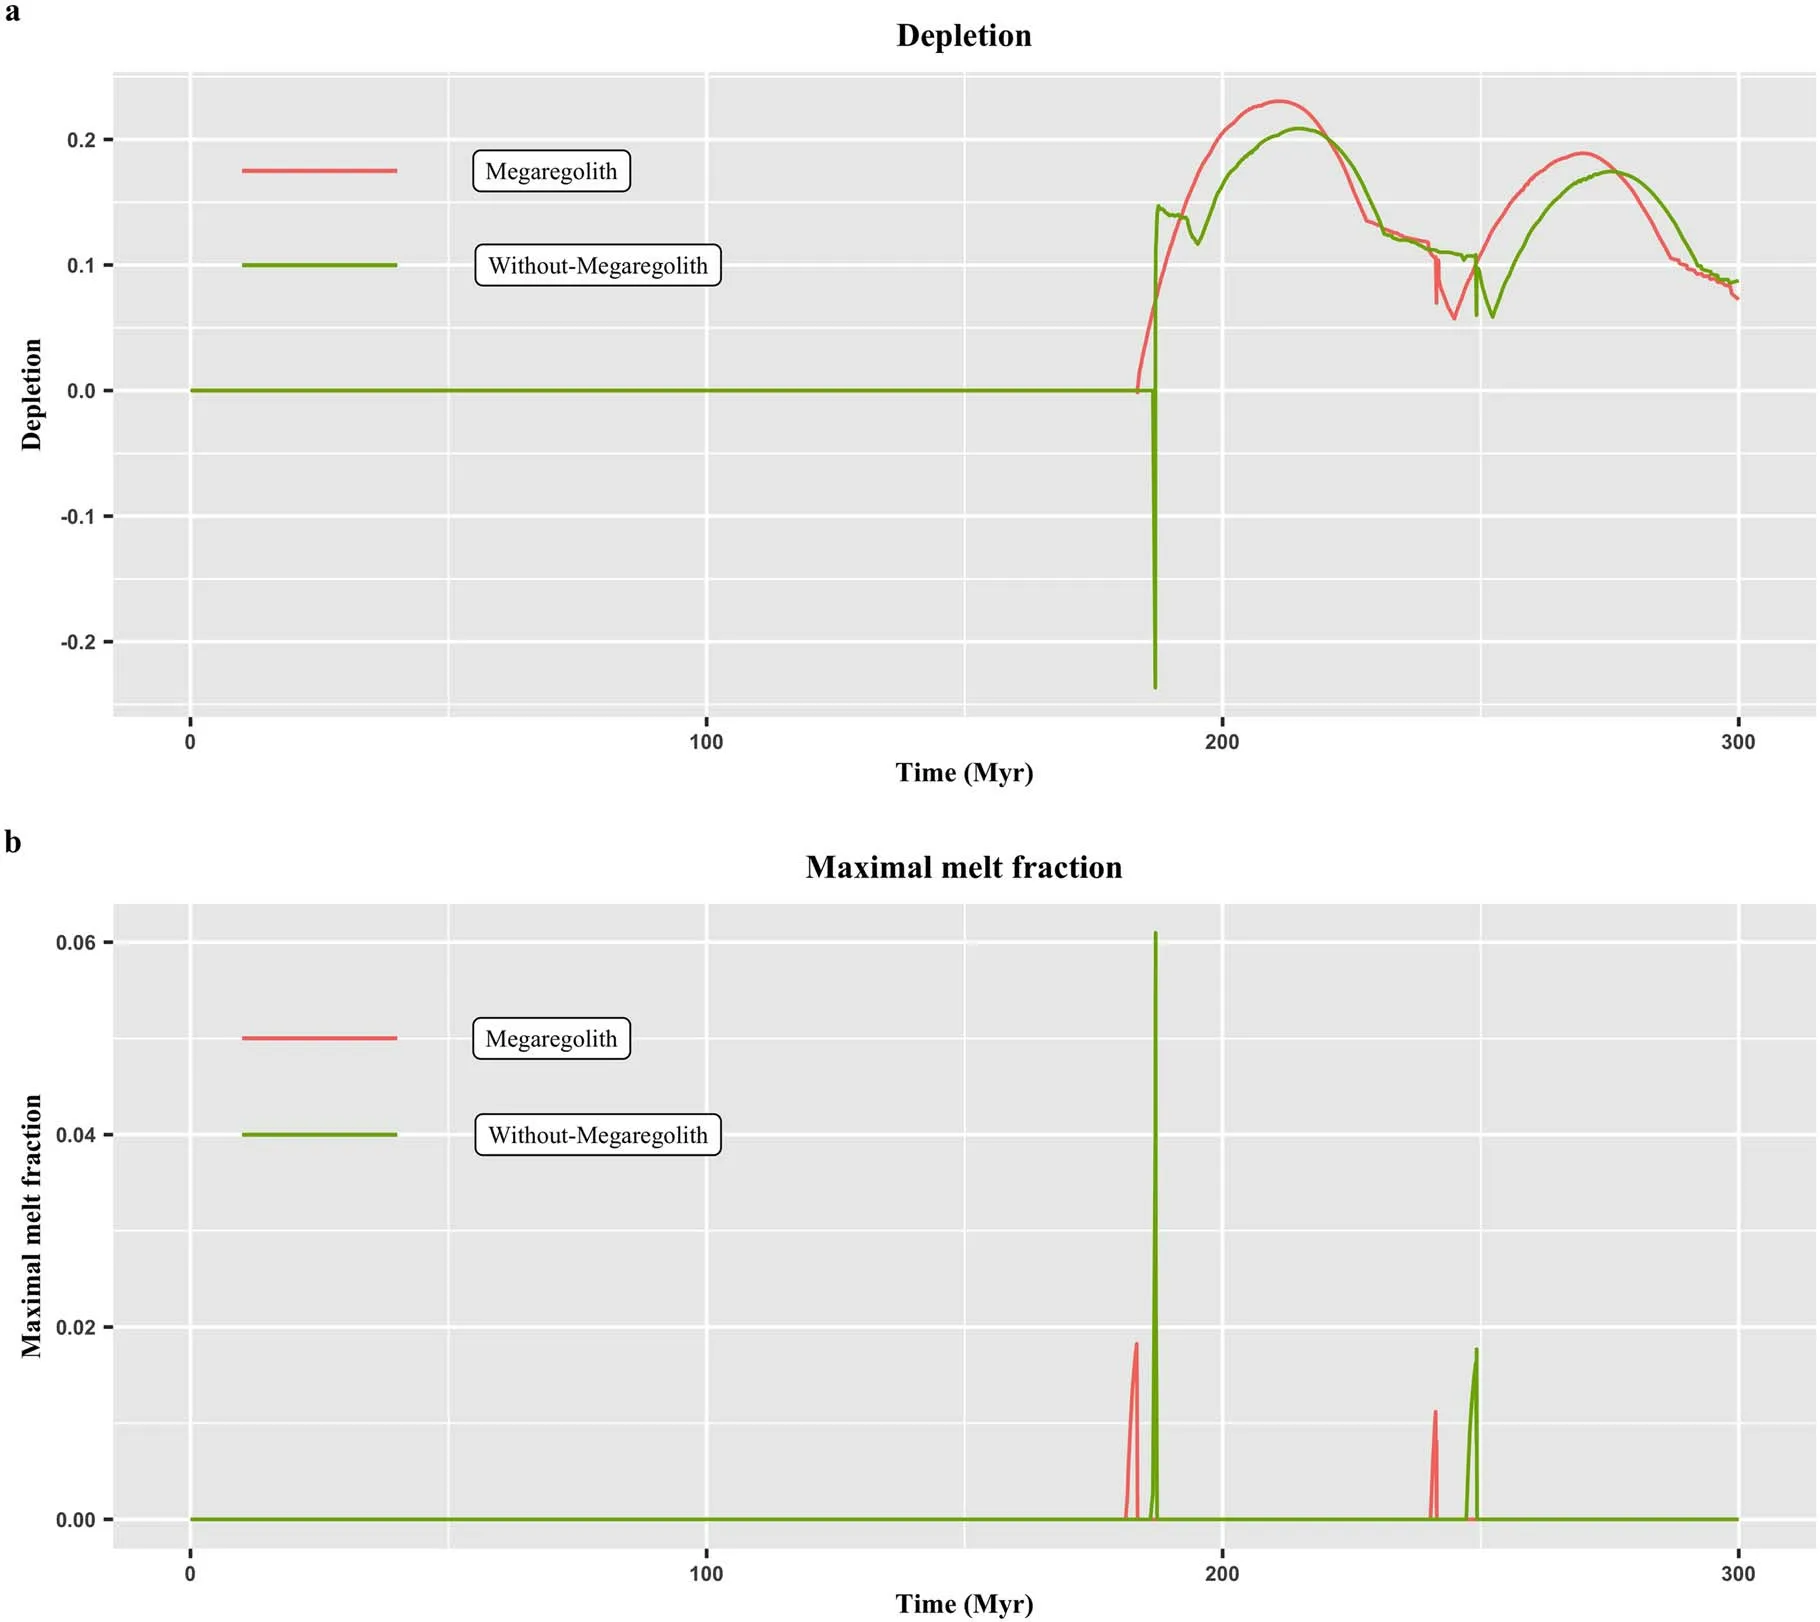
Figure 5.Key features of 2D simulation.The labels Megaregolith and Without-Megaregolith correspond to the model with and without megaregolith,respectively.(a)The depletion.(b) The maximal melt fraction.
Overall,the existence of megaregolith helps produce more molten material near the top of the mantle,but due to its good thermal insulation property,it leads to less enriched materials.We speculate that the presence of megaregolith ensures the long-term existence of molten materials in the mantle.Given the fact that recent remnants of volcanic activities were found on Mercury (Thomas et al.2014;Thomas &Rothery 2019),megaregolith may be key to the long-term volcanic activities on Mercury.
One day he was walking down a broad road when he was stopped by a handsome man he had never seen before, who, little as Don Giovanni knew it, was the devil himself
4.Summary
In this work,we carry out a 1D global parametric thermal evolution model incorporating megaregolith to study the influence exerted by megaregolith on the silicate shell of the planet Mercury.Our results suggest that megaregolith can effectively affect the thermal evolution of Mercury’s silicate shell by virtue of its good insulation performance.The main way megaregolith exerts its impacts is to significantly prolong the process of partial melting that occurs in the early stage of the evolution and reduce the internal heat loss in the subsequent simulation.Specifically,the crust,as the closest layer to megaregolith,is the most directly affected.Owing to the longer partial melting process,more molten materials and RHPE are brought in,making the crust thicker and the temperature higher compared to the other deep parts of the silicate shell.On the one hand,the insulation effect of megaregolith makes the stagnant lid thinner and delays the termination of mantle convection.On the other hand,a lower temperature of the mantle successfully allows the inner core to form at an earlier time,and eventually results in a larger inner core.We further implement a simplified 2D mantle convection simulation with the help of the fully open source finite element code ASPECT.This simulation depicts a typical mantle plume fractional melting scenario.Although we adopt some simplified parameterizations and a much smaller simulation time,this simulation still captures the key features brought by megaregolith.We conclude that megaregolith can effectively help to produce more molten materials and to ensure the long-term existence of molten material in the mantle,which may be key to the long-term volcanic activities found on Mercury.
As far as megaregolith is concerned,the key factors that dominate the thermal structure of megaregolith are discussed.We mainly analyze the thermal conductivity and amount of internal radioactive heating sources.The results indicate that for such a highly fragmented structure,the thermal conductivity plays the key role.Specifically,both temperature and heat flux are more sensitive to the thermal conductivity,and a slight change in thermal conductivity can bring dozens of temperature changes and a larger fluctuation of heat flux.In addition,as its own internal heat production is small(e.g.,at present time),the heat flux is more dependent on the flux that flows into megaregolith.
Our thermodynamic simulations are highly dependent on the input parameters,and the choice of input parameters usually leads to a difference in calculations and even different conclusions.Although with the deepening of planetary studies,we can obtain some solid constraints on the thermodynamic models,but we still need to rely on a large number of assumptions to design and implement simulations.In addition,a series of controversies,including whether the FeS layer exists,continues to plague the study of Mercury (e.g.,Hauck et al.2013;Breuer et al.2015).Nevertheless,as a qualitative research,through the method of controlling variables,we think our conclusions are reliable.
Finally,our work emphasizes the importance of megaregolith to the evolution of Mercury.Intuitively,the presence of megaregolith has undisputed insulation effects on the interior of Mercury,but quantitative comparisons are lacking and meaningful.In the past,we paid more attention to its changes to the environment of the shallow depth in the outermost shell,but the influences on the formation of the inner core remind us that this effect can be global and profound,and it is worthy of further study.The interaction between megaregolith and the dynamic phenomena deep inside the planet will be more comprehensively understood along with the progress in areas like composition of the planetary core.For megaregolith itself,as one of the results of impact events,its thickness,composition,coverage area and the exchange of energy and matters during the impact may affect its role in the evolution processes.We hope that the new Mercury detection mission BepiColombo can reveal the mysteries for us in the near future(Benkhoff et al.2010;Milillo et al.2020).
5.Supporting Information
Additional Supporting Information can be found through the following link:https://github.com/XieJChris/Megaregolith-Mercury.git.
Acknowledgments
This work is supported by the National Natural Science Foundation of China (Grant Nos.11973072 and 11773058).We thank the Computational Infrastructure for Geodynamics(geodynamics.org) which is funded by the National Science Foundation under awards EAR-0949446 and EAR-1550901 for supporting the development of ASPECT.
Appendix ACrustal Thickening and Mantle Configuration
As we mentioned above,the key to crustal evolution is the partial melting in the mantle.Following previous studies(Morschhauser et al.2010;Grott et al.2011),a peridotite dominant mantle is assumed,therefore,the solidus and liquidus can be expressed as

where Tsoland Tliqare the solidus and liquidus of peridotite,respectively,and P is the pressure in GPa.
Taking into account the change in the solidus of the mantle caused by the depletion of peridotite,the solidus of the mantle is expressed as follows (Knibbe &van Westrenen 2018)

where Tsol,mis the mantle’s solidus and Dcris the crustal thickness.ΔT is the temperature difference that represents the temperature change of the solidus due to the depletion of peridotite.Drefis the reference thickness,defined as(Morschhauser et al.2010)

where Γ is the crustal formation rate (usually assumed to be 0.2).
Once the ambient temperature exceeds the mantle’s solidus,partial melting occurs and the volume of the melting zone is denoted by Vpm,withHereR(R)
12is the radius of the lower(upper)boundary where melting is allowed in the mantle.Also,the volumetrically averaged degree of melting mamis obtained by solving

Finally,the thickness of the crust versus time is calculated through

where u0is the mantle convective velocity scale,β equals to 1/is the(critical)Rayleigh number of the mantle.Following Thiriet et al.(2019),we apply the Arrhenius viscosity law to the mantle,with

where η0is the reference viscosity,A is the activation energy,R is the universal gas constant and Trefis the reference temperature,so that Ra can be represented as

with ΔT=Tm+Tc?Tl?Tb,ΔR=Rl?Rcand κmis the mantle thermal diffusivity.As for Tland Tb,they are

where Θ is an empirically determined parameter and Dconvis the thickness of the convecting mantle,which is between Rmand Rb.
Appendix B Core Configuration
Here,we refer to Labrosse et al.(2001)and Zhang&O’Neill(2016)to solve the equation of state of the core.A length scale for the compression and an adiabatic height are defined first
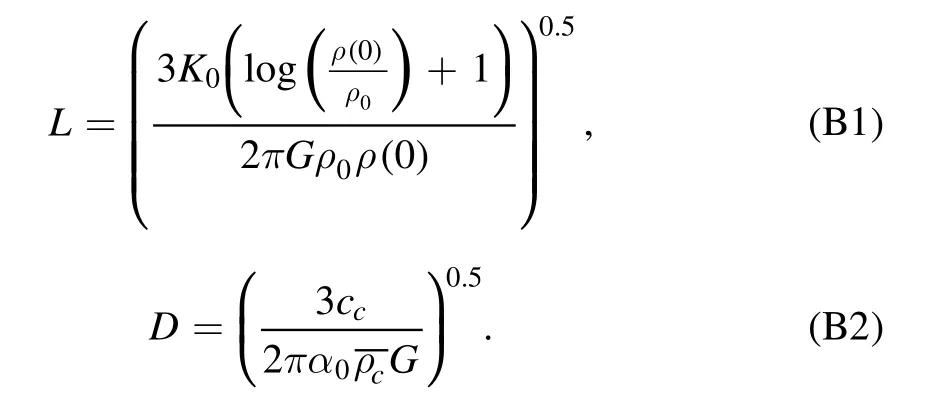
Then,we have the profile of the density and the gravitational acceleration in the core as

Further,the pressure profile in the core is obtained as follows

The symbols involved are explained in previous sections.
Appendix C Melting Parameterization in 2D Model
In the 2D mantle convection model,we generally follow the same melting parameterization used in our 1D model(Equations (A1)–(A3)),except Equation (A3) is replaced by

where C is the depletion or the partial melting rate,and ΔTpmis the solidus change when partial melting reaches 100%,which has a negative value.
The melting rate is computed as the difference between the equilibrium melt fraction and the melt present in the model,with the equilibrium melt fraction

Refer to Dannberg &Heister (2016) for more details.
ORCID iDs
 Research in Astronomy and Astrophysics2022年3期
- Research in Astronomy and Astrophysics的其它文章
- Estimation of HII Bubble Size Distribution from 21cm Power Spectrum with Artificial Neural Networks
- Common Envelope to Explosion Delay time Distribution (CEEDTD) of Type Ia Supernovae
- V0644 Ser:An Active Ultrashort Period Contact Binary Star
- Hypercritical Accretion for Black Hole High Spin in Cygnus X-1
- Physical Properties of 29 sdB+dM Eclipsing Binaries in Zwicky Transient Facility
- New Massive Contact Twin Binary in a Radio-quiet HII Region Associated with the M17 Complex
