Tunable enhanced spatial shifts of reflective beam on the surface of a twisted bilayer of hBN
Yu-Bo Li(李宇博), Hao-Yuan Song(宋浩元), Yu-Qi Zhang(張玉琦), Xiang-Guang Wang(王相光),Shu-Fang Fu(付淑芳), and Xuan-Zhang Wang(王選章)
Key Laboratory for Photonic and Electronic Bandgap Materials,Ministry of Education,and School of Physics and Electronic Engineering,Harbin Normal University,Harbin 150025,China
Keywords: Goos–H¨anchen shift,Imbert–Fedorov shift,hBN,reststrahlen band
1. Introduction
When total internal reflection occurs,the reflection point is not the same as the incident point, which was first proven by Goos and H¨anchen in 1947.[1]The displacement is in the incident plane and known as the Goos–H¨anchen (GH) shift.This was explained as an experience of phase change for the reflected wave vector,[2]closely related to the interface impedance or dispersion properties. Another shift perpendicular to the incident plane is named as the Imbert–Fedorov(IF)shift,[3]which exists upon a circularly or elliptically polarized incident beam on the surface of isotropic media. The IF shift results from the interaction of the optical orbit and spin, which is one of the spin-Hall effects of light. The GH and IF shifts have been confirmed in experiments and also investigated widely in different physical systems, such as photonic crystals,[4]negative refractive media,[5]lossless dielectric slabs,[6]and others. Normally, the optical loss can be ignored for the interface between two ordinary transparent materials as well as metamaterials. In particular,the optical loss of the artificial structure obviously affects the spatial shifts,which is attributed to the optical scattering from internal defects in the material. In general, the GH shift, as well as the IF shift, is extremely weak and is not easily detected by traditional optical measurements. Therefore,a method known as the weak measurement has been established in experiments to amplify spatial shifts significantly.[8]
Many efforts have been made to enhance and tune GH and IF shifts, for instance, using various fascinating structures,i.e.,left-handed metamaterials,[9]metasurfaces,[10]and anisotropic metamaterials.[11]In particular, some twodimensional (2D) materials have been applied to investigate the spatial shifts of light, such as graphene and black phosphorus.[12,13]The chemical potential of graphene can be tuned by the gate voltage and then the adjustable and enhanced GH and IF shifts can be expected due to the coating of graphene on the surface of materials. For example, Liet al. experimentally measured the GH shift on the surface of a glass prism coating the graphene layer by using the beam splitter scanning method.[14]They observed a maximum difference of 31.16 μm in the GH shift between TM and TE incidences in graphene. Songet al.predicted large spatial shifts of the reflective beam near the critical angle and the Brewster angle on the surface of graphene/hBN metamaterial,and the reflectivity can be even more than 80%.[15]Another way to enhance the spatial shifts is to reduce the effect of optical loss. Polar crystals with lower optical loss resulting from the lattice vibration attract more attention. Most polar crystals are ionic crystals,and their reststrahlen band(RB)is different. Hexagonal boron nitride(hBN),an interesting van der Waals(vdW)crystal, is a kind of natural hyperbolic materials, which has two separate RBs. In the two RBs, the principal values of its permittivity are opposite in sign so that propagating modes are of hyperbolic dispersion. When a beam just falls in the RBs,the reflection nearly reaches the total reflection. Surface phonon polaritons(SPhPs)in ionic crystals originate from the coupling of optical phonons with electromagnetic fields. It has been proven that SPhPs in the hBN exhibit high confinement and much lower optical loss than surface plasmon polaritons(SPPs).[16]Thus,large spatial shifts with high reflectivity may be realized in or near the two RBs. Wanget al.studied the spatial shifts of the reflective beam at the critical or Brewster angle on the surface of hBN.[17]They found that the large GH shifts for s- and p-waves at the critical angle were about-5.32λ0and-3.71λ0,respectively,accompanied by high reflective ratiosRs=0.51 andRp=0.58.However,although the GH shift is massive at the Brewster angle,it is always accompanied by a very small reflective ratio,such asRp≈10-4. In most investigations,the optical axis(OA)is vertical or parallel to the surface, while the effect of the OA on spatial shifts has seldom been considered. In Ref.[18],a twisted structure,
where the optical axes of the two hBN slabs are different in orientation,was introduced to explore the combined effects of polarization conversion and selective transmission for realizing chirality. The simulation results showed that polarization conversion in the top slab of the bilayer structure was sensitive to the tilting angle of the slab’s OA. Wanget al.studied the influence of the orientation of OA on the GH shift of lefthanded materials.[9]Wuet al.investigated the GH shift at the surface of the titled uniaxial crystal and noted that the permittivity expressed by the tilted angle has a remarkable effect on the shift.[19]In our recent works, the impact of the OA of hBN on the GH and IF shifts,[17]the reflection,[20]and the spin angular-momentum[21]also were further explored. Based on these discussions,it can be seen that an anisotropic dielectric permittivity can lead to complex dispersion properties because of the polarization feature of electromagnetic waves. Adjusting the spatial shifts of reflective beams by means of changing the OA orientation is promising since the change is vital to some optical devices, such as sensors and switches. In this paper, the simple bilayer structure composed of two twisted hBN slabs is considered where there is a twist angle between the two optical axes of the slabs. The twist angle effect on the two spatial shifts of the reflective beam will be investigated.Since the total reflection occurs in the RBs, we will mainly focus on the spatial shifts in these frequency bands. Then, a large spatial shift with high reflectivity may be further selected by tuning the tilted angles.
The paper is organized as follows. Section 2 shows the structure of double hBN slabs with the different OA.With the transfer method, the reflective coefficients are derived for sand p-wave incidences,and further,the corresponding expressions of the GH and IF shifts are presented. Numerical results and discussions are in Section 3. Finally, Section 4 summarizes the entire paper.
2. Theoretical model
The structure and geometry are depicted in Fig. 1(a),where two hBN slabs with different anisotropic axes are stacked together. The optical axes of the top and bottom slabs in thex–zplane are tilted off thex-axis by anglesα1andα2,respectively.d1andd2represent the thicknesses of the two layers. The permittivity of hBN slabs can be expressed by

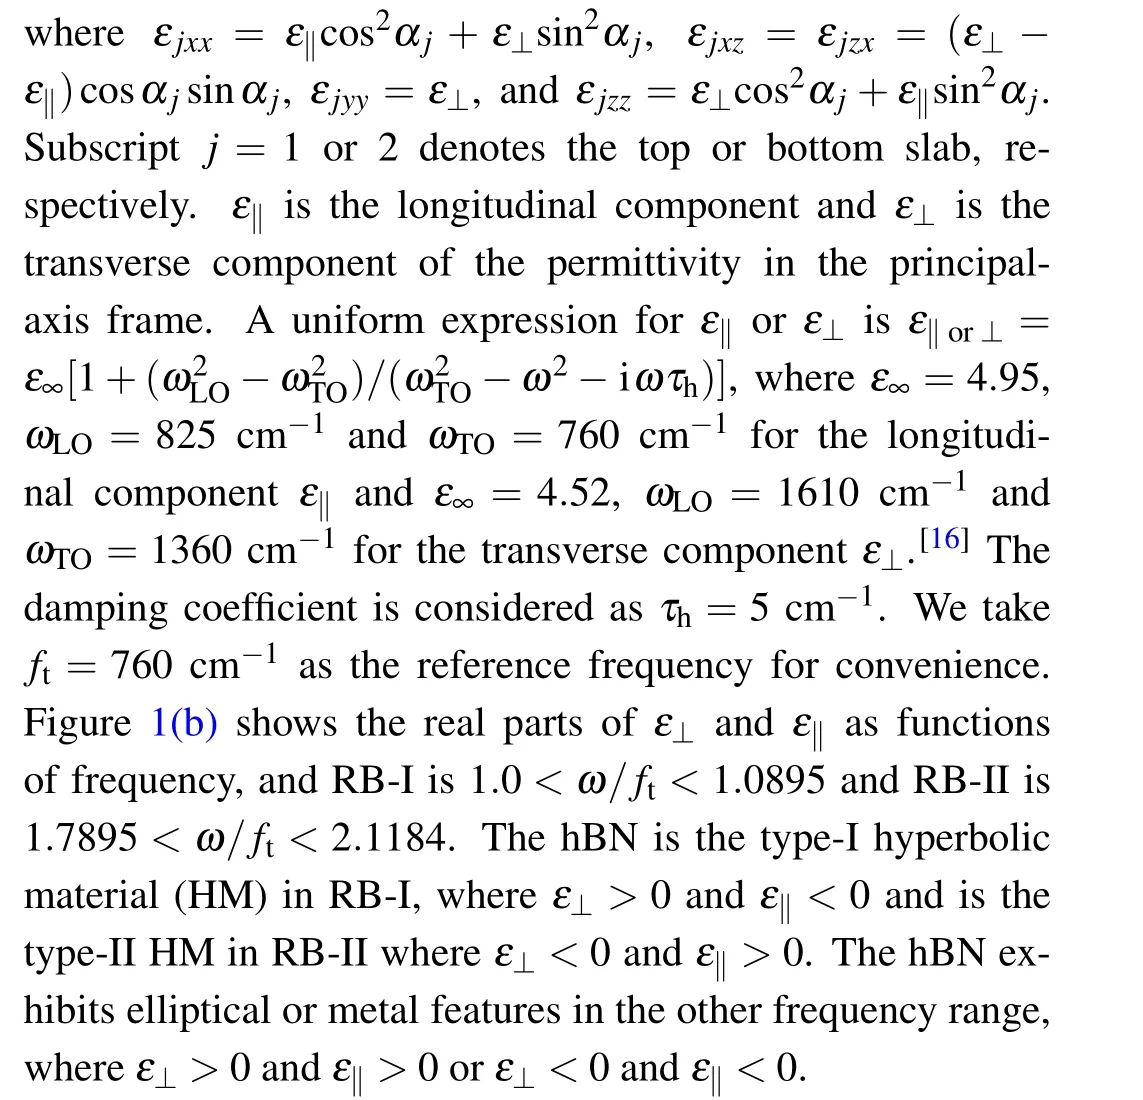
We consider a transverse-magnetic(TM)wave as the incident wave and thex–zplane as the incident plane since for a transverse-electric(TE)incident wave the crystal behaves like an isotropic medium due to the permittivityε⊥independent of the tilted angle.[19]In addition,contrasted with the TM incidence, the GH shift produced by the TE incidence is very small. We assume the wave vector in the two slabs to beKj=(kx,0,k±jz), and then the magnetic field in them can be expressed as
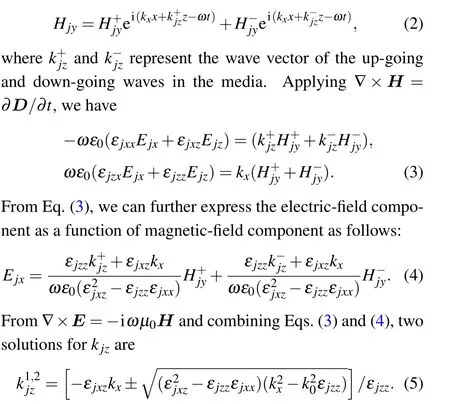
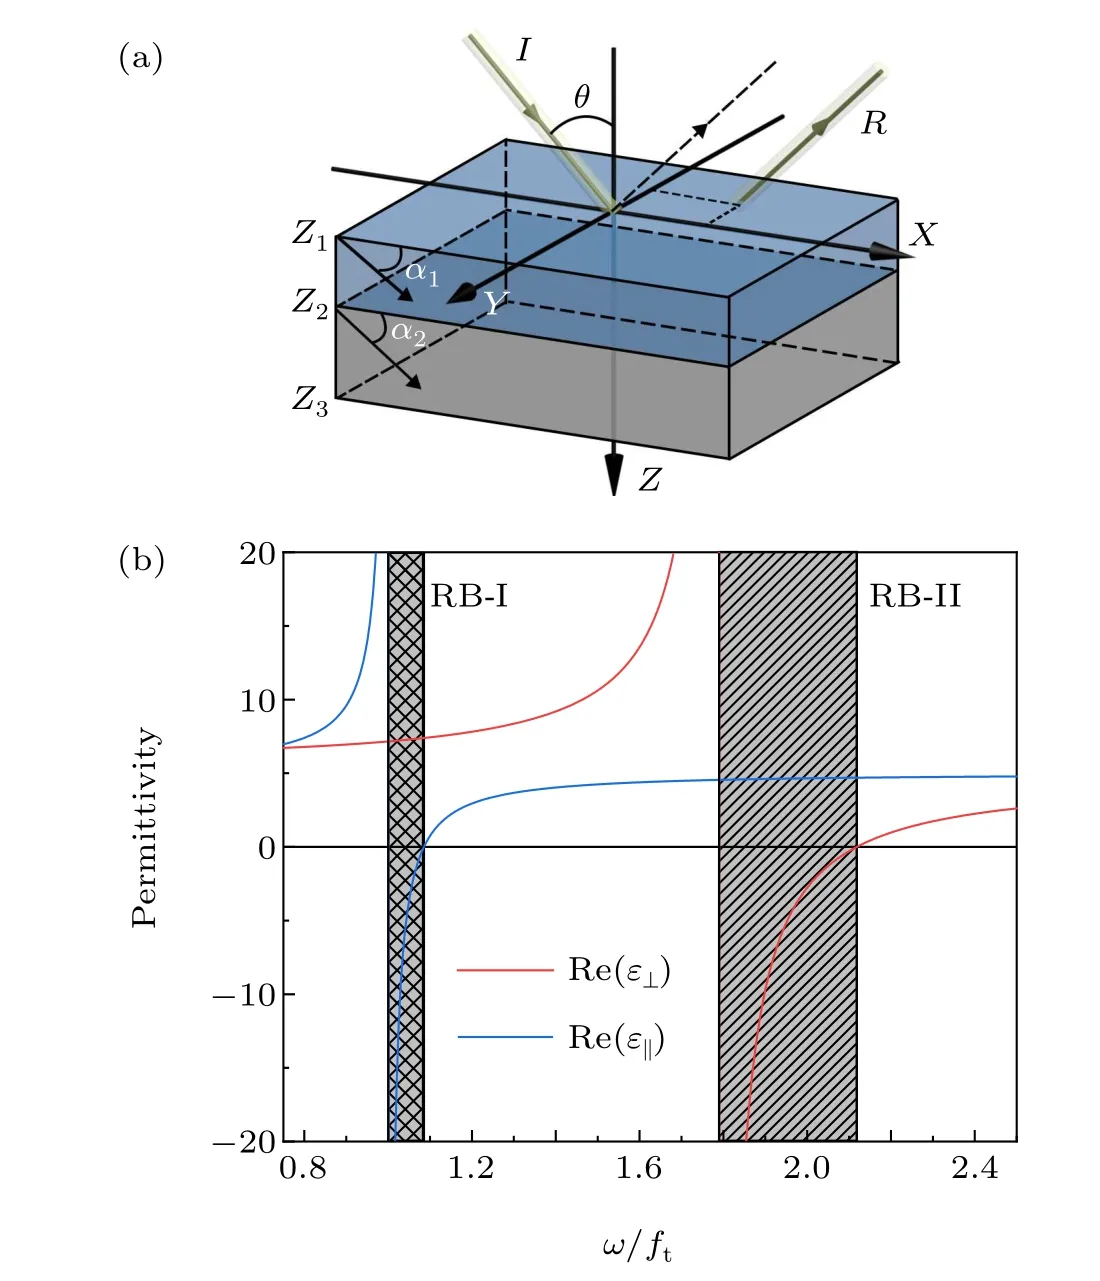
Fig.1. (a)Schematic of twisted hBN slab structure,where the two OAs both are in the x–z plane and tilted off the x-axis by an angle α1 for the top slab and α2 for the bottom slab, while d1 and d2 represent the thicknesses of the top and bottom slabs,respectively. The incident beam with index I is at an angle θ to the z-axis. The dashed line represents the reflective beam in geometry optics, while the line with index R shows the real reflective beam. (b) The real parts of the two components of the primary permittivity as functions of the frequency. The two shadows indicate the two RBs.


by means of the stationary phase method,whereλ0is the vacuum wavelength. Obviously, the GH shift can reach its peak when the phase differenceφpexperiences a sharp variation with the incident angle. Therefore, the massive GH shift can be observed near the Brewster angle or the critical angle.
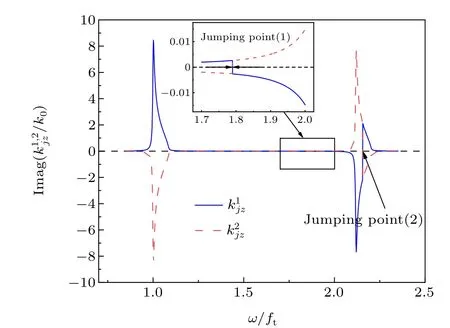
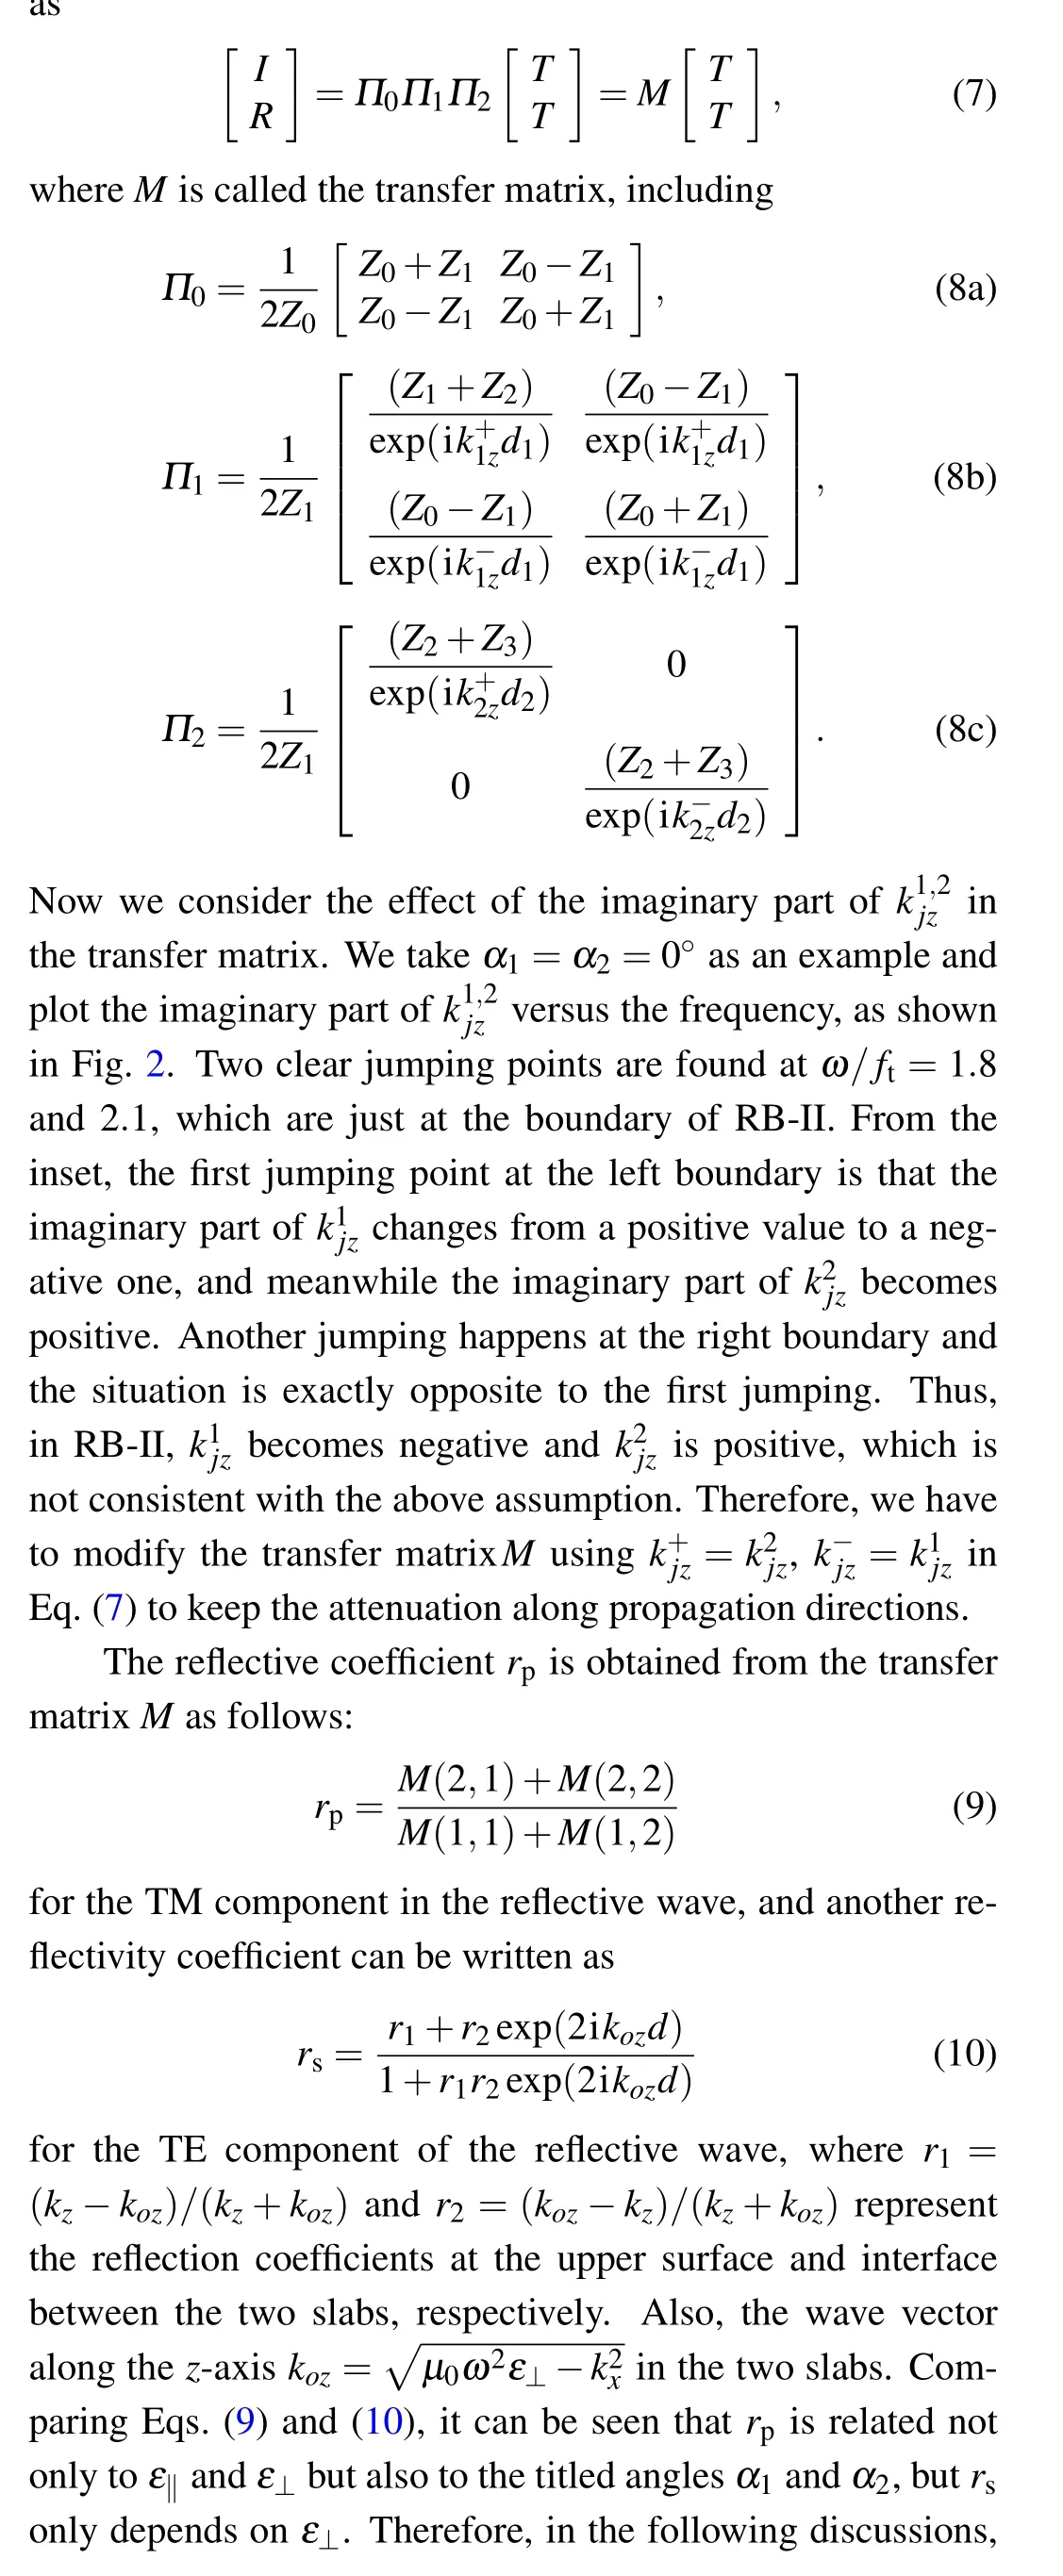
Fig.2.Imaginary part of(j=1,2)of the mode wave versus frequency at α1=α2=0°. The inset shows the first jumping point at ω/ft=1.8,where the imaginary part ofbecomes negative and becomes positive. The second jumping point happens at ω/ft =2.1,where the signs of and are swapped.
3. Results and discussion
3.1. GH shift of the reflective beam
We take the thicknesses of the top and bottom slabs as 1.5 μm and 2.5 μm,respectively. Unlike the hyperbolic metamaterials, hBN is a nature hyperbolic material, so the spatial shifts can be further enhanced only by promoting the quality of the hBN crystal.We will investigate the large GH shift accompanied with the high reflectivity in the RBs. The incident angle is fixed atθ=85°in subsequent discussions since the large GH shift may be achieved at large incident angles,as indicated by Eq.(11). The effect of the OA orientations on the GH shift in the RBs also will be discussed,where the titled angle of the top OA is taken asα1=0°, 30°, and 90°, respectively. Forα1=0°, the GH shift distribution as a function of frequency and tilted angleα2in RB-I is presented in Fig.3(a). It can be found that the positive maximum is about 38λ0, localized at the left boundary of RB-I and in the range ofα2>30°,while the negative maximum is about-5λ0, appearing at the right boundary and the range ofα2>80°.Two obvious intersecting strips with relatively high GH shift values are observed. Contrasting with the reflectivity shown in Fig.3(b),unfortunately in these regions the reflectivity becomes very small. Near the maximum GH shift value, an impressive GH shift with about 30%reflectivity can be acquired,which is not bounded by the tilted angleα2. The GH shift reduces evidently as the frequency is increased,but reflectivity is enhanced,by more than 70%in some regions. For example,R ≈75%and Δx ≈15λ0forω/ft=1.02 andα2=20°. Thus, the purpose to directly heighten the reflective ratio by means of slightly sacrificing the shift value can be realized. Forα1=30°,the vertical strip with a larger GH shift moves to the middle of the frequency window,as shown in Fig.3(c). Moreover,the GH shift is enhanced significantly. Contrasted with Fig. 3(d), the GH shift in the frequency range ofω/ft>1.02 should be paid more attention since the reflectivity is more than 60%except for the strip zone. Of course,the negative GH shift is expected in the region ofω/ft<1.01 andα2>30°. Forα1=90°,the maximum of the GH shift quickly drops to about 19λ0,lower than the other two cases,as shown in Fig.3(e). However,it is interesting that the reflectivity shown in Fig.3(f)is evaluated to be more than 30%in the whole region. In this case,we can arbitrarily choose the GH shift value according to the requirement without the consideration of reflectivity.
Now we focus on the GH shift and reflectivity in RB-II,as presented in Fig. 4. The large GH shift near the strip attracts our attention due to nearly 100%reflectivity in a certain region atα1=0°. For example,Δx ≈10λ0withR ≈0.96 forω/ft=1.8 andα2=85°. The situation ofα1=30°is a little complicated due to the intersection of two strips. Although a massive GH shift over 100 times the vacuum wavelength is observed at a narrow frequency band, the corresponding reflectivity is very low,almost close to zero. In the other region,to obtain the large GH shift with high reflectivity is also difficult.An interesting phenomenon should be noted whenα2=90°.Comparing Figs. 4(e) and 4(f), a GH shift accompanied with high reflectivity is obtained in a wide frequency range. For instance,the GH shift about 20λ0with 70%reflectivity is easily achieved.
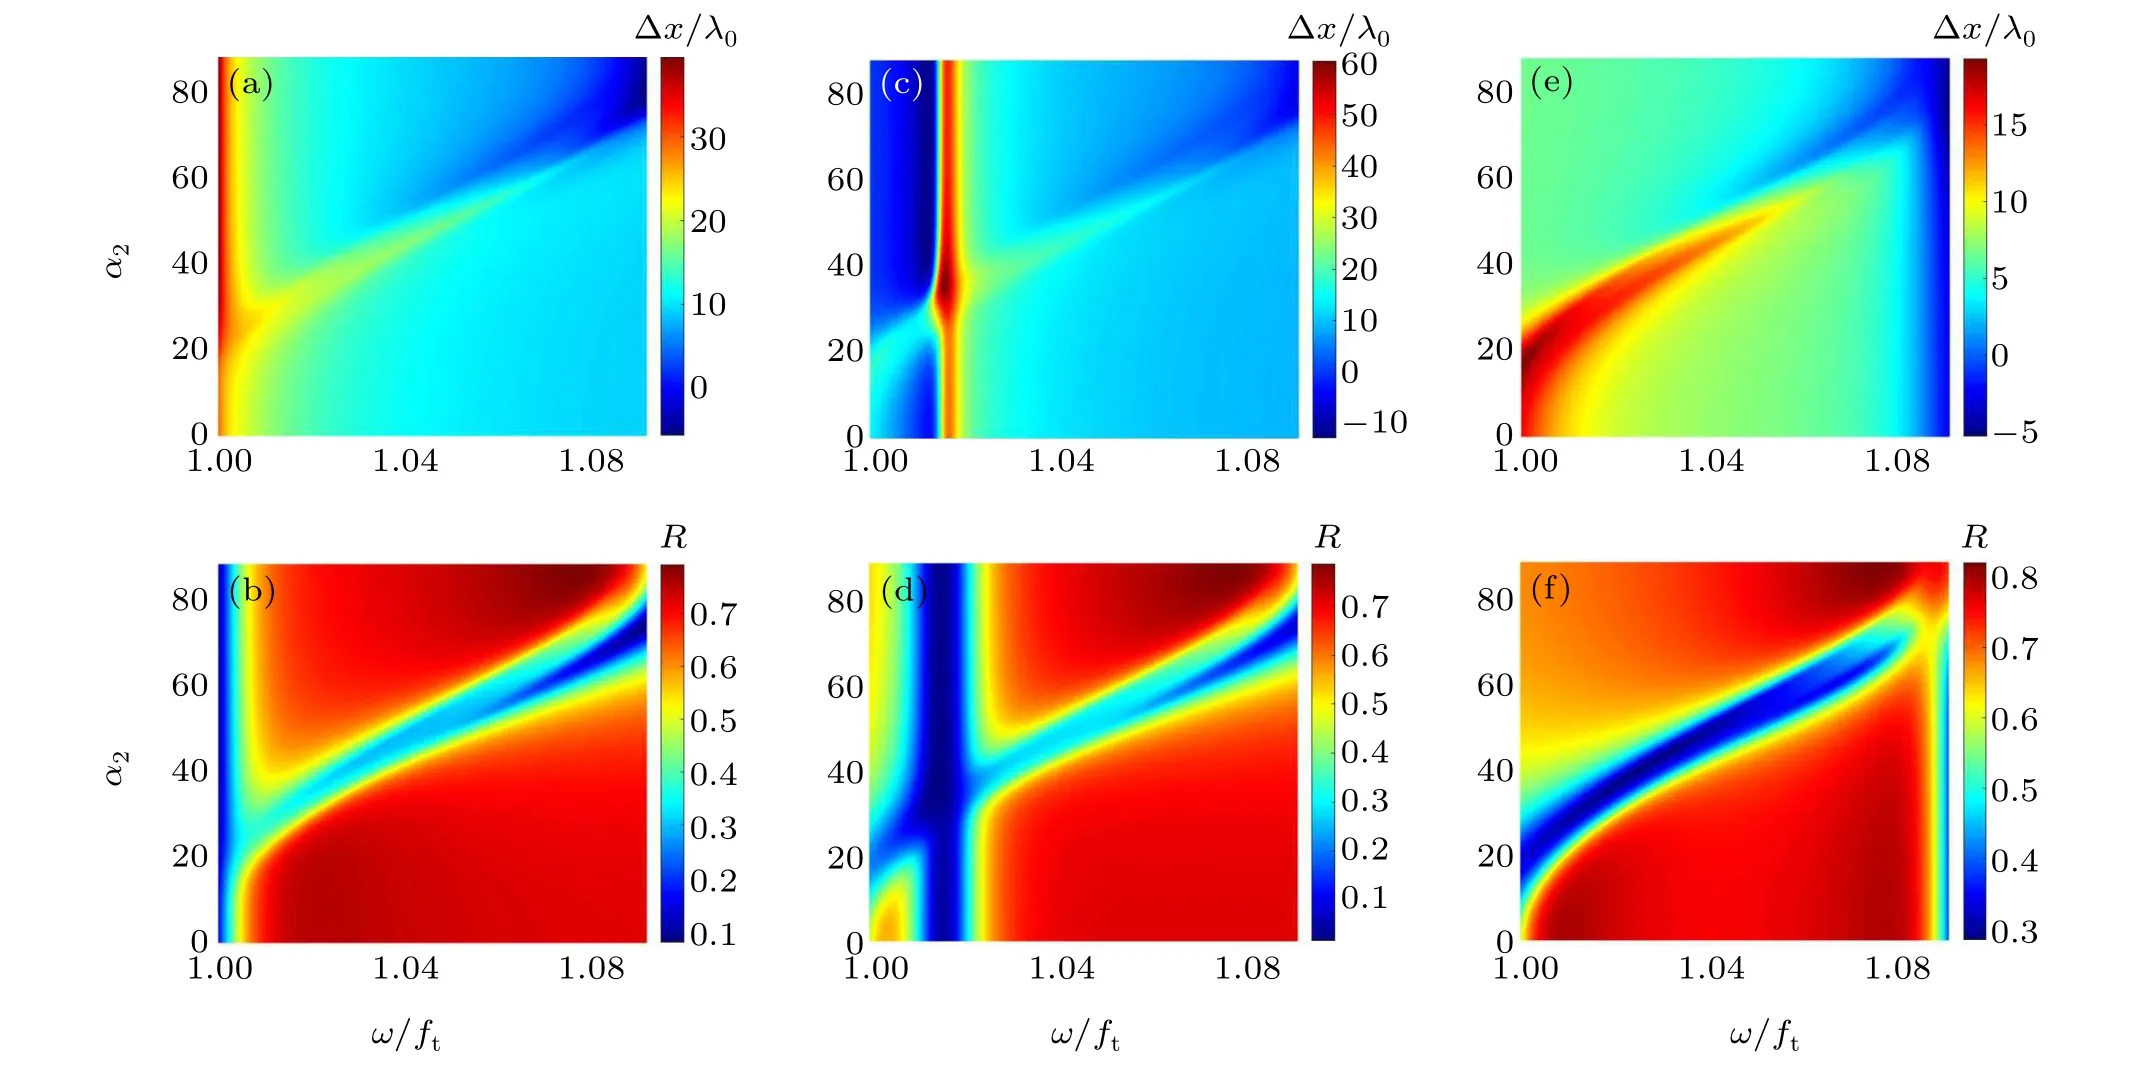
Fig.3. GH shift and reflectivity versus frequency and bottom titled angle α2 in RB-I:(a)and(b)for α1=0°,(c)and(d)for 30° and(e)and(f)for 90°.
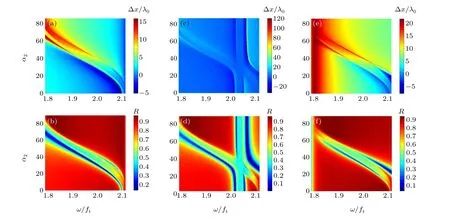
Fig.4. GH shift and reflectivity versus frequency and bottom titled angle α2 in RB-II:(a)and(b)for α1=0°,(c)and(d)for 30°and(e)and(f)for 90°.
In order to further indicate the effect ofα1andα2on the GH shift,the GH shift and reflectivity spectra atω/ft=1.05,1.08 in RB-I are depicted in Fig. 5. An obvious intersection of the two strips is discovered and divides the frequency window into four parts. Among them,the region ofα1<52°andα2<52°attracts attention, where the GH shift is about 10λ0and the reflectivity is over 50%. It is worth noting that this region is expanded as the frequency increases toω/ft=1.08,as shown in Figs.5(c)and 5(d). Figures 3–5 show two distinct intersecting strips in which the GH shift is large but the reflectivity is very small. Based on the discussion for the derivation of the phase difference with the incident angle in Eq.(11),the incident angles related to these regions should be near Brewster angles,where the reflectivity is almost zero. If we further examine the wave vector of either hBN slab (see Eq. (5)), it can be found that the two absorption strips in the reflective spectra will be mainly determined by the twist angle of the OA orientation of the two slabs.
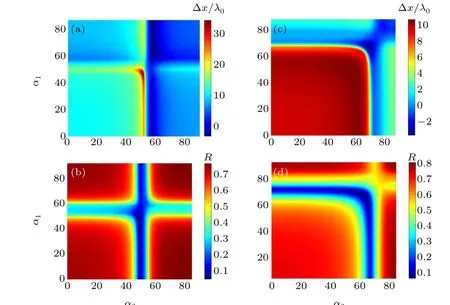
Fig.5. GH shift and reflectivity versus titled angles α1 and α2: (a)and(b)at ω/ft=1.05,and(c)and(d)at ω/ft=1.08.
3.2. IF shift of the reflective beam
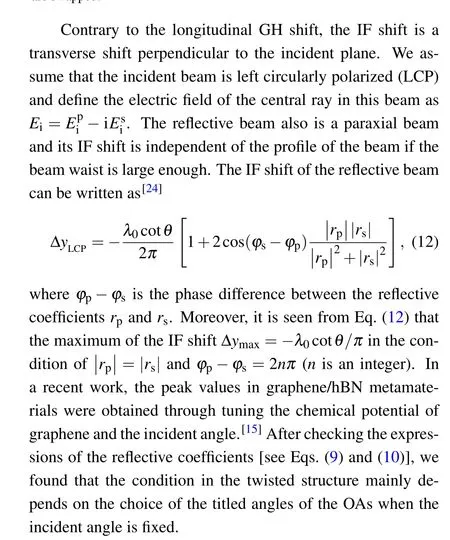
In this part, the distribution of the IF shift versus the titled angles and the frequency is indicated in Fig. 6. The incident angle is fixed atθ=10°in the following numerical calculation. Due to Eq. (12), the maximum of the IF shift,Δymax=-λ0cotθ/π,is about-1.8λ0in the conditions mentioned above. Firstly, we consider the changes of the IF shift versusα2whenα1=0°,60°,and 90°,as shown in Figs.6(a)–6(c). Forα1=0°, the maximum of the IF shift is found in RB-II and the region with the maximum gradually shrinks and moves to the lower frequency region with an increase ofα1.Whenα1=60°, the relatively larger values appear not only in RB-II but also in RB-I.However,the frequency bands with large IF shifts are very narrow.We further twist the upper hBN plate to 90°.It is found that the maximum of the IF shift in RBII completely transfers into RB-I,and is slightly smaller than the other two cases. This implies that the conditions obtaining the maximum cannot be matched in RB-I.Secondly,the titled angle of the bottom hBN is fixed atα2=0°, 30°, and 90°,as shown in Figs. 6(d)–6(f). Unlike the first case, the region with the large IF shift is found in RB-I and gradually moves to RB-II.As shown in Fig.6(e),the IF shift in RB-I is smaller than that in RB-II. Asα2is increased to 90°,the blue region with the maximum of IF shift moves into RB-II entirely.Comparing the two cases, it can be easier to get the maximum of the IF shift at the second case. When carefully checking the changes of the IF shift withα1andα2, we find that the twist angle of the OA orientation between the two hBN slabs plays an important role.
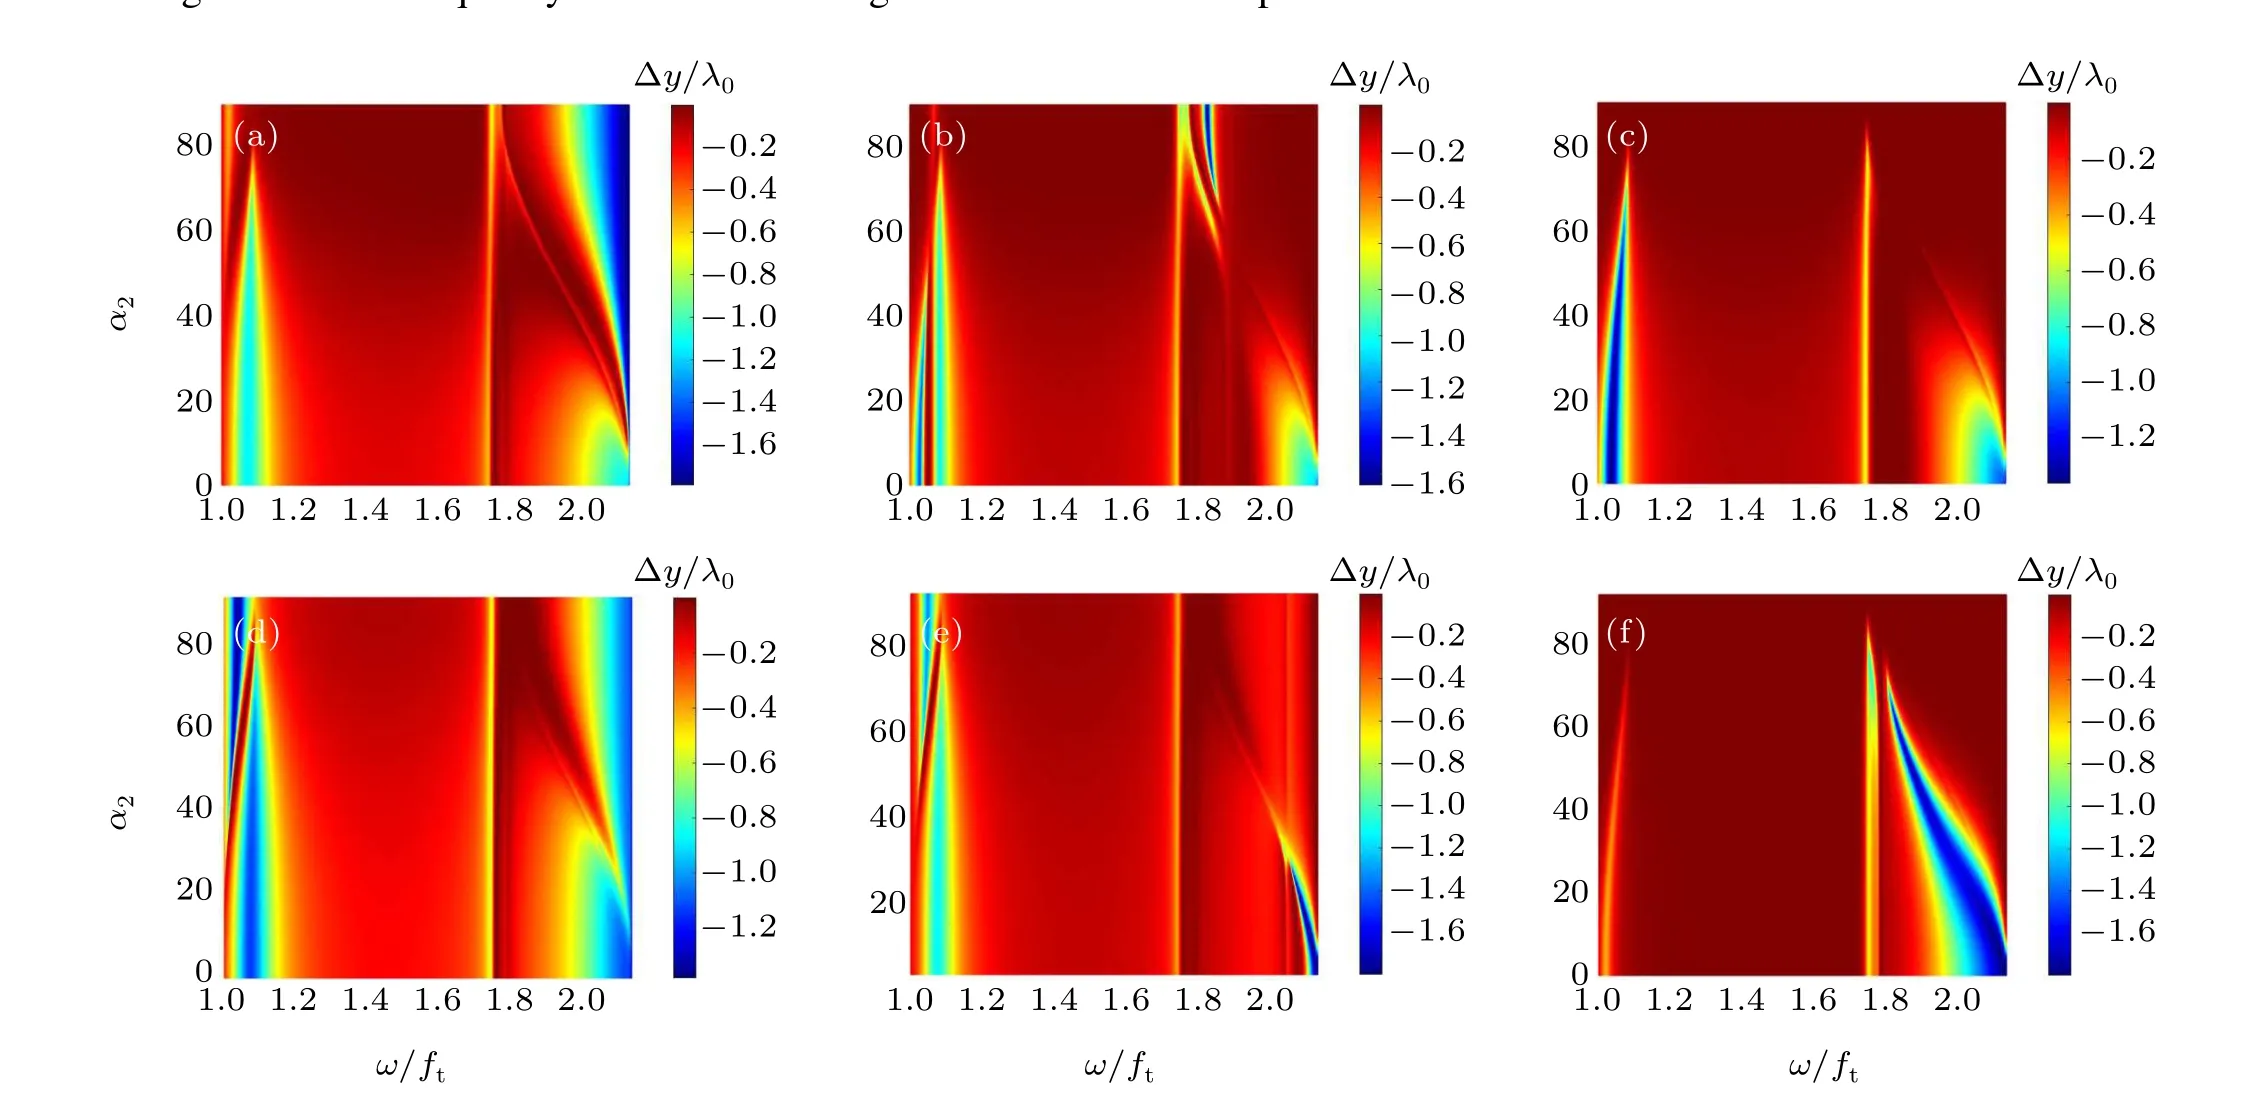
Fig.6. IF shift in RBs versus frequency and tilted angles: (a)–(c)show IF shift at α1=0°,60°,90°;(d)–(e)show IF shift at α2=0°,30°,90°.


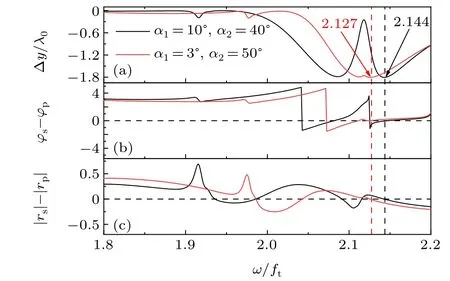
Fig.7. (a)IF shift, the difference of(b)phase or(c)reflectivity between pand s-waves versus frequency under the condition of α1 =3° and α2 =50°or α1=10° and α2=40°.
3.3. Beam simulations for GH and IF shifts of reflected Gaussian beam
From the above analysis and considering a paraxial incident beam,an assumption is necessary,which is that the phase of the reflectivity coefficient is a linear function of the in-plane wave vector in the cross section of the incident beam. In reality, the incident Gaussian beam should be with a finite waist.Therefore, a comparison is made between the results using the beam simulation and the ones obtained with the stationary phase method. The Gaussian incident beam with the waist widthW0and TM-polarization considered here is expressed by
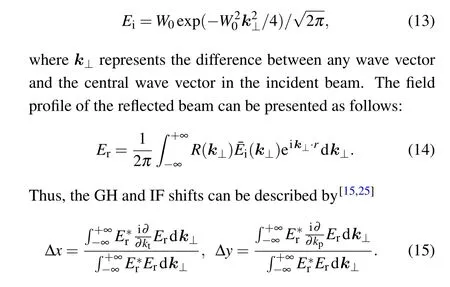
Here,ktandkpspecify the in-plane and out-of-plane deflection of non-central wave andErrepresents the electric field of the reflected beam.
Figure 8(a)represents the GH shift versus the titled angleα1for the differentα2in RB-I atω/ft≈1.05 andθ=85°.The maximal values are about Δx ≈32λ0atα1=50.27°andα2=50°and Δx ≈18λ0atα1=51.89°andα2=90°, respectively. Figure 8(b)simulates the GH shift versus the waist of the incident beam at the conditions for obtaining the maximal shift values shown in Fig.8(a). It is evident that the GH shift will be steady after the waist width relative to the vacuum wavelength is larger than a certain value,which just coincides with the results in Fig.8(a)from the stationary phase method.In Fig. 9(a), the IF shift as a function ofα1is presented atω/ft=2.08,α2=40°andθ=10°. Two points,α1=12.79°and 18.96°,are chosen in Fig.9(a),and the curves of IF shift versus the waist at the two points are depicted in Fig. 9(b).Compared with Fig. 9(a), the IF shift obtaining from the two ways also agrees well if the beam waist is large enough.
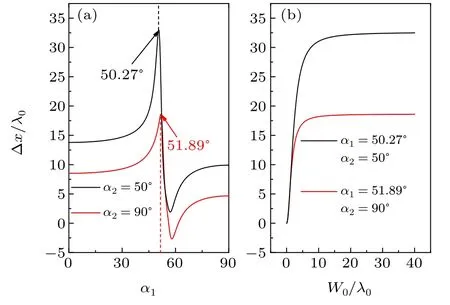
Fig.8. Comparison of the GH shift between the stationary phase method and the beam simulation at ω/ft =1.05 and θ =85°. GH shift versus(a)α1 at α2=50° and 90° and(b)W0/λ0 at α1=50.27° and α2=50° for the black curve and α1=51.89° and α2=90° for the red curve.
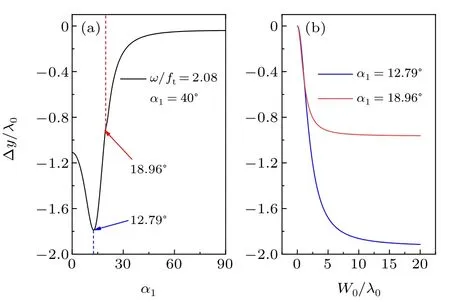
Fig.9. Comparison of IF shift between the stationary phase method and the beam simulation at ω/ft =2.08, α2 =40° and θ =10°. (a)IF shift versus α1. (b)IF shift versus W0/λ0 at α1=12.79° and 18.96°.
4. Conclusion
We took advantage of a planar bilayer structure composed of two twisted hBN slabs to realize the large spatial shifts with high reflectivity. The GH and IF shifts of the reflective beam on the surface were numerically calculated as functions of the OA orientations in the two hBN slabs. Interesting phenomena
Acknowledgments
Project supported by the Natural Science Foundation of Heilongjiang Province, China (Grant No. LH2020A014),Harbin Normal University Fund(Grant No.HSDSSCX2021-27), and Education Commission of Heilongjiang Province,China(Grant No.2020-KYYWF352).
- Chinese Physics B的其它文章
- Ergodic stationary distribution of a stochastic rumor propagation model with general incidence function
- Most probable transition paths in eutrophicated lake ecosystem under Gaussian white noise and periodic force
- Local sum uncertainty relations for angular momentum operators of bipartite permutation symmetric systems
- Quantum algorithm for neighborhood preserving embedding
- Vortex chains induced by anisotropic spin–orbit coupling and magnetic field in spin-2 Bose–Einstein condensates
- Short-wave infrared continuous-variable quantum key distribution over satellite-to-submarine channels

