Conservation of the particle–hole symmetry in the pseudogap state in optimally-doped Bi2Sr2CuO6+δ superconductor
Hongtao Yan(閆宏濤) Qiang Gao(高強(qiáng)) Chunyao Song(宋春堯) Chaohui Yin(殷超輝)Yiwen Chen(陳逸雯) Fengfeng Zhang(張豐豐) Feng Yang(楊峰) Shenjin Zhang(張申金)Qinjun Peng(彭欽軍) Guodong Liu(劉國東) Lin Zhao(趙林)Zuyan Xu(許祖彥) and X.J.Zhou(周興江)
1National Laboratory for Superconductivity,Beijing National Laboratory for Condensed Matter Physics,Institute of Physics,Chinese Academy of Sciences,Beijing 100190,China
2University of Chinese Academy of Sciences,Beijing 100049,China
3Technical Institute of Physics and Chemistry,Chinese Academy of Sciences,Beijing 100190,China 4Songshan Lake Materials Laboratory,Dongguan 523808,China
5Beijing Academy of Quantum Information Sciences,Beijing 100193,China
Keywords: pseudogap,symmetry breaking,ARPES
High temperature cuprate superconductors exhibit a number of anomalous properties in the normal state. One prominent anomaly is the observation of the pseudogap that opens above the superconducting transition temperatureTcbut below the characteristic temperatureT?that is usually defined as a pseudogap temperature.[1–3]Revealing the nature of the pseudogap and its relation with superconductivity has been a central task in understanding the mechanism of high temperature superconductivity. It remains under debate whether the pseudogap is associated with the pre-formed pairing[4]or some competing orders.[5–11]Since the pre-formed pairing usually displays particle–hole symmetry while the competing orders may not,the examination of the particle–hole symmetry is crucial to understanding the nature of the pseudogap. In the underdoped Bi2Sr2CaCu2O8+δ(Bi2212)superconductor,it is reported from the angle-resolved photoemission(ARPES)measurements that,in the pseudogap state,the particle–hole symmetry breaks near the nodal region but is conserved near the antinodal region.[12]In the optimally-doped Bi2Sr2CuO6+δ(Bi2201)superconductor,dramatic electronic structure change is observed acrossT?andTcover a wide momentum space,suggesting a phase transition acrossT?and the breaking of the particle–hole symmetry and the spatial symmetry in the pseudogap state.[8,9]These unusual phenomena are interpreted in terms of the pair density wave formation in cuprate superconductors.[10]Considering the importance of the particle–hole symmetry in understanding the nature of the pseudogap,it is crucial to establish whether the observed phenomena in Bi2212[12]and Bi2201[8,9]are intrinsic and universal in the pseudogap state of the cuprate superconductors.
In this paper, we report the observations of the particle–hole symmetry conservation in both the superconducting state and the pseudogap state by performing high resolution laser-based ARPES measurements on the optimally-doped Bi2Sr1.6La0.4CuO6+δ(La-Bi2201) superconductor. The Fermi surface topology and the band structures exhibit little change with temperature across the pseudogap temperatureT?. The particle–hole symmetry is observed along the entire Fermi surface both in the pseudogap state and in the superconducting state. These results provide key insights in understanding the nature of the pseudogap and its relation with high temperature superconductivity.
The ARPES measurements were performed by using our lab-based laser ARPES system equipped with the 10.897 eV vacuum-ultra-violet(VUV)laser and an angle-resolved timeof-flight electron energy analyzer (ARToF) which can simultaneously detect the two-dimensional momentum space.[13,14]The energy resolution was set at~1 meV and the angular resolution was~0.1?, corresponding to a momentum resolution of~0.0023 ?A?1at the photon energy of 10.897 eV.High quality single crystals of the optimally-doped La-Bi2201 were grown by the traveling solvent floating zone method.The samples were post annealed in the flowing oxygen to adjust the hole concentration and make the samples uniform.[15]For convenience,we use Opt32K to represent the optimally-doped Bi2201 sample with aTcof 32 K. The pseudogap temperatureT?is~150 K as determined from ARPES and NMR measurements.[16,17]The sample was cleavedin situat 20 K and measured in vacuum with a base pressure better than 5×10?11Torr. The Fermi level is referenced by measuring on a clean polycrystalline gold that is electrically connected to the sample and also by the ARPES data along the nodal direction which are known to have zero superconducting gap.
Figure 1 shows the Fermi surface mappings of the Opt32K Bi2201 sample measured at different temperatures across both the superconducting transition temperatureTcof 32 K and the pseudogap temperatureT?of~150 K. It consists of two separate measurements: one is centered around the nodal region(Figs.1(a1)–1(a5))and the other is centered around the antinodal (π, 0) region (Figs. 1(b1)–1(b5)). Each Fermi surface mapping is obtained by using our ARToF analyzer which can simultaneously cover the two-dimensional momentum space with high energy and momentum resolutions. The entire Fermi surface of Bi2201 is measured by combining the nodal and antinodal Fermi surface mappings in Figs. 1(a1)–1(a5) and 1(b1)–1(b5). It is well-known that,in Bi-based cuprate superconductors, the structural modulations along theΓ–Ydirection give rise to superstructure bands,i.e., extra replica bands that are formed by shifting the original Fermi surface by±nQ, whereQis the vector of the structural modulation andnis the order of the superstructure bands.[18–22]In addition,there are also shadow bands and the superstructure bands of the shadow bands.[18–20]As depicted in Figs. 1(a5) and 1(b5), all the observed Fermi surface sheets can be well assigned to the main Fermi surface(MB, thick red line), the first-order superstructure bands of the main Fermi surface (SSB 1, solid pink line), the secondorder superstructure bands of the main Fermi surface(SSB 2,dashed pink line),the shadow band of the main Fermi surface(SDB,purple line)and the first-order superstructure bands of the SDB shadow band(SDB SS1,blue line). The main Fermi surface stands out clearly in all the measurements (thick red lines in Fig.1)although it is complicated by other Fermi surface sheets, particularly near the antinodal region. The main Fermi surface exhibits little change with temperature over the whole temperature range of 20–200 K,as seen in Fig.1 where the same thick red lines agree well with the observed main Fermi surface at different temperatures.
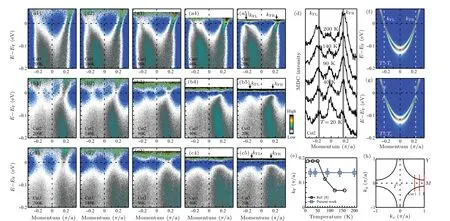
Figure 2 shows the temperature dependence of the band structures in the Opt32K Bi2201 sample measured along three typical momentum cuts near the antinodal region. In order to directly visualize the gap opening and the particle–hole symmetry, the presented band structures in Figs. 2(a1)–2(c5) are obtained by dividing the original data with the corresponding Fermi–Dirac distribution functions to show the electronic states above the Fermi level. The corresponding photoemission spectra(energy distribution curves,EDCs)are presented in Fig. 3. To better understand the data, we simulated the single-particle spectral function of a conventional BCS superconductor in the normal state (Fig. 2(f)) and in the superconducting state (Fig. 2(g)). In this case, the particle–hole symmetry is conserved which can be judged from two aspects. The first is that the Fermi momentumkFkeeps fixed in the normal and superconducting states. The second is that the single-particle spectral functionA(k,ω) satisfiesA(kF,ω)=A(kF,?ω) at the Fermi momentumkF. The gap opening corresponds to the spectral weight suppression at the Fermi level.
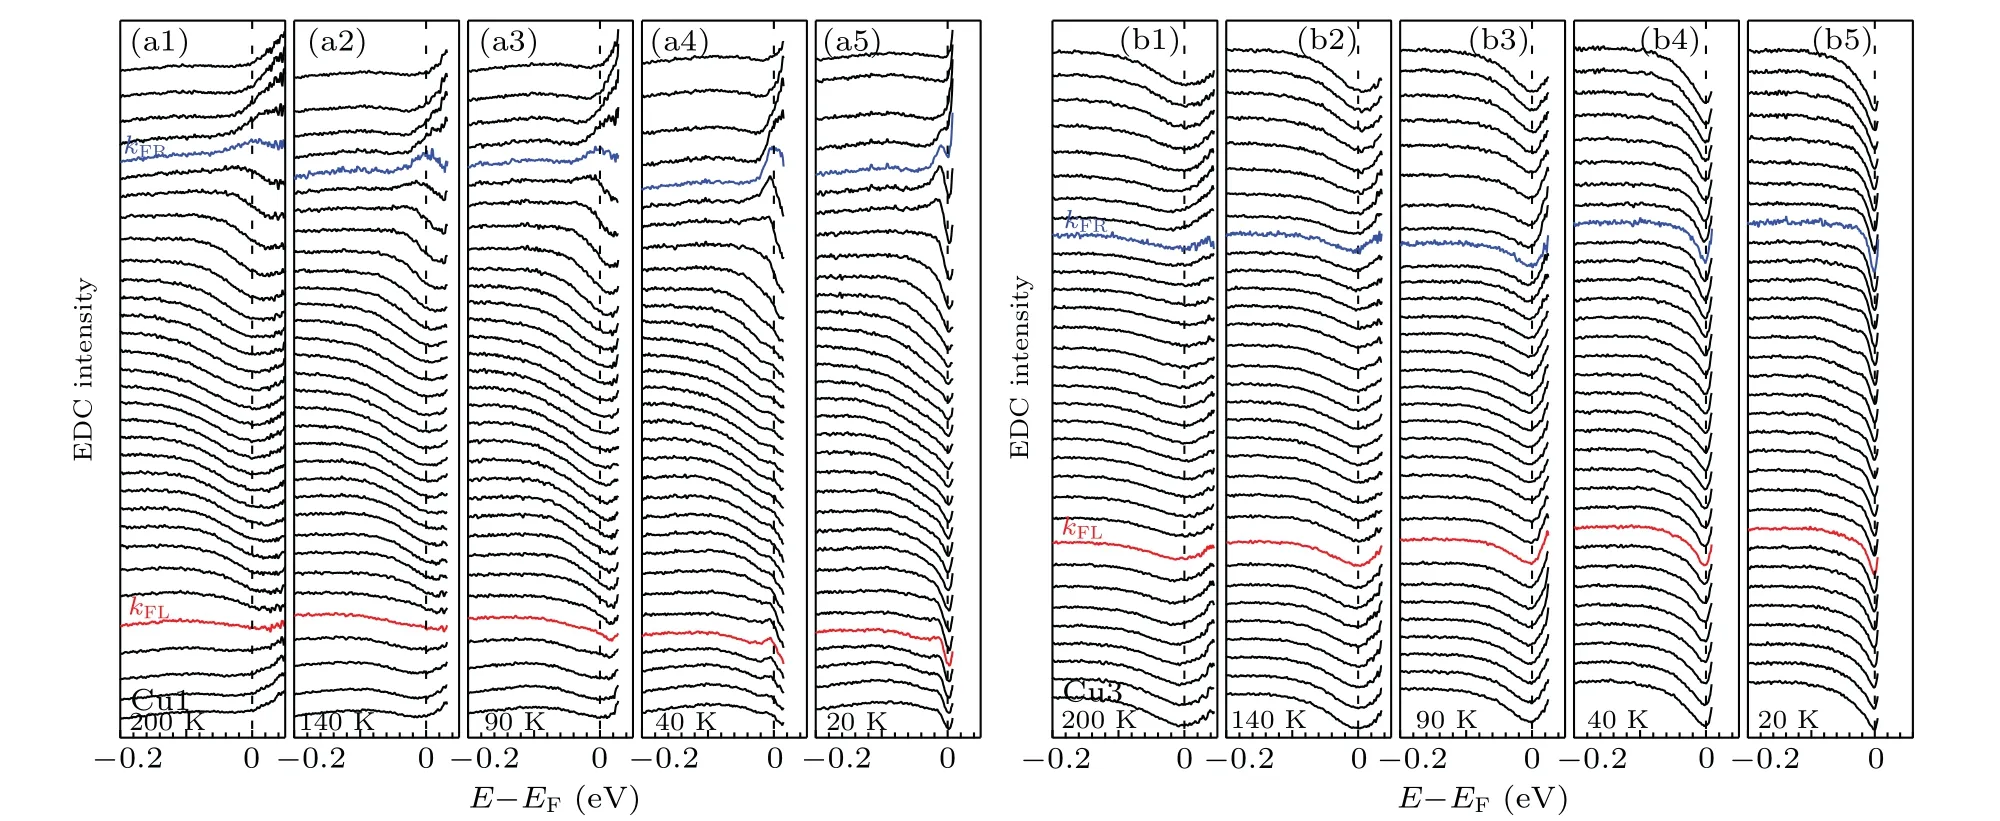
We find that the particle–hole symmetry is conserved in both the pseudogap state and the superconducting state near the antinodal region as seen in Figs.2 and 3. First,the Fermi momentum shows little change upon crossing the pseudogap transition and the superconducting transition. Figure 2(d)shows the momentum distribution curves(MDCs)at the Fermi level obtained from the band structures measured along the momentum cut 2 at different temperatures(Figs.2(b1)–2(b5)).No obvious change of the two Fermi momenta(kFLandkFR)is observed in the measured temperature range of 20–200 K.The same is true for the Fermi momentum from the antinodal cut 3 that is plotted in Fig. 2(e). These are consistent with the fixed Fermi surface observed at different temperatures in Fig. 1. Second, as the temperature decreases from 200 K,the pseudogap opening betweenT?andTcand the superconducting gap opening belowTccan be directly visualized from the spectral weight suppression at the Fermi level in the measured band structures shown in Figs. 2(a1)–2(c5). One can also see from these band structures that,when either the pseudogap or the superconducting gap opens,the spectral function at the Fermi momentum is nearly symmetric with respect to the Fermi level. These can be directly observed from EDCs at the Fermi momentum shown in Fig.3(blue and red curves)which are nearly symmetric with respect to the Fermi level.

Fig.2. Temperature dependence of the band structures near the antinodal region in Opt32K Bi2201. (a1)–(a5)Band structures along the momentum cut 1 measured at different temperatures of 200 K(a1),140 K(a2),90 K(a3),40 K(a4)and 20 K(a5). The location of the momentum cut 1 is shown in(h)by a red line. The Fermi–Dirac distribution function is removed from the images. The Fermi momenta are marked by two arrows labeled as kFL and kFR in(a5). (b1)–(b5)Same as(a1)–(a5)but measured along the momentum cut 2. (c1)–(c5)Same as(a1)–(a5)but measured along the momentum cut 3.(d)Momentum distribution curves(MDCs)at the Fermi level obtained from(b1)–(b5). The two main peaks are marked as kFL and kFR,corresponding to the Fermi momenta in(b1)–(b5). For clarity,the data are offset along the vertical axis. (e)Fermi momentum at different temperatures(blue empty squares)obtained from the antinodal cut 3 measurements. For comparison,the antinodal Fermi momentum change with temperature from the previous measurements[8,9] is also plotted(black empty circles). (f)The simulated single-particle spectral function in the normal state. (g)The corresponding single-particle spectral function in the superconducting state simulated by using the BCS formula.[24] The superconducting gap is 15 meV used in the simulation. (h)Schematic Fermi surface of the Opt32K Bi2201 and the location of the momentum cuts.
Our measured results of the optimally-doped La-Bi2201 near the antinodal region shown in Figs. 1–3 are rather different from the previous reports on the optimally-doped Pb0.55Bi1.5Sr1.6La0.4CuO6+δ.[8,9]In that case, dramatic electronic structure changes are observed both acrossT?and acrossTcnear the antinodal region.The Fermi momentum and the corresponding Fermi surface exhibit an obvious change across the pseudogap transitionT?indicating the breaking of the particle–hole symmetry (also plotted in Fig. 2(e) for comparison).[8,9]A complex structure with two energy scales below the Fermi level develops belowTcin the superconducting state which can not be derived by the BCS formula from the band structure in the normal state aboveT?. In our case,except for the narrow energy range near the Fermi level which is sensitive to the gap opening, most of the band structures do not show obvious change with temperature in the entire range of 20–200 K, as seen in Fig. 2. The Fermi momentum and the corresponding Fermi surface do not change acrossT?and the particle–hole symmetry is observed in the pseudogap state. In the superconducting state, we do not observe the complex electronic structures reported before[9]and the electronic structures in the superconducting state can be well connected to the normal state by the BCS picture. The origin of the big difference between our results and the previous measurements[8,9]needs to be further investigated. We note that,in the optimally-doped Bi2212 superconductor,no obvious electronic structure changes are observed acrossT?andTcand the particle–hole symmetry is conserved in the pseudogap state and the superconducting state.[23]These observations are consistent with our present results on Bi2201. They indicate that the particle–hole symmetry breaking acrossT?reported before[8,9]is not universal in high temperature cuprate superconductors.

Fig. 3. Temperature dependence of the energy distribution curves (EDCs) in Opt32K Bi2201 measured along two typical momentum cuts.(a1)–(a5) EDCs along the momentum cut 1 measured at different temperatures of 200 K (a1), 140 K (a2), 90 K (a3), 40 K (a4) and 20 K(a5)obtained from the images in Figs.2(a1)–2(a5). The EDCs at the Fermi momenta,kFR and kFL,are highlighted by the blue and red lines,respectively. For clarity,the EDCs are offset along the vertical axis. (b1)–(b5)Same as(a1)–(a5)but for the momentum cut 3 obtained from the images in Figs.2(c1)–2(c5).

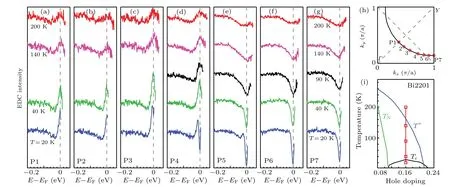
Fig. 4. Particle–hole symmetry along the entire Fermi surface of Opt32K Bi2201 in the pseudogap state and in the superconducting state.(a) EDCs measured at the Fermi momentum P1 at different temperatures. The location of the P1 point is indicated in (h). The Fermi–Dirac distribution function is removed in the EDCs. For clarity, the EDCs are offset along the vertical axis. (b)–(g) Same as (a) but measured at the momentum points of 2(b), 3(c), 4(d), 5(e), 6(f)and 7(g). (h)Schematic Fermi surface of Bi2201 and the location of the momentum points P1–P7 along the Fermi surface. (i)Schematic phase diagram of Bi2201.[16] The blue, black and green lines show the temperatures of pseudogap,superconductivity and antiferromagnetic order. The red line indicates the temperature range of our ARPES measurements.
Now we come to examine the momentum dependence of the particle–hole symmetry along the Fermi surface. In the underdoped Bi2212,it is reported that,in the pseudogap state,the particle–hole symmetry is conserved near the antinodal region but breaks near the nodal region.[12]To this end,we show EDCs along the whole Fermi surface measured at different temperatures in Fig.4. We find that,when the pseudogap develops betweenT?andTc, or the superconducting gap opens belowTc,all the EDCs along the Fermi surface are nearly symmetric with respect to the Fermi level. These results indicate that the particle–hole symmetry is conserved along the entire Fermi surface both in the pseudogap state and in the superconducting state.
In summary, by taking high-resolution laser-based ARPES measurements on the optimally-doped Bi2201, we have observed the particle–hole symmetry conservation across the pseudogap transition along the entire Fermi surface. These results provide key information to understand the nature of the pseudogap and its relation with high temperature superconductivity in cuprate superconductors.
Acknowledgements
Project supported by the National Natural Science Foundation of China (Grant Nos. 11888101, 11922414 and 11974404), the National Key Research and Development Program of China (Grant Nos. 2021YFA1401800,2017YFA0302900,2018YFA0305602,and 2018YFA0704200),the Strategic Priority Research Program (B) of the Chinese Academy of Sciences (Grant Nos. XDB25000000 and XDB33000000),the Youth Innovation Promotion Association of the Chinese Academy of Sciences (Grant No. 2021006),the Synergetic Extreme Condition User Facility(SECUF)and the Research Program of Beijing Academy of Quantum Information Sciences(Grant No.Y18G06).
- Chinese Physics B的其它文章
- Direct measurement of two-qubit phononic entangled states via optomechanical interactions
- Inertial focusing and rotating characteristics of elliptical and rectangular particle pairs in channel flow
- Achieving ultracold Bose–Fermi mixture of 87Rb and 40K with dual dark magnetic-optical-trap
- New experimental measurement of natSe(n,γ)cross section between 1 eV to 1 keV at the CSNS Back-n facility
- Oscillation properties of matter–wave bright solitons in harmonic potentials
- Synchronously scrambled diffuse image encryption method based on a new cosine chaotic map

