Preventive Effect of Linoleic Acid and α-Linolenic Acid Mixtures on Acute Liver Injury in Mice
SHA Shuang, FENG Qixin, ZHANG Xinrui, WANG Yue, YIN He, LI Chongwei,3,*
(1. Engineering Research Center of Agricultural Microbiology Technology, Ministry of Education, Heilongjiang University,Harbin 150500, China; 2. College of Life Sciences, Heilongjiang University, Harbin 150080, China;3. Harbin Meisu Biotechnology Development Co., Ltd., Harbin 150080, China)
Abstract: This study aimed to investigate the effect of linoleic acid and α-linolenic acid mixtures on acute liver injury and the intestinal microflora diversity in mice. In total 80 specific pathogen free (SPF) Kunming mice were divided into eight groups: normal, CCl4-induced model, positive control, and linoleic acid/α-linolenic acid mixtures at ratios of 4:1, 2:1, 1:1,1:2 and 1:4. Serum immune functions and intestinal microflora structure in each group of mice were determined. The results showed that linoleic acid and α-linolenic acid mixtures could significantly reduce the activity of aspartate aminotransferase(AST) and alanine aminotransferase (ALT) (P < 0.05), decreased liver and spleen indices (P > 0.05), and decreased the content of malondialdehyde (MDA) as well as the expression levels of tumor necrosis factor-α (TNF-α) and interleukin-6(IL-6) in liver cells (P < 0.05) compared with CCl4-induced model . These changes were consistent with the results of liver histopathological observation. High throughput sequencing results showed that the diversity of intestinal microflora in the model group dropped significantly compared with normal group (P < 0.05), while the diversity and abundance of intestinal microflora significantly increased after intervention with the 2:1 mixture of linoleic acid/α-linolenic acid compared with the CCl4 model group (P < 0.05), and its structure also changed. Moreover, the most prominent hepatoprotective effect was observed with the 2:1 mixture of linoleic acid and α-linolenic acid, which was basically consistent with that of silybin as a positive control. These results not only confirm the hepatoprotective effect of linoleic acid/α-linolenic acid mixtures, but also provide a theoretical basis for the scientific intake of linoleic acid/α-linolenic acid mixtures and serve as a guide for future development and application of hepatoprotective agents.
Keywords: α-linolenic acid; linoleic acid; acute liver injury; liver protection; intestinal flora
It has been commonly accepted that linoleic acid(unsaturated fatty acid omega-6 series) can promote metabolism, enhance fat decomposition, and prevent arteriosclerosis. Alpha-linolenic acid (unsaturated fatty acid omega-3 series) has the effects of improving neurofunction,protecting the liver, lowering blood lipids and blood pressure. These two kinds of unsaturated fatty acids are essential fatty acids that cannot be synthesized by the human body and need to be obtained from diet. Studies have shown that when linoleic acid and-linolenic acid are used in combination, it is necessary to have the appropriate ratio. Exceeding a certain ratio will increase the probability of certain disease development because omega-6 fatty acids and omega-3 fatty acids will compete for the same rate limit. Some enzymes and excessive omega-6 will limit the benefits brought by omega-3 to the human body. The World Health Organization (WHO) recommends that the daily dietary intake ratio of linoleic acid and-linolenic acid is 5–10:1, Sweden recommends 5:1, Japan recommends 2–4:1, and China recommends 4–6:1. Research on the combined effects of linoleic acid and-linolenic acid globally has made certain progress. Studies have shown that-linolenic acid, which is expressed at a high level in the liver proteome of Japanese sea bass, can inhibit lipid transport and protein biosynthesis, reduce the ratio of linoleic acid/-linolenic acid and the inflammatory mediators produced by human endothelial cells, and-linolenic acid has a better hepatoprotective and enzyme-lowering effect. In recent years, due to changes in people’s diet and lifestyles, such as alcohol consumption and irrational drug use, non-infectious liver damage has become a more common clinical disease,and the number of patients has risen sharply, causing a high mortality rate. The “2030 Healthy China” plan proposed by the State Council of China regards the prevention and alleviation of liver damage as a long-term and arduous task in the healthcare industry. For people with liver injury, the ratio of linoleic acid and-linolenic acid in the daily diet is crucial, but it remains unclear whether the lipids produced by the metabolism of unsaturated fatty acids burden liver metabolism. In this experiment, mice model of acute liver injury was constructed by injecting CCl. The mice were fed with different ratios of linoleic acid/-linolenic acid complex,and the changes in the liver tissue cells and intestinal microflora were recorded to determine the linoleum. The hepatoprotective effect of the linoleic acid/-linolenic acid complex provides a theoretical reference for establishing the optimal consumption ratio of linoleic acid and-linolenic acid for patients with liver injury.
1 Materials and Methods
1.1 Animals, materials and reagents
Kunming SPF mice were purchased from Hongchang Farm in Shuangcheng District, Harbin (certificate number SCXK(Heilongjiang)2007-0001), weighing 18–20 g.
Aspartate aminotransferase (AST), alanine aminotransferase (ALT), malondialdehyde (MDA),superoxide dismutase (SOD), glutathione peroxidase (GSHPx), reduced glutathione (GSH), tumor necrosis factor(TNF-α) and interleukin 6 (IL-6) diagnostic kit Nanjing Jiancheng Institute of Bioengineering (China); Coomassie brilliant blue G250 Shanghai Lanji Biological Co.,Ltd. (China);-linolenic acid, linoleic acid (food grade)Nanjing Ximenuo Biological Technology Co., Ltd.(China); silybin capsules (National Medicine Standard No.H20040299, specifications: each silybin containing 36 mg,aluminum foil packaging (10 tablets/plate)) Tianjin Taslite Co., Ltd.; carbon tetrachloride (CCl), Tween 80 (food grade)Shanghai Sinopharm Chemical Reagent Co., Ltd. (China).
1.2 Instruments and equipment
STP420 automatic dehydrator, E350 split tissue embedding machine, HM355S semi-automatic paraffin slicer, Nanodrop 2000 Thermo Fisher Scientific(USA); ECL Plus Western Blotting System Amersham LifeScience (UK).
1.3 Method
1.3.1 Experimental design
Experimental animal breeding: male and female mice were kept in separate cages and fed adaptively for 7 d (relative temperature maintained (22 ± 2) ℃, relative humidity was maintained at (50 ± 10)%, noise<60 dB, day time and night were stimulated at an interval of 12 h. Unlimited food and fresh drinking water were always available).
Experimental grouping: The male to female ratio of the rates was 1:1, they were randomly divided into 8 groups with 10 mice in each group. Groups are divided into normal group(NG), the CClmodel group (MG), and the ratio of linoleic acid to-linolenic acid group (1:4 group; 1:2 group; 1:1 group;2:1 group; 4:1 group). Before the experiment, the mice were weighed individually, and there was no significant difference in the mass of the mice between the groups (> 0.05).
In NG and MG, 0.3 mL of double-distilled water was administered by gavage; in the positive control group(PG), 0.3 mL of silibinin was administered by gavage(200 mg/kg); the gavage amount was 0.3 mL for all groups(800 mg/kg), and the ratio in each group represents the proportion of linoleic acid to-linolenic acid.
Continuous intragastric administration lasted for 7 d,except for the NG in which intraperitoneal injection of peanut oil (10 mL/kg) was adopted, the other groups were injected with 0.3% (/) CClpeanut oil solution(10 mL/kg). The mice fasted but not water. After 24 h,blood was drawn from the eyeballs, the necks were severed,and the liver and spleen were stripped and weighed. Another left liver lobule was taken for histopathological section observation, and the rest of the liver tissue was quickly frozen at -80 ℃. Liver/spleen index is calculated as follows.

1.3.2 Determination of serum liver function indices
Serum ALT and AST levels have been used as biomarkers of liver injury. These enzymes are localized in the cytoplasm and released into the blood after cell injury.Before the mice were sacrificed, 1.0 mL of blood was collected from the eyes, and left standing at room temperature for 0.5 h. The serum was separated by centrifugation at 4 ℃and 4 000 r/min for 15 min, and the activity of ALT and AST in the serum was measured by corresponding kits.
1.3.3 Determination of SOD and GSH-Px activity, MDA and GSH content in liver tissue
SOD and GSH-Px are indicators of tissue antioxidant status. SOD can block lipid peroxidation and protect cells from damage. GSH-Px can play a role in protecting the integrity and functions of cell membrane structures. 0.30 g of frozen mice liver tissue was collected and 2.7 mL of ice-cold 0.9% (/) normal saline was added to make 10% (/)liver homogenate, which was centrifuged at 4 ℃, 3 500 r/min for 15 min; the supernatant was collected, the SOD and GSH-Px activity, along with the MDA and GSH content were determined by the method of reference [23].
1.3.4 Determination of TNF-α and IL-6 in liver tissue
After liver injuries, cells respond to stimuli by producing cytokines, such as TNF-α and IL-6. TNF-α is mainly produced by activated monocytes or macrophages, it can kill and inhibit tumor cells, promote neutrophil phagocytosis,induce acute protein synthesis in liver cells, and promote the proliferation and differentiation of myeloid leukemia cells into macrophages. It is an important inflammatory factor and is involved in the pathological damage of certain autoimmune diseases. The increase in IL-6 and TNF-α levels is always related to liver disease. Use the enzymelinked immunosorbent assay (ELISA) kit to measure the levels of TNF-α and IL-6 in liver tissues according to the operating instructions.
1.3.5 Liver tissue protein determination
The protein samples containing the same amount of protein were separated by 10% (/) sodium dodecyl sulfate-polyacrylamide gel electrophoresis, transferred to a polyvinylidene fluoride membrane and blocked in 3% (/)bovine serum albumin. After blocking, the membrane was probed with a specific primary antibody at 4 ℃overnight. Then, it was washed three times with the Tris buffered saline, and incubated with the secondary antibody.Finally, the ECL Plus Western Blotting System visualization system was used for observation. The total protein was extracted using the T-PER tissue protein extraction kit, and the protein concentration was determined by bicinchoninic acid protein determination kit.
1.3.6 Histopathological examination of liver
The fresh left liver lobe (liver lobule) of the mice was soaked in a neutral pH (7.2-7.4) 10% (/) formalin solution for 24 h, then it was cut into a 2 mm thick sample with an area of 1.5 mm × 1.5 mm and put in the embedding box to be soaked in the same formalin solution for a further 24 h. The sample block was taken out and rinsed with running water for 3-5 h. After dehydration and paraffin embedding, it was cut into 2 μm slices with a microtome, and then hematoxylin and eosin (HE) staining was used for observation under an optical microscope.
1.3.7 Determination of the bacterial flora in the mice intestine
Stool samples of mice were collected, the genomic DNA was extracted and detected by 1% agarose gel electrophoresis.The DNA was then purified by Power Clean DNA Cleanup Kit (MoBio, CA, USA), and its concentration and purity were determined by the Nanodrop. Specific primers 341F and 806R were used to amplify the 16S rRNA V3–V4 region and recovered with a gel recovery kit after electrophoresis detection. The Illumina PE 250 sequencing platform was utilized to construct a library and effective sequences were selected to analyze the composition of mice intestinal microflora. The experimental operation was commissioned to Shanghai Lingen Biotechnology Co., Ltd.
1.4 Statistical analysis of data
Using SPSS 16.0 software, all data were statistically analyzed by one-way variance (ANOVA), Fisher LSD (least significant difference) test and-test,< 0.05 indicates significant differences between samples. The Ribosomal Database Project (RDP) classifier Bayesian algorithm was used to cluster analysis of 97% similar operational taxonomic unit (OTU) sequences.
2 Results and Analysis
2.1 Mice organ indices
Each group of mice was dissected, and the results of the liver and spleen tissue mass are shown in Table 1. There was no abnormality in the eight groups of experimental mice, and no obvious pathological changes were found in the dissection of the hearts, livers, spleens, stomachs, intestines,and lungs. There was no significant difference in average mass gain among the groups, which satisfies the experimental conditions.
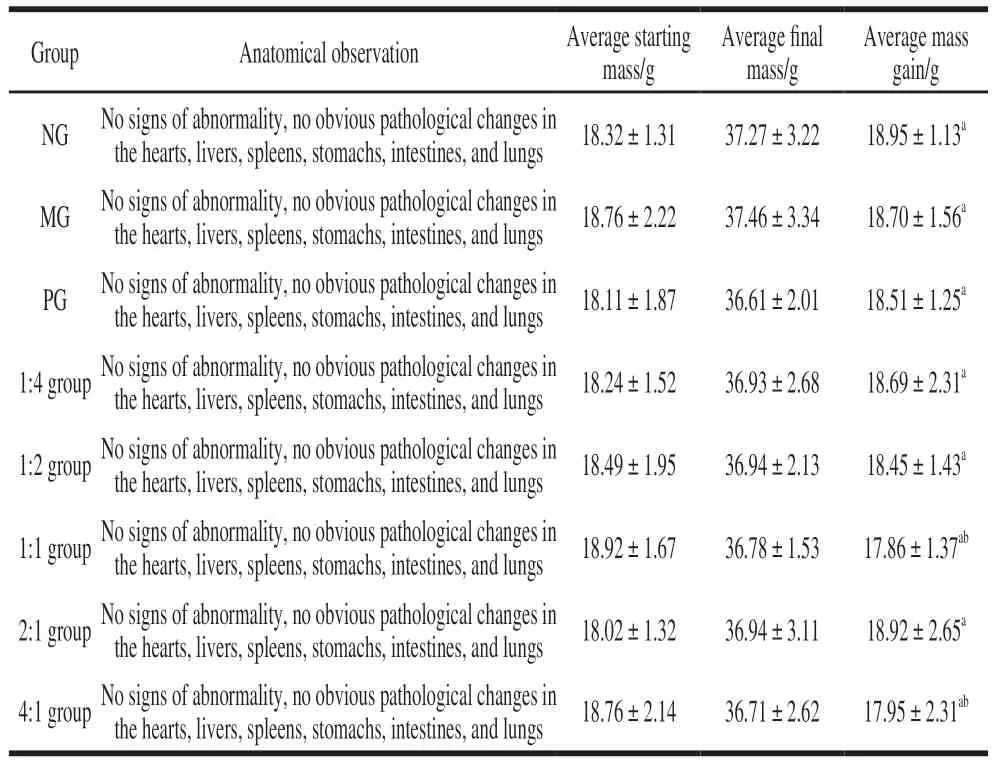
Table 1 Changes in physical signs of mice
It can be seen from Fig. 1 that the changes of the liver index and spleen index of mice are basically the same.The indices of the PG and each compound group were significantly lower than that of MG (< 0.05). The liver and spleen indices of the PG and 4:1, 2:1, 1:2, 1:4 group were essentially the same, and the groups mentioned above were not significant compared with the NG in general (> 0.05).
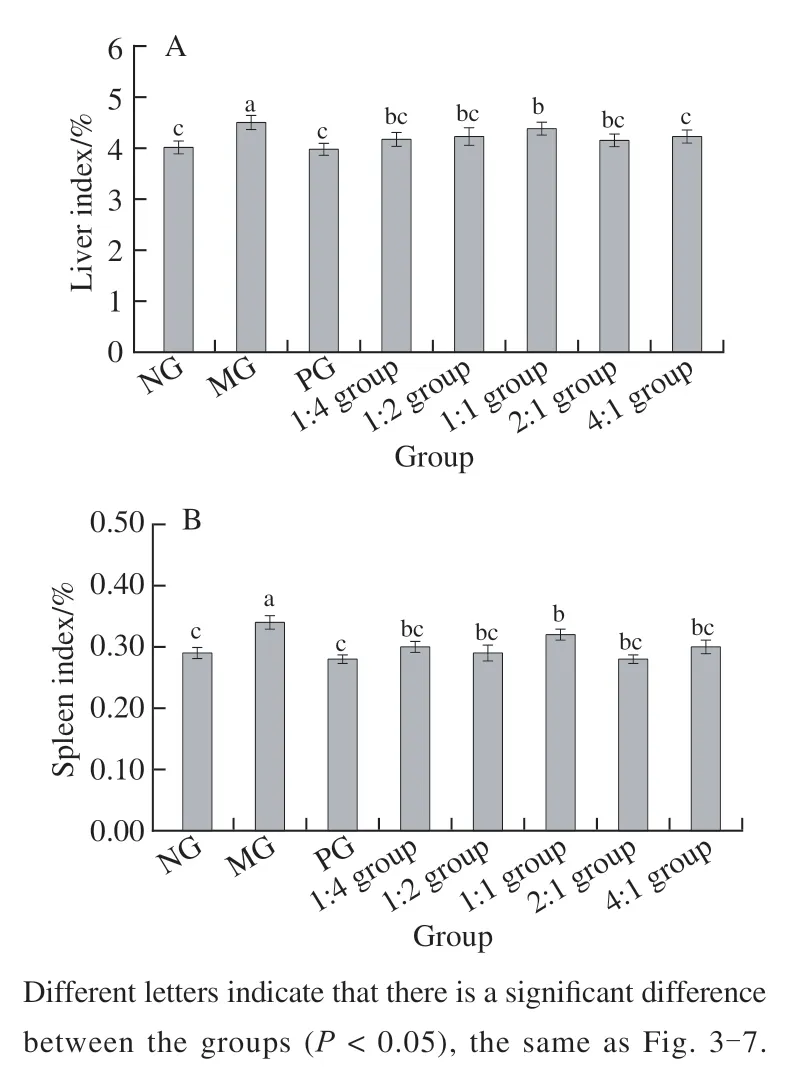
Fig. 1 Liver index (A) and spleen index (B) of mice
2.2 Mice liver cell morphology
The results of liver histopathological microsections are shown in Fig. 2. The histological features are fundamentally the same between the PG (Fig. 2C) and the NG (Fig. 2A).It can be seen that the structure of liver lobules is clear, the liver cells are neatly arranged, the morphology and structure are regular, and the cell membrane, cytosol, and nucleus can be clearly seen. In the MG (Fig. 2B), multiple focal necroses of hepatocytes, pyknosis of the nucleus, and inflammatory cell infiltration can be observed, and a small amount of hemorrhage was scattered beside the small veins in the portal area. In the 1:4 (Fig. 2D), 1:2 (Fig. 2E), 1:1 (Fig. 2F), and 4:1 (Fig. 2H) groups, various degrees of reduction in the liver tissue cell damage are present compared with MG. Among them, the morphology and structure of liver cells in the 2:1 group (Fig. 2G) were better than those in other experimental groups and were basically the same as the NG.
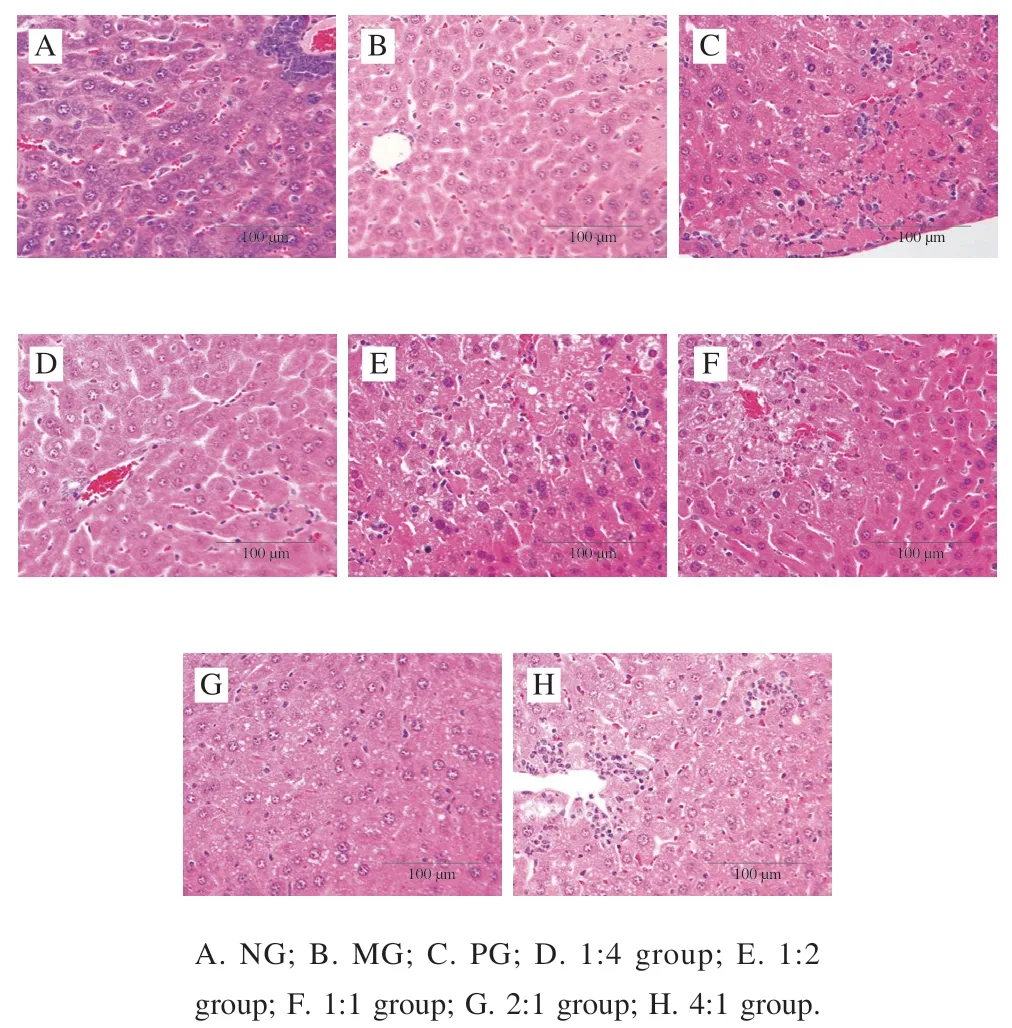
Fig. 2 HE staining of liver tissue section (100 ×)
2.3 Mice serum AST and ALT activity
As shown in Fig. 3, the change trends in serum AST and ALT activities of mice in each group were essentially the same. Compared with the NG, the serum AST and ALT activities of the MG were significantly increased (< 0.05),and the serum AST of the complex 1:2 combination and 1:1 group was higher than that of the NG significantly (< 0.05).The serum ALT activity of the 1:4 combination and 1:2 group was higher than that of the NG significantly (< 0.05). The serum AST and ALT activities of the complex 2:1 group and 4:1 group were not significantly different from those of the NG (> 0.05).
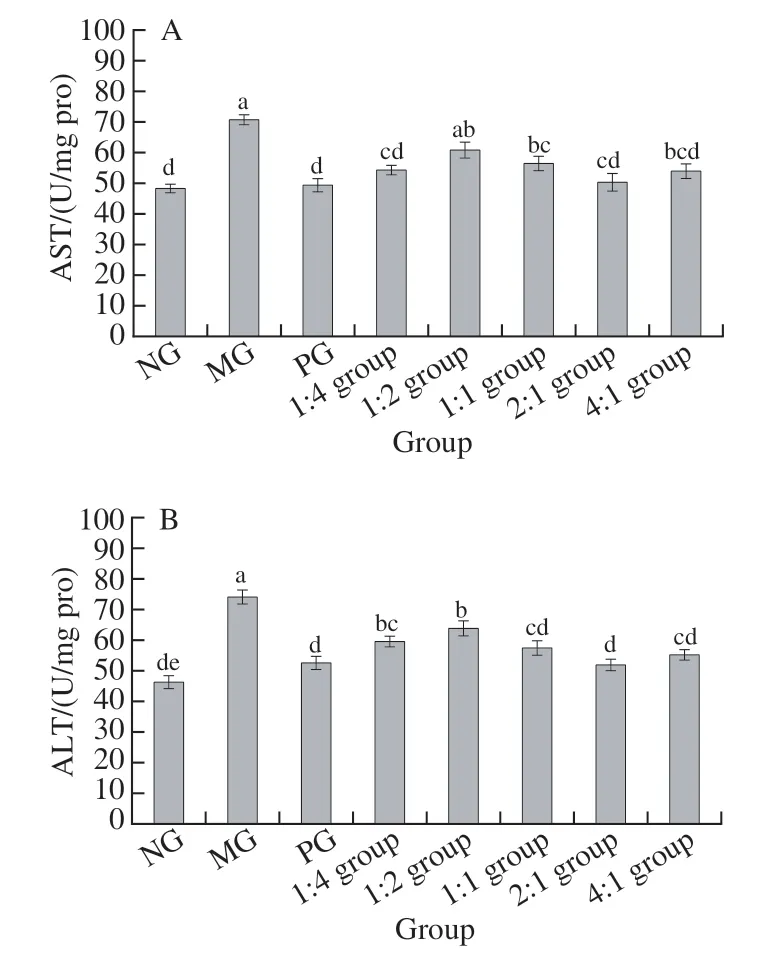
Fig. 3 AST (A) and ALT (B) activity in serum of mice
2.4 Activities of SOD and GSH-Px of the mice liver tissue cells
As displayed in Fig. 4, the change trends in serum SOD and GSH-Px activities of mice in all groups are more or less the same. Compared with the NG, SOD and GSH-Px activities of the MG were significantly reduced (< 0.05).SOD and GSH-Px activities of the complex 1:2 group and 1:1 group were lower than that of NG and 1:2 group higher than that of MG, these discrepancies are statistically significant(< 0.05). There were no statistically significant differences on the SOD and GSH-Px activities between PG, the complex 2:1 from the NG (> 0.05).
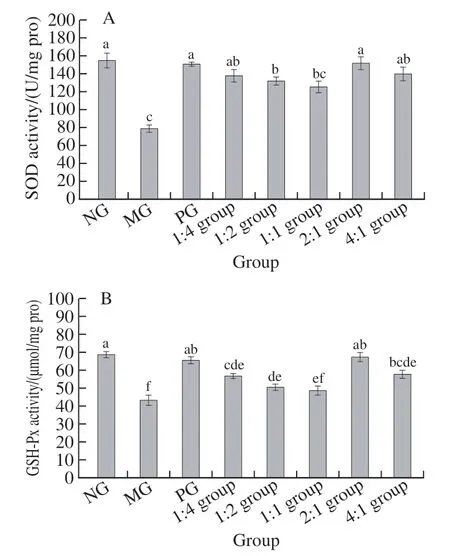
Fig. 4 SOD (A) and GSH-Px (B) activities in liver tissue
2.5 Contents of MDA and GSH in mice liver tissue
As shown in Fig. 5A, compared with the NG, MDA content of MG was significantly increased (< 0.05), just as those in the complex 1:2 group and 1:1 group (< 0.05). As demonstrated in Fig. 5B, compared with NG, GSH content of MG was significantly reduced (< 0.05), GSH content of the complex 1:1 group and 4:1 group was also significantly reduced (< 0.05), statistically significant differences were not observed in other groups when compared to the NG(> 0.05).
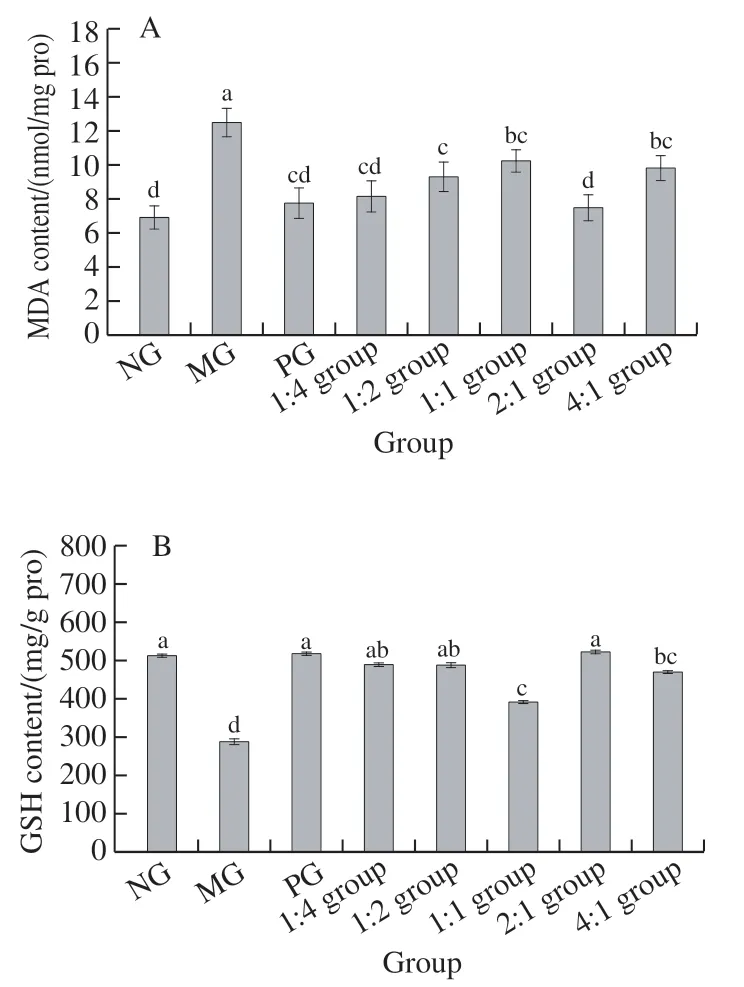
Fig. 5 MDA (A) and GSH (B) contents in liver tissue of mice
2.6 Contents of TNF-α and IL-6 in liver tissues of mice
Fig. 6 illustrates that the change trends of TNF-α and IL-6 content in each group of mice were essentially equivalent. Compared with the NG, the expression levels of TNF-α and IL-6 in the MG were significantly elevated(< 0.05), and the expression of TNF-α and IL-6 in the complex 1:4, 1:2, and 1:1 group was also significantly increased (< 0.05), and there was no significant difference between the PG, the complex 2:1 group and the 4:1 group compared with the NG (> 0.05).
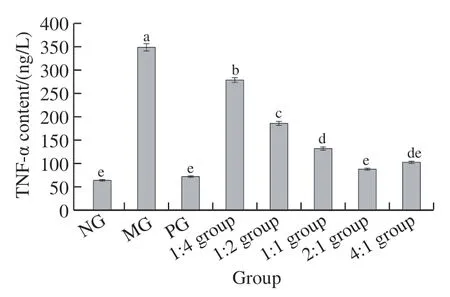
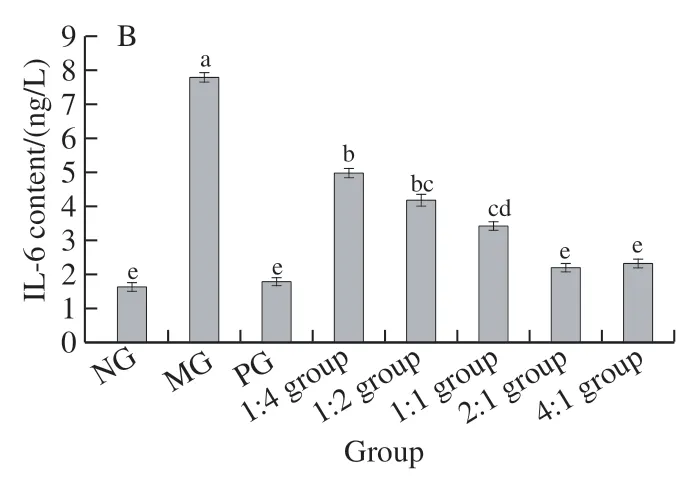
Fig. 6 Contents of TNF-α (A) and IL-6 (B) in liver tissue
2.7 Mice liver inflammatory protein
As shown in Fig. 7A, compared with the NG, the expression of NF-κB in the MG was significantly increased(< 0.05), and that of the complex 1:4, 1:2 group and 1:1 group was also significantly upregulated (< 0.05),there was no significant difference between the PG, the complex 2:1 group and the 4:1 group compared with the NG(> 0.05). As can be seen in Fig. 7B, compared with the NG,the expression of IκB in the MG was significantly reduced(< 0.05), so was that in the complex 1:4, 1:2, 1:1 group and 4:1 group (< 0.05), and there was no significant difference between the PG and the 2:1 complex group compared with the NG (> 0.05).
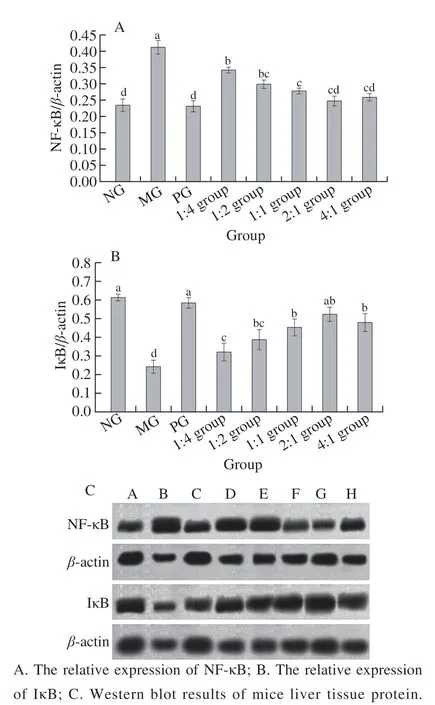
Fig. 7 Expression of inflammatory proteins in liver tissue of mice
2.8 Mice gut bacteria
The RDP classifier Bayesian algorithm is used to cluster analysis of OTU sequences with a similar level of 97%.OTUs represent the relative number of various species in the sample. It can be seen from Table 2 that compared with NG, OTUs of MG and PG were significantly decreased(< 0.05), and OTUs of the different complex groups were also significantly reduced (< 0.05). There were more OTUs in complex 2:1 group, however, this was not significantly different from the NG (> 0.05).
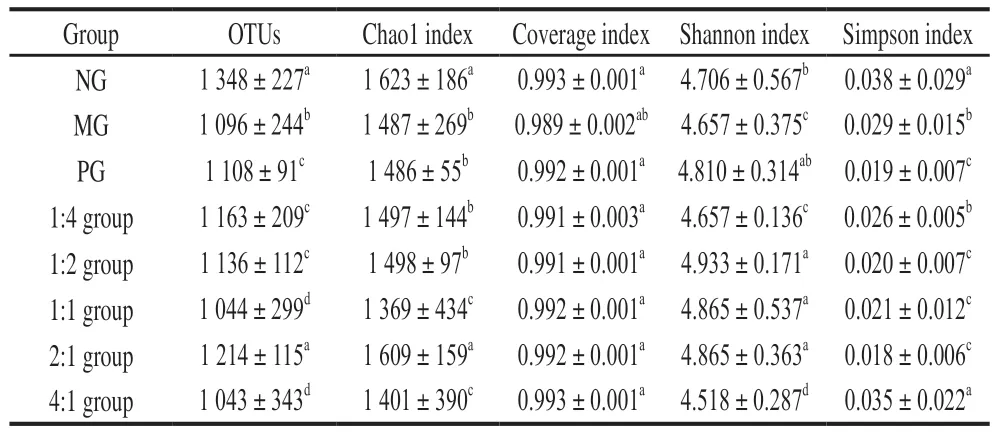
Table 2 Number of OTUs and alpha diversity index of samples from each experimental group
From the Chao1 index, compared with the NG,the number of taxa in the MG was considerably lower(< 0.05), so was that in the PG, complex 1:4 group and 1:2 group compared to NG (< 0.05). No statistically significant difference was found between the complex 2:1 group and NG (> 0.05). From the Shannon index, compared with NG,MG was significantly different (< 0.05), and there was no significant difference between the PG, complex 1:2, 1:1 group and 2:1 group (> 0.05). As for the Simpson index,compared with the NG, the diversities in MG, PG, complex 1:2, 1:1 group and 2:1 group were notably reduced (< 0.05),and there was no significant difference in complex 4:1 group(> 0.05), nor any significant difference between PG and complex 2:1 group (> 0.05).
Based on the cluster analysis of all sample sequences based on the phylum level, the mice intestinal bacterial flora is classified into 12 phyla. The results are shown in Fig. 8, which are Bacteroidetes, Firmicutes, Proteobacteria,Actinobacteria, Epsilonbacteraeota, Deferribacteres,Patescibacteria, Spirochaetes, Tenericutes, Fusobacteria,Cyanobacteria, and Verrucomicrobia. From the perspective of phylum level, most of the intestinal flora of each experimental group is Bacteroidetes, followed by Firmicutes and Proteobacteria. The bacterial community structure of the same experimental group is different. The relative abundance and diversity of bacteria in each experimental group have no obvious regularity.

Fig. 8 Relative abundance and cluster analysis of bacterial community in each experimental group at the phylum level
Analysis of the heatmap (Fig. 9) shows that each group has Bacteroidetes, Firmicutes, and Proteobacteria as the dominant phyla. The relative abundance of Epsilonbacteraeota was higher in MG, and the relative abundance of Deferribacteres was higher in PG.
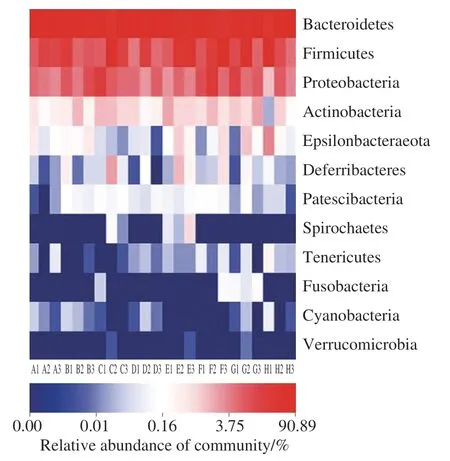
Fig. 9 Heatmap of phylum-level community structure
Principal component analysis (PCA) and principal coordinate analysis (PCoA) were used to analyze the Beta diversity of all samples to assess the similarity and difference of community composition. In Fig. 10, one point represents one sample, and the points with the same color belong to the same group. The closer the distance between the two points,the smaller the difference in bacterial communities between the two samples. Using the PCA principal component PC1 and secondary component PC2 to evaluate, PC1 contribution rate was 30.98%, and PC2 contribution rate was 16.34%;PCoA first principal coordinate PC1 and second principal coordinate PC3 were analyzed, PC1 contribution rate was 29.75%, and PC3 contribution rate was 11.94%. As shown in Fig. 10A and B, most of the samples of each experimental group are located in the same quadrant, indicating that the differences within the samples are small; individual differences are mainly due to changes in the ratio of different samples leading to considerable changes of the microbial community structure. Both PCA and PCoA showed that complex 4:1 group was not in the same quadrant as the others, indicating that the bacterial community structure of complex 4:1 group was different from that of other experimental groups.
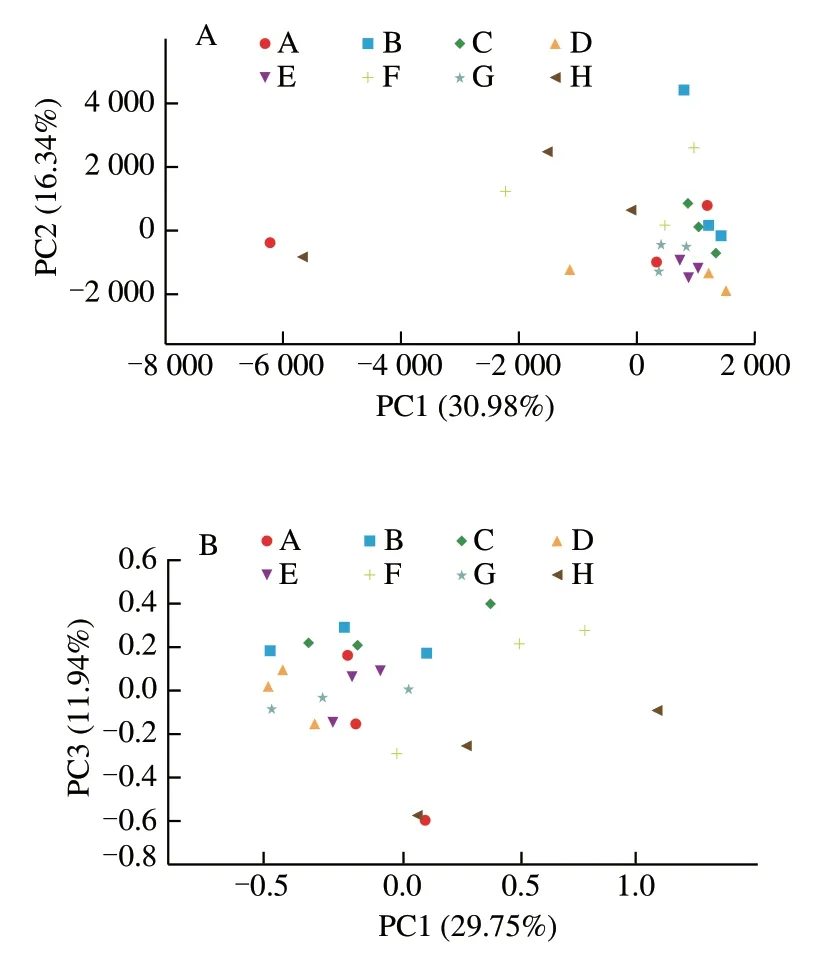
Fig. 10 PCA plot (A) and PCoA plot (B) of fecal bacteria in each experimental group
Based on the cluster analysis of all sequences at the genus level, the intestinal bacterial flora can be classified into 55 genera. The results are shown in Fig. 11. The main ones are,,,,, and.
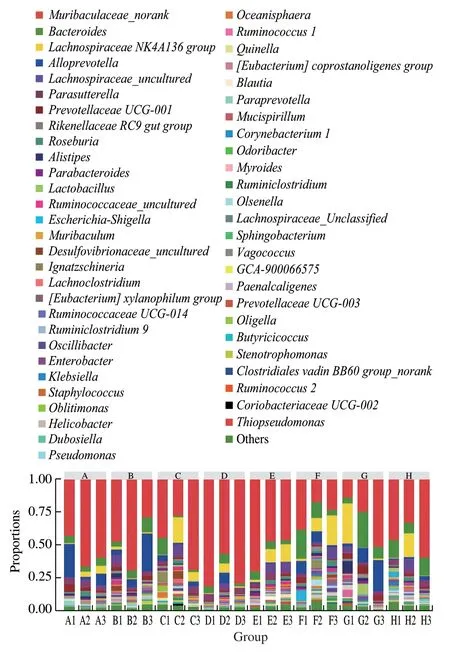
Fig. 11 Relative abundance of intestinal bacteria in each experimental group at the genus level
It is evident from Fig. 11 that compared with NG, there is no significant difference in the structure of the bacterial community between MG and PG. The relative abundances ofandin MG were slightly lower. Compared with MG, the relative abundance ofin the complex 1:2,1:1, and 2:1 groups were decreased. The relative abundance ofwas slightly elevated, and the relative abundance of Bacteroides increases, which is similar to the bacterial community structure of NG. Compared with MG, the relative abundance ofin the 2:1 group is significantly lower. As with the phylum level experiment results, the bacterial community structure of the same experimental group is quite different at the genus level,and the bacterial diversity of each experimental group is not drastically different.
3 Discussion
A CCl-induced acute liver injury model of mice was successfully constructed. It can be seen from Table 1 and Fig. 1 that after 24 h of intraperitoneal injection of CCl, the mass of the mice did not increase significantly,but considerable enlargement of the liver and spleen was observed (< 0.05), and the serum AST and ALT activities increased notably (< 0.05), liver tissue SOD and GSH-Px activities were significantly reduced (< 0.05), MDA content increased and GSH content decreased significantly(< 0.05), TNF-α and IL-6 levels were significantly increased (< 0.05). The comprehensive indicators indicated that liver tissue was damaged and produces characteristic inflammatory lesions, confirming that the CCl-induced acute liver injury model in mice has been successfully established, which is consistent with the method and conclusion adopted by Lu Yang et al.
The protective effect of linoleic acid/-linolenic acid complex on acute liver injury in mice. By measuring the serum liver function indices and liver tissue cell biochemical indices of liver-injured mice, as shown from Fig. 3 to Fig. 7,the complex can effectively alleviate the enlargement of the liver and spleen (< 0.05) compared with MG (< 0.05),this is consistent with the results in the experiment conducted by Swathi et al. Controlling the increase of serum AST and ALT activity (< 0.05), ensuring that SOD and GSH-Px activities of liver tissue cells are maintained at the normal levels (< 0.05), reducing MDA content and increasing GSH content (< 0.05), as well as strengthening the autoimmune system of hepatocytes, maintaining the normal structure and function of cell membranes, reducing the levels of TNF-α and IL-6 (< 0.05), effectively increasing IκB and inhibiting the production of NF-κB can all reduce inflammation of the liver tissues. Most of the indicators in the linoleic acid/-linolenic acid complex 2:1 group were significantly superior to those of the other groups (< 0.05),which is coherent with the hepatoprotective results of PG.The experimental results of the microscopic observation of liver tissue pathological sections corresponded to the aforementioned experimental results, which further supported the validity of the experimental results. The optimal ratio of linoleic acid/-linolenic acid complex is 2:1, which is lower than the ratio of linoleic acid/-linolenic acid in a normal diet (4:1). The demand for linolenic acid is higher, implying that-linolenic acid could have a hepatoprotective effect and enzyme-lowering ability.
The effect of the compound on the intestinal bacterial flora of mice with acute liver injury. The Chao1 index of NG and of complex 2:1 group was significantly higher than that of PG (< 0.05), indicating that CCl-induced acute liver injury in mice could reduce the abundance of the intestinal bacterial flora, while complex 2:1 group can hinder the destruction of the intestinal bacterial flora of mice and ensure the abundance of the intestinal flora. The results of Simpson index showed that the relative abundance of the intestinal flora structure was uneven, the number ofdecreased in the 1:2, 1:1 and 2:1 complexes, the number ofandincreased. The increase in number indicates that the linoleic acid/-linolenic acid complex has a certain regulatory effect on the intestinal microecological imbalance caused by CCl. These conclusions are in line with the results described by Liu Moon the effect of flaxseed on the change of intestinal flora.
4 Conclusion
By analyzing the effects of different ratios of linoleic acid/-linolenic acid complex on the diversity of liver cells and intestinal bacterial flora in mice with acute liver injury induced by CCl, we found that the linoleic acid/-linolenic acid complex exerts a certain preventive and regulatory effect on mice with acute liver injury, especially the linoleic acid/-linolenic acid 2:1 group. On one hand, the linoleic acid/-linolenic acid complex can reduce serum liver function indicators, protect hepatocytes from damage through autoimmunity, and reduce the production of cytokines; on the other hand, linoleic acid/-linolenic acid can reduce the toxic effect of CClon bacteria, regulate the structure and diversity of the flora, thereby minimizing liver damages. In addition,the health benefits of linoleic acid/-linolenic acid should also be related to dietary structure and nutrient composition,which is why the recommended intake of-6/-3 varies in different countries. For liver function defects and injuryrelated diseases, prevention and control are the key. Plantderived linoleic acid and-linolenic acid are not only inexpensive but also safe and without side effects. They have very promising application prospects in the development of new liver protection products.

