OpenNAU: An open-source platform for normalizing,analyzing,and visualizing cancer untargeted metabolomics data
Qingrong Sun ,Qingqing Xu ,Majie Wang ,Yongcheng Wang ,Dandan Zhang,3 ,Maode Lai,3,5
1Department of Pathology and Key Laboratory of Disease Proteomics of Zhejiang Province,Zhejiang University School of Medicine,Hangzhou 310058,China;2Liangzhu Laboratory,Zhejiang University Medical Center,Hangzhou 311121,China;3Alibaba-Zhejiang University Joint Research Center of Future Digital Healthcare,Hangzhou 310058,China;4Ningbo Kangning Hospital,Key Laboratory of Addiction Research of Zhejiang Province,Ningbo 315201,China;5 Department of Basic Medicine,School of Basic Medicine and Clinical Pharmacy,China Pharmaceutical University,Nanjing 211198,China
Abstract Objective: As an important part of metabolomics analysis,untargeted metabolomics has become a powerful tool in the study of tumor mechanisms and the discovery of metabolic markers with high-throughput spectrometric data which also poses great challenges to data analysis,from the extraction of raw data to the identification of differential metabolites.To date,a large number of analytical tools and processes have been developed and constructed to serve untargeted metabolomics research.The different selection of analytical tools and parameter settings lead to varied results of untargeted metabolomics data.Our goal is to establish an easily operated platform and obtain a repeatable analysis result.Methods: We used the R language basic environment to construct the preprocessing system of the original data and the LAMP (Linux+Apache+MySQL+PHP) architecture to build a cloud mass spectrum data analysis system.Results: An open-source analysis software for untargeted metabolomics data (openNAU) was constructed.It includes the extraction of raw mass data and quality control for the identification of differential metabolic ion peaks.A reference metabolomics database based on public databases was also constructed.Conclusions: A complete analysis system platform for untargeted metabolomics was established.This platform provides a complete template interface for the addition and updating of the analysis process,so we can finish complex analyses of untargeted metabolomics with simple human-computer interactions.The source code can be downloaded from https://github.com/zjuRong/openNAU.
Keywords: Untargeted metabolomics;LAMP architecture;shiny;normalization;reference metabolomics
Introduction
Untargeted analysis is a research method that conducts a high-throughput quantitative analysis of unknown metabolites by comparing the metabolites of a control group and an experimental group to find differences in their metabolic profiles (1).In the research process,untargeted metabolomics can be used for screening metabolites that exhibit differences in the disease development process,and then further qualitative and quantitative verification through targeted metabolomics can be used for early diagnosis and prognosis assessment.The main analytical techniques used for data collection are nuclear magnetic resonance (NMR),mass spectrometry(MS),chromatography,and spectroscopy. The complementary nature of analytical techniques solves the problem of the difference in the scope,composition,and nature of the tested samples (2,3). NMR,liquid chromatograph mass spectrometer (LC-MS) and gaschromatography-mass spectrometry (GC-MS) are the three most commonly used data acquisition techniques and have become the mainstream of metabolomics research.
The preprocessing and post-analysis of untargeted metabolomics data play an important role in metabolomics research.In the preprocessing of metabolomics data,isotopologue parameter optimization (IPO) (4),XCMS (5),CAMERA (6),Workflow4Metabolomics (7),and MetaboAnalyst (8) are needed as quantification tools of ion peaks.The main function of IPO is to optimize parameters in XCMS so that XCMS or CAMERA can retain valuable ion peak information as much as possible under optimized parameter settings.XCMS and CAMERA quantify the ion peaks of the raw data based on algorithms,but CAMERA is more valuable for labeling the composition of ions.The quantification matrix of ion peak intensity required by a study can be obtained through the above processing,and the missing values in the quantized ion peak can be filled based on MICE (9).After the preprocessed data are obtained,Normalyzer (10),Norm ISWSVR (11) and MSPrep (12) can be used for data correction and normalization,and finally,statistical analysis and model construction of normalized ion peak intensity differences can be carried out.
Surely,the optimization of parameters and quantification of ion peaks in the raw data extraction process have been recognized.There are many methods to ensure the quality control (QC) of ion intensity,but there are some differences.After the raw data pretreatment process,the correction of ion intensity is also important.Although many methods can be used to normalize data,there is no unified standard,so the normalized data which can lead to inconsistent analysis results.In addition,the data batch effect and instrument error are objective factors that affect the conclusions.Our goal is to strengthen the normalization of data QC,build a complete analysis process,and simplify the complex parameter setting and tool selection in the analysis process.
Materials and methods
Overall design
We built the whole analysis process based on the R programming language and LAMP (Linux+Apache+MySQL+PHP) architecture.The software consists of two subsystems: preprocessing of raw data (MetaQC) and Metabolomics Analysis and Resources Central (MARC)(Figure 1).MetaQC uses the Shiny (13) module in the R language to realize the visualization operation of the analysis process,and inserts the extraction and analysis program of raw data into the visualization operation process.MARC is based on a cloud server for data analysis and processing.This section is divided into the frontend,backend,and cloud analysis strategy.The front end is based on the bootstrap framework (www.bootcss.com) for the front-end layout and communication with the back-end.The back-end uses PHP for database access,file operation,and data transmission with the front-end.The cloud analysis strategy uses a socket as the interface to realize the call of cloud analysis software,the acquisition of tasks and the corresponding data analysis,and the analysis results through the intermediate log file for mutual result authentication and process identification.
The study was approved by the Clinical Research Ethics Committee of the First Affiliated Hospital,Zhejiang University School of Medicine.
Function design
We recommend using Agilent’s Masshunter Qualitative Analysis and DA Reprocessor software to create quantitative parameter files for raw data and convert bulk data.In the parameter file,the main parameter that needs to be customized is the ion intensity threshold setting.Here,we set it to 500-1,000.In this way,some noise ion peaks can be screened out.Finally,the raw data are converted into a readable format,and the size of exported files is checked to ensure that the file size is approximately 10 MB in Molecular Pathology Laboratory,Department of Pathology,Zhejiang University School of Medicine (not for all studies).In addition to above software,there is another open-source software ProteoWizard (14) that can complete this function.In this software,its main function“msconvert” can format data conversion of various types of original mass spectrum data,and set the corresponding threshold to the input data in mzXML format at the beginning of our entire platform through its parameter “--filter”.
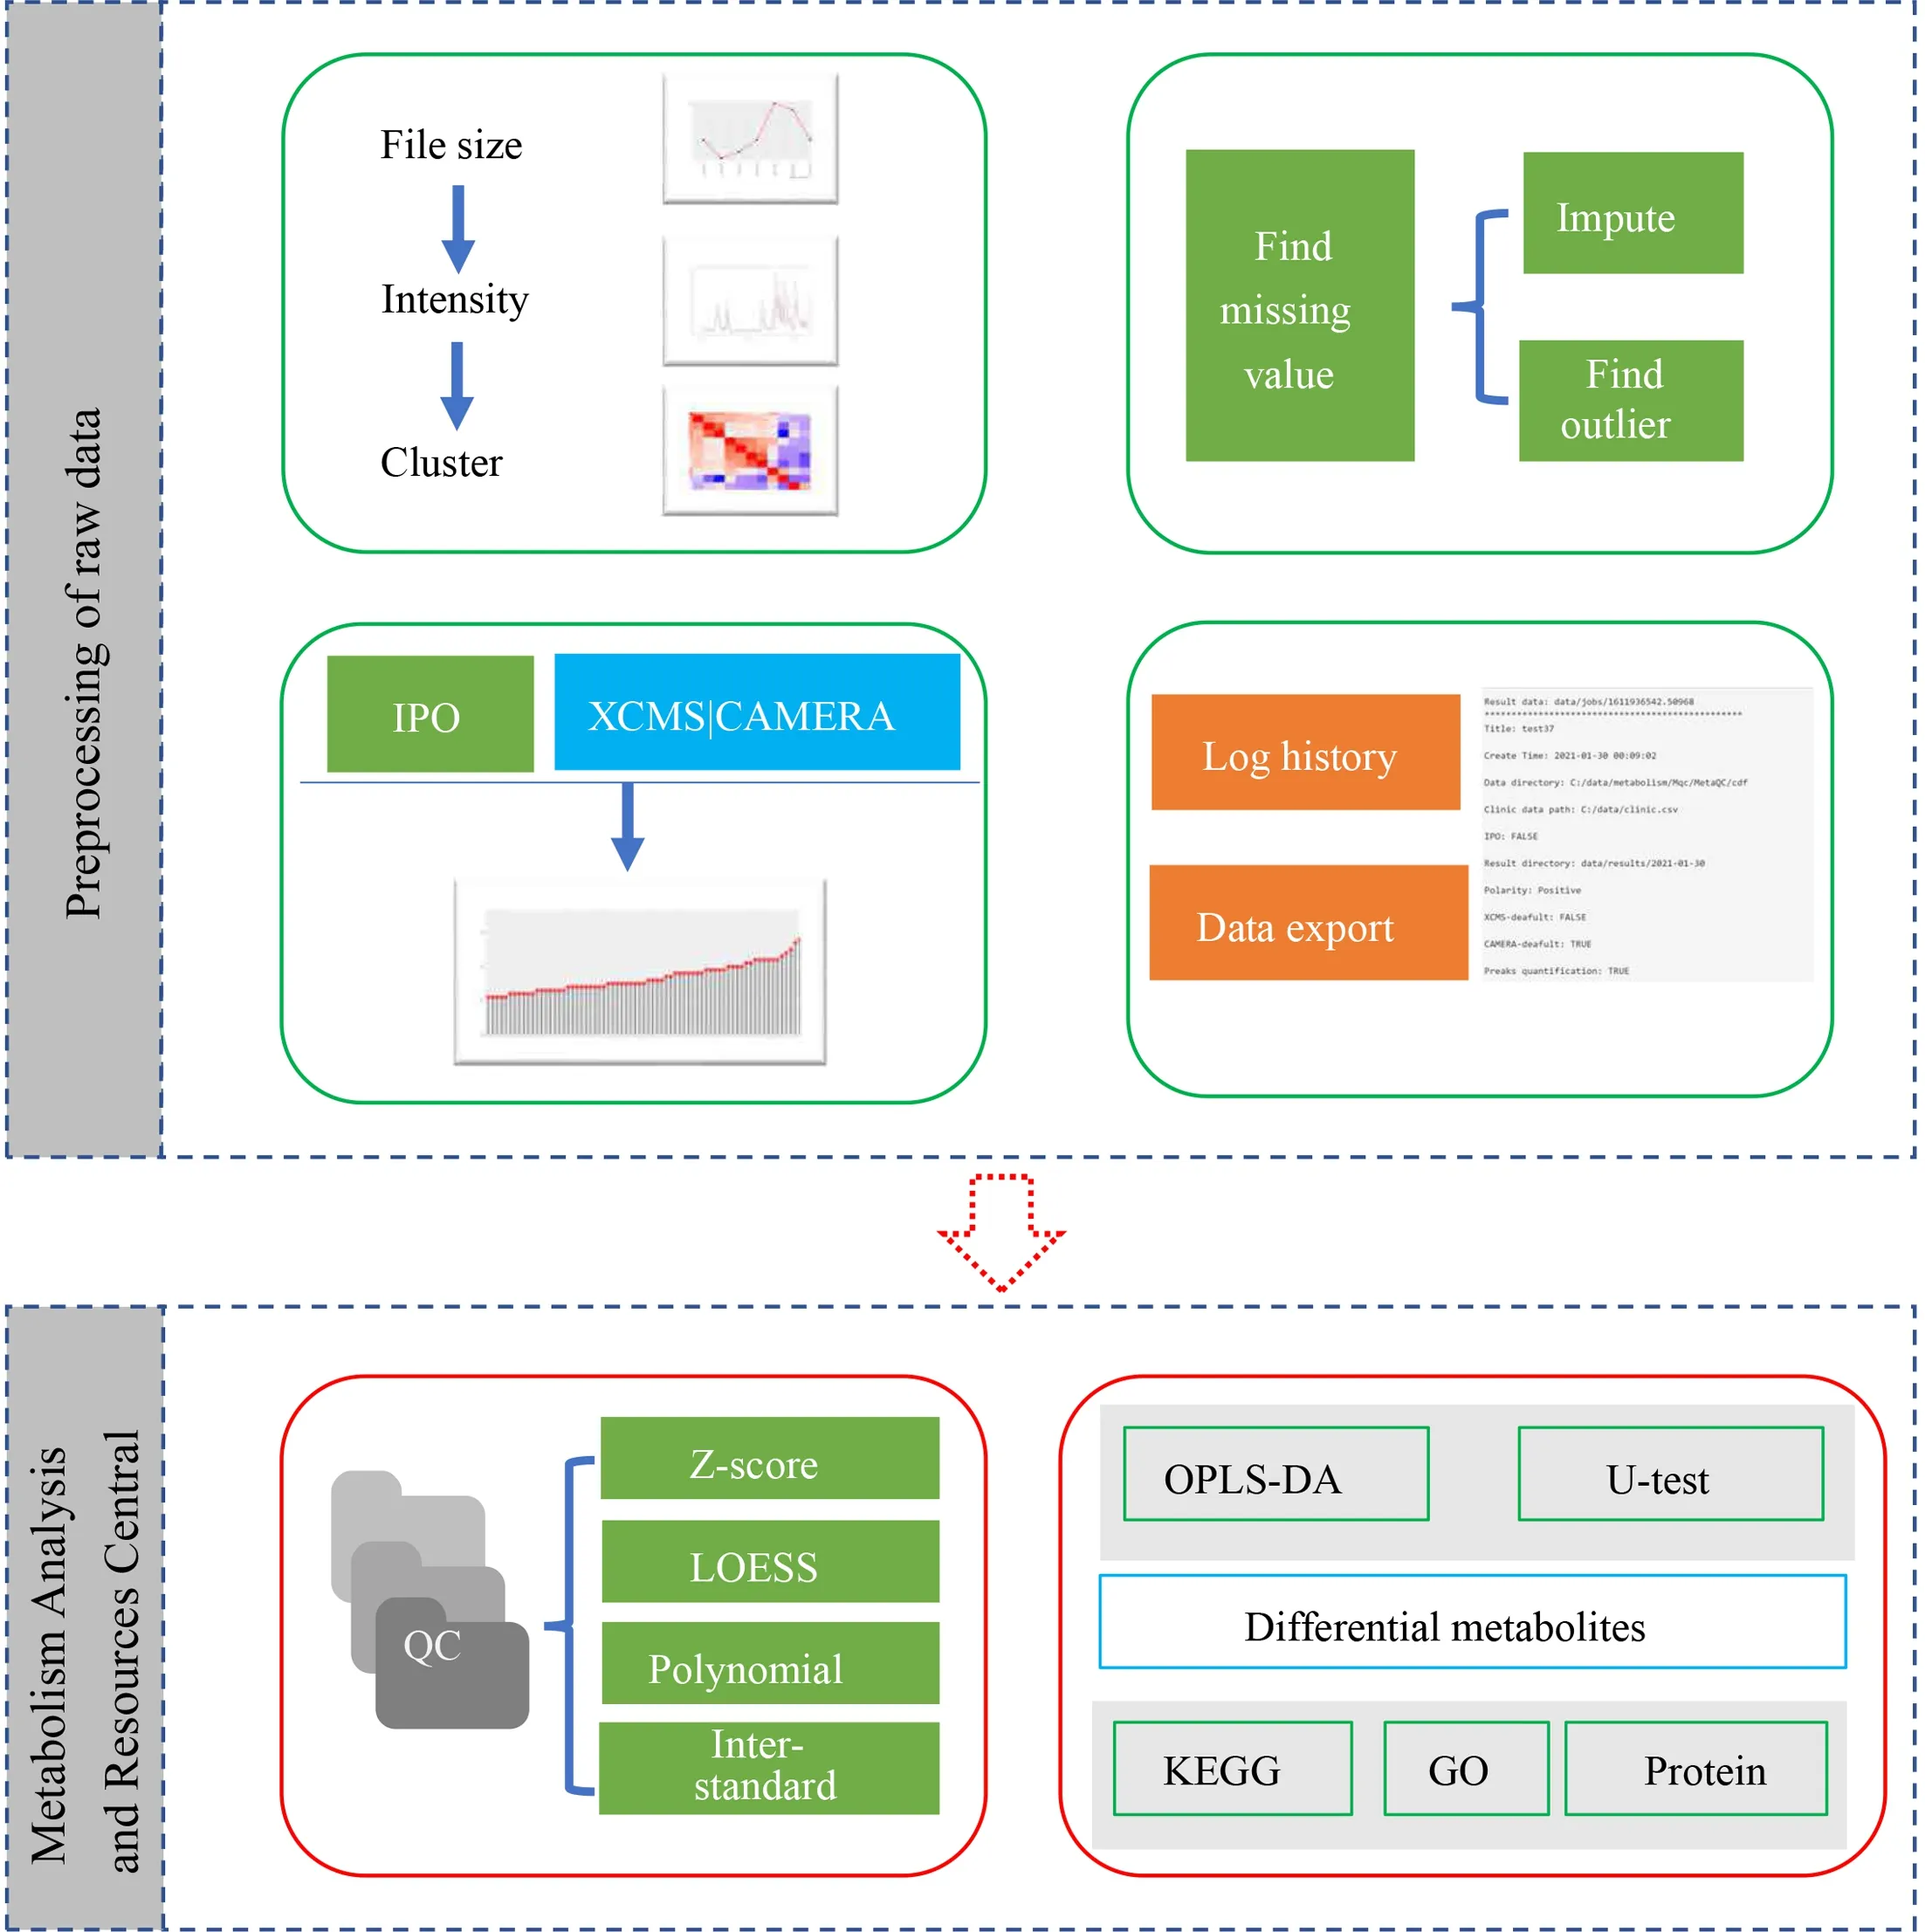
Figure 1 Workflow of software.IPO,isotopologue parameter optimization;QC,quality control sample;OPLS-DA,orthogonal partial least square discriminant analysis;KEGG,Kyoto Encyclopedia of Genes and Genomes;GO,Gene Ontology.
Parameter optimization and ion peak quantification
We used IPO software to optimize the parameters of the screened data.After obtaining the optimized parameters,we combined it with CAMERA or XCMS software for analysis.Of course,users can also directly use XCMS and CAMERA for quantification based on the parameters set in advance.In our software,the default parameters are FWHM=10,method= “obiwarp” and plotType=“deviation”. During IPO operation,optimization parameters will refine the default parameters and optimize the ion peak extraction method,retention time correction method,and ion peak grouping method (4).The selection of the ion peak extraction methods centWave and matchedFilter needs to be determined according to the research data.CentWave was selected for highresolution data,and matchedFilter was selected for lowresolution data.
QC and missing value filling
To ensure the quality of the samples and ion peaks,we utilized a custom R program and the mvoutlier (15)package.Firstly,the custom R program was used to remove missing data of ion peaks and samples.Our program eliminates samples with more than 50% ionic peaks having 0 intensity and ionic peaks more than 20% samples having 0 intensity.Subsequently,we performed multivariate outlier detection (16) on the resulting data using the mvoutlier software,and removed any abnormal samples.Finally,we used one of 6 alternative methods (17) based on the MICE package to fill in any remaining missing values.
Data normalization
This function conducts intrabatch and interbatch correction on quantified metabolic ionic peak data,which is beneficial for later data analysis.Firstly,the data are normalized based on internal standard ions to eliminate baseline differences between samples.Then,interbatch correction is performed based on QC samples.In our software,MetaboQC (18),surrogate variable analysis(SVA) (19),and a custom R program are used to normalize the quantized ion peak intensity data.
First,the data are normalized by using formulas 1),2),and 3) to eliminate the intragroup differences and intergroup differences and reduce the influence of outlier value.In the formulas,I(peakij) refers to the peak intensity of the i-th ion peak of the j-th sample;I(peakj) refers to the ion peak intensity value of the internal standard of the j-th sample;Mean(Qi) refers to the mean intensity of the i-th ion peak in all QC samples;standard deviation of the i-th ion in all QC samples [σ(Qi)];and minimum and maximum value of the i-th ion peak in all experimental samples[Min(peaki) and Max(peaki)].
Additionally,we utilized the polynomial correction function in MetaboQC software to adjust the data based on the QC sample trends.Furthermore,the SVA tool’s batch correction function can be applied to eliminate the batch effect on metabolic ion intensity values in expressed data.
Differential analysis
To perform a difference analysis of metabolic ions,a customized program and the ropls software package are required for comprehensive analysis.The results are then verified using orthogonal partial least square discriminant analysis (OPLS-DA) (20) and a custom program to obtain the final differential metabolic ionic peaks.The normalized ion peak data are analyzed using a Mann-Whitney U test or T-test analysis,and the output includes P value or adjusted P value (FDR).The default thresholds for significance are FDR<0.05 or P<0.05,Fold change >2 or <0.5,and variable importance in the projection (VIP) >1.
Metabolites identification
First,we constructed an integration of reference metabolomics (refMet) (21) database based on the human metabolome database (HMDB) (13),PubChem (22),the Small Molecule Pathway Database (SMPDB) (23),Metabolomics Workbench (24),EzCatDB (25),Reactome(26),AllCCS (27),PathBank (5),MassBank (28),NPAtlas(29),and MSigDB (30).Then we matched the different metabolic ions based on the refMet database.The charge of ions needs to be removed from the nucleo-mass ratio (m/z),and then the median m/z of ions needs to be set as the central value.Finally,the qualified metabolic ions in refMet were screened with ±10 ppm as the error range.Of course,this range can be adjusted as needed.In addition,there have been two difficult problems in the identification of metabolites,identities that show poor biological plausibility and do not comply with chromatographic data(31).Our refMet only combs and integrates data in terms of human metabolites.If it wants to be applied to more fields,users need to provide their own reference data set for this analysis process.
Pathway/Gene Ontology (GO) enrichment analysis
In this section,we constructed our metabolic pathway database based on refMet data.Additionally,we utilized clusterProfiler (32) to perform pathway enrichment analysis for the obtained differential metabolic ions or their target genes.The Gene Set Variation Analysis (GSVA) software(33) can be employed to score the pathway for the obtained differential metabolic ions and analyze the correlation between metabolic ions and pathways.
Statistics analysis
In this study,we use Mann-Whitney U test and T-test statistics methods.The default thresholds for significance are FDR<0.05 or P<0.05,fold change >2 or <0.5.
Results
The untargeted metabonomic analysis platform is divided into two modules: a localized data preprocessing module(Supplementary Figure S1A) and a cloud server module(Supplementary Figure S1B).Both modules realize visual distribution operation and visual display of results.Meanwhile,the two modules can be used for data application programming interface (API),increasing the utility of the tool.MARC data normalization is based on internal standard ions and/or QC samples and presented based on the framework inSupplementary Figure S1C.The overall changes in the mean values and standard deviation distribution before-and after-normalization are compared.In this module,we constructed a data normalization pipeline for experiments containing both internal standard ions and QC samples.We also constructed a data normalization pipeline for experiments containing only internal standard ions.Supplementary Figure S1Dshows the framework for the data analysis process and the statistical approach in each analysis node.In addition,we selected the data in faahKO (34) as an example for the preliminary test for MetaQC and completed the usage document (https://github.com/zjuRong/openNAU/blob/main/Document.pdf).Finally,the data from kidney cancer and colorectal cancer(CRC) samples in Molecular Pathology Laboratory,Department of Pathology,Zhejiang University School of Medicine were used for further verification.The cloud platform for MARC linked to http://39.171.241.18:8888/metabolism/.
MetaQC analysis for renal carcinoma blood samples
We collected data from 453 blood samples in Molecular Pathology Laboratory,Department of Pathology,Zhejiang University School of Medicine.Out of these samples,152 healthy control samples,36 QC samples,and 265 patients with renal carcinoma (RCC) before (n=154) and after(n=111) surgery.Using the MetaQC analysis,we first identified the change in peak intensity of all samples with retention time.The results showed that batch 18 samples exhibited significant enrichment,while other batches of samples showed varying degrees of fluctuation (Figure 2A).InFigure 2B,the clustering results of each batch in the heatmap revealed that multiple batched of samples were partly clustered,and the peak intensity of multiple batches of samples was clustered.These findings indicated that although there was no difference in peak intensity among batches,there were significant differences among samples from each batch.To identify the cause of the fluctuation that interferes with all of the data,we conducted an analysis based on the missing values of data samples and ion peaks and found that only one peak was seriously missing.We then imputed the missing data and found that there was no difference between before-imputation and after-imputation(Figure 2D).Additionally,we detected outliers and found that there were anomalies in many samples,with the two most obvious samples were X2241 and X2521 (Figure 2C).
Normalization processing of MARC based on RCC blood samples
Based on the above results,we can preliminarily determine that there are some issues with data.Therefore,we carry out data normalization processing using MARC to eliminate the noise in the data.Firstly,we normalized the QC data of the experiment using normalization pipeline 1 in MARC.We observed significant differences in QC data among the different groups (Figure 3G,Figure 4D).Additionally,we found that raw QC data were affected by the batch effect (Figure 3A) and only the Z-score method corrected the QC data with obvious noise removal (Figure 3C).Among other methods,QC data failed to be corrected by the internal standard ion (RC) (Figure 3B) and Single-Poly3 (Figure 3E) and was overcorrected by locally weighted smoothing (LOESS) (Figure 3D) and Single-Poly4 (Figure 3F). Finally,after evaluating all normalization methods,we found that although the Zscore method is relatively ideal for QC data correction,it shows great instability among samples as shown inFigure 3H.
To validate the accuracy of our normalization pipeline 1,we use normalization pipeline 2 to investigate whether the data could be normalized using machine learning algorithms.As shown inFigure 4,the raw data did not exhibit any clustering distribution between groups (Figure 4A),and the results obtained using the RC (Figure 4B) and SVA algorithms (Figure 4C) still did not adjust the difference distribution between groups.Additionally,we compared the raw-RC data with the RC data adjusted by the machine learning algorithm and found no significant differences between them (Figure 4E).Therefore,we concluded that there might be an experimental error in the raw experimental data,and further relevant analysis cannot be conducted.
Normalization processing of MARC based on CRC blood samples
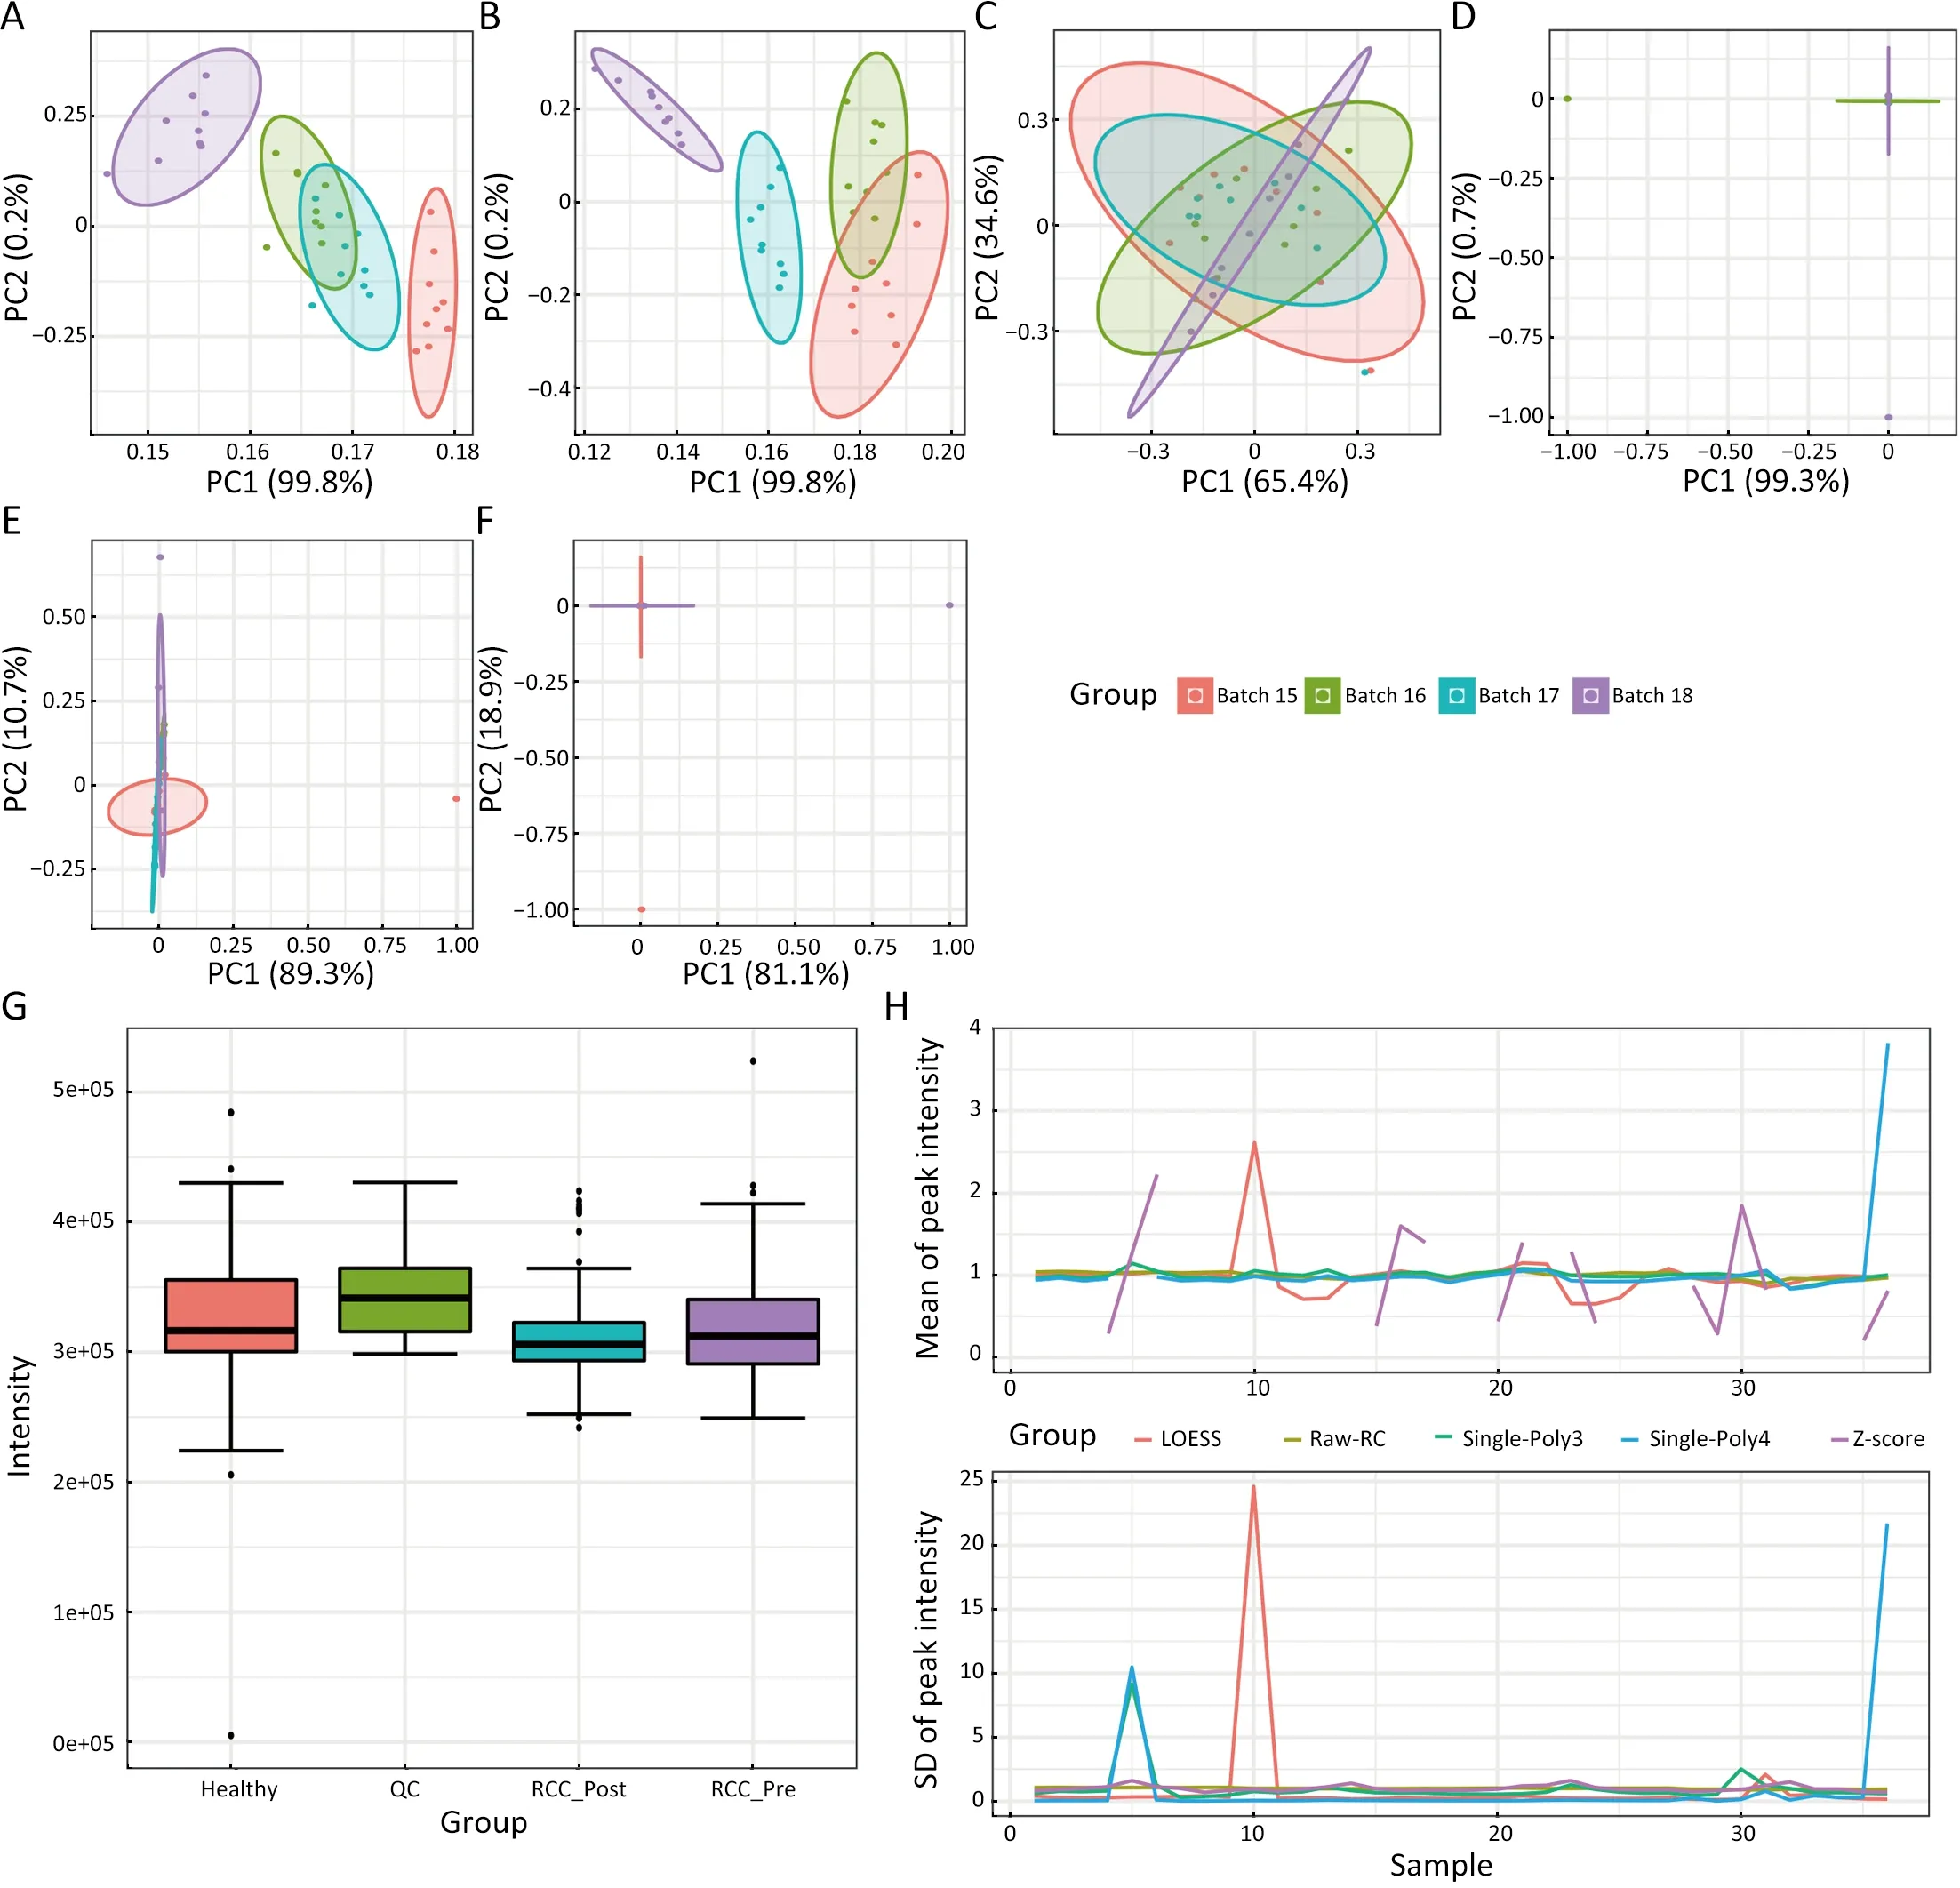
Figure 3 Normalization for QC data by normalization pipeline 1.A-F present the PCA results for QC data.(A) Raw QC data;(B) Mass intensity data adjusted by RC;(C) Mass intensity data was adjusted by QC based on Z-score;(D) Mass intensity data adjusted by QC based on LOESS;(E) Mass intensity data adjusted by QC based on Single-Poly3;(F) Mass intensity data adjusted by QC based on Single-Poly4;(G) RC peak intensity distribution by groups;(H) Comparison of all normalization methods.QC,quality control sample;PCA,principal component analysis;RC,reference compound (the internal standard ion).
The results mentioned above were from experimental data that we suspected to have issues.To further validate the problems with the RCC data,we repeated the normalization pipeline 2 using the previously published data (35) from Molecular Pathology Laboratory,Department of Pathology,Zhejiang University School of Medicine.We analyzed positive ion data from 120 patients with CRC and 120 healthy controls.As these data were only corrected based on RC,we presented only the analysis results of normalization pipeline 2.From the results,we observed no difference in RC between the two groups of data (Figure 5C).However,these data were clearly clustered into two groups of samples,which was consistent with our raw grouping (Figure 5A).To eliminate the influence of the batch,we performed normalization based on RC and SVA,which showed consistency with the raw data,indicating that batch also had little impact on the data(Figure 5B,C).Finally,we compared the raw data with the data processed by SVA,and found that the raw data were consistent with the normalized data (Figure 5D).
Differential metabolite analysis of MARC based on CRC samples
To ensure the consistency of our MARC analysis process with the previously published results,we conducted an indepth analysis of CRC data using analysis process 2,as depicted inFigure 6.In this process,we employed the Wilcoxon test (Figure 6A) and OPLS-DA (Figure 6B)methods to analyze differential metabolites between CRC and healthy samples and identified 98 peaks in both analyses (Figure 6C).To validate the reliability of our refMet database,we screened all databases to explore the metabolite distribution for these 98 differential ion peaks and found that MassBank and HMDB databases had more matched metabolites (Figure 6D).
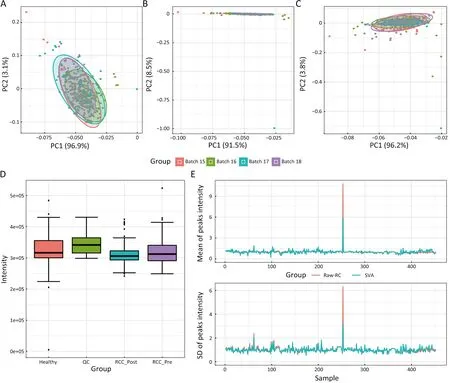
Figure 4 Normalization for RCC data using normalization pipeline 2.A-C present the PCA results for sample intensity data.(A) Raw sample data;(B) Sample data adjusted by RC;(C) Sample data mass intensity data adjusted by SVA;(D) RC peak intensity distribution by groups;(E) Comparison of all normalization methods.RCC,renal carcinoma;PCA,principal component analysis;RC,reference compound(the internal standard ion);SVA,surrogate variable analysis.
Comparation with other analysis software
In conclusion,we have summarized the existing related software and compared it with our software,which has eight advantages,including data upload,visual operation,cross-platform,localized configuration,analysis report construction,automatic process analysis,complete analysis strategy,and refMet database (Supplementary Table S1).However,the web browser’s limitation causes the upload of large files exceeds the wait time of the network,leading to interrupted uploading,which is a common limitation of many platforms on the sample size.In contrast,W4M has no restriction on data uploading due to the analysis platform built on the Galaxy platform (https://galaxyproject.org/).Visual operation facilitates more users to achieve metabolic data analysis with the mouse. Although numerous pieces of softwares deployed in the cloud can achieve visual operation,mzMatch/PeakML cannot.Crossplatform means that software is not limited by the operating system and hardware environment.Cloud-based software generally only supports a developer’s remote server environment.However,if the source code is open access,it can also be deployed locally to achieve crossplatform use,such as W4M.Local configuration refers to whether the software can be run on a user’s machine.Analysis report construction refers to whether the software can achieve a standardized report summary of data results.Automatic process analysis refers to whether the software can simplify operations and automate analysis,which is a beginner-friendly procedure without requiring complicated parameter settings.The complete analysis strategy refers to whether the analysis of untargeted metabolic data is a complete analysis process from the raw data to the differential metabolic ions,and there are corresponding analysis strategies for each analysis node.refMet refers to the common data set used in the identification of metabolic ions.The reliability of refMet plays an important role in later metabolite verification.FromSupplementary Table S1,we found that only MetaboAnalyst and openNAU had high functional consistency.
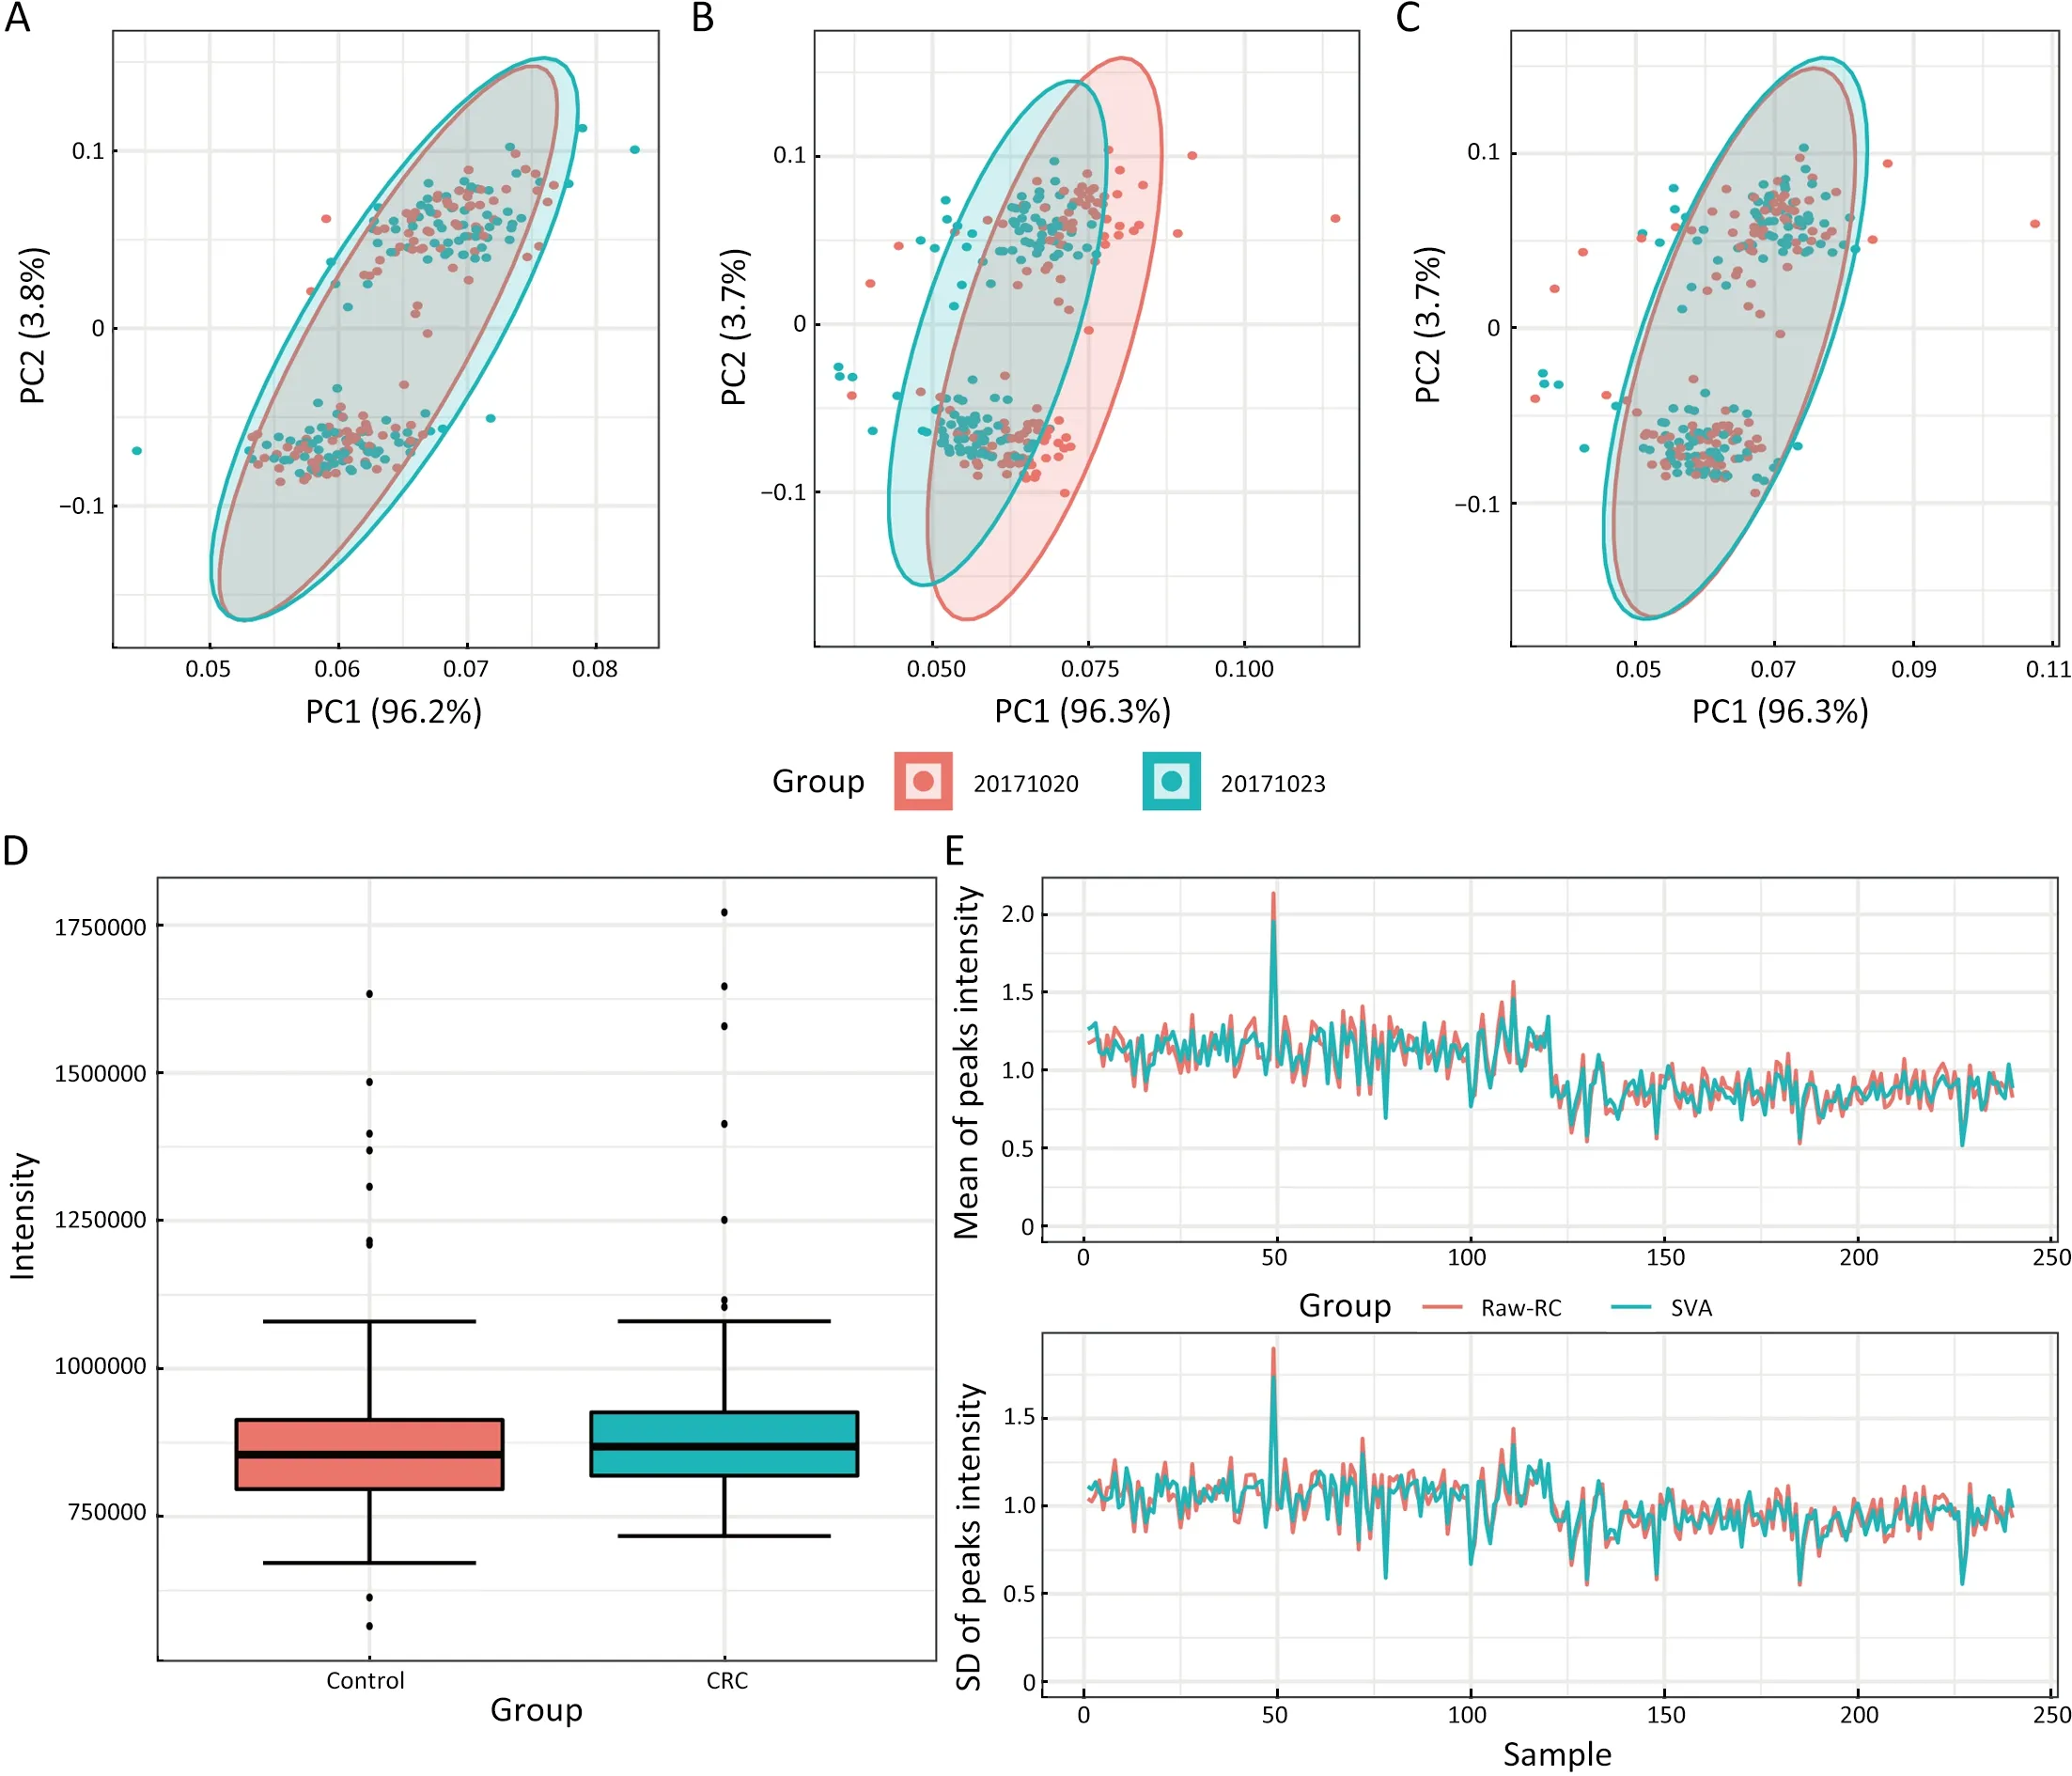
Figure 5 Normalization for CRC data by using normalization pipeline 2.A-C present the PCA results for sample intensity data.(A) Raw sample data;(B) Sample data adjusted by RC;(C) Sample data mass intensity data adjusted by SVA;(D) RC peak intensity distribution by groups;(E) Comparison of all normalization methods.CRC,colorectal cancer;PCA,principal component analysis;RC,reference compound (the internal standard ion);SVA,surrogate variable analysis.
To compare the differences between the two pieces of software,we uploaded raw peak intensity data and normalized peak data based on SVA of the CRC data to MetaboAnalyst 5.0 and performed functional analysis.Firstly,we used the data analysis strategy (Normalization by reference feature and Auto scaling) of MetaboAnalyst 5.0 to normalize CRC raw ion peak data.We compared the results before and after normalization.Then,we obtained the results (5 pathways and 104 peaks) of enrichment analysis (mummichog and GSEA,Supplementary Table S2)and differential metabolites based on normalized ion peak data.To compare the differences between our analysis strategies and MetaboAnalyst 5.0,we submitted our SVA normalized peak data without performing any normalization,which showed 3 enriched pathways(Supplementary Table S2) and 141 differential ion peaks.In openNAU,we found 98 different metabolic ion peaks enriched in 5 related pathways (Figure 6E).By comparing the above results,we found that the SVA data based on our analysis strategy cannot obtain meaningful results in MetaboAnalyst 5.0.Additionally,we performed pathway enrichment analysis based on 98 metabolic ions (positive ions,Figure 6E) and 61 differential metabolites [positive ions and negative ions,Supplementary Figure 1C(35)]identified by secondary MS between CRC and healthy samples.We found a high consistency for pathways,but only 3 consistent pathway results in MetaboAnalyst 5.0 pathway enrichment analysis.This also shows the reliability of our RefMet database and software.
Discussion
We have constructed an open-source complete analysis platform of untargeted metabolomics analysis that covers the entire process from raw data to differential metabolites.Due to the privacy and security of raw data in metabolomics research,we have divided the software into two parts: localization pretreatment module and cloud data analysis module.However,the localized module can also be directly deployed in the cloud to enable seamless integration with the cloud-based data analysis.Additionally,we have created an API for the MetaboAnalyst software that can directly convert our pre-processing results into its uploaded data format (https://www.metaboanalyst.ca/Meta boAnalyst/upload/PeakUploadView.xhtml).Our software starts with an analysis strategy,focuses on analysis process pipelines,integrates current untargeted metabolomicsrelated software and other omics-related tools,and provides users with analysis strategy and analysis process.From raw data extraction and QC to every analysis process,we offer a complete analysis strategy that simplifies the complex analysis process into simple visual human-machine communication.
Z-score is a normalization method for decentralization,which describes the relationship of value with the mean and standard deviation of a group of values.In our software,we normalized each ion of the experimental sample to obtain the Z-score based on the mean and standard deviation of the QC group.We found that even in experiment data of poor quality,raw peak data can be well-corrected using this method (Figure 3C).However,this method has certain limitations,as it cannot be scored without QC samples.We believe that this approach may be more general in normalizing untargeted metabolic data based on QC samples.
MS-DIAL software (36) has developed a complete metabolomic ion extraction and data analysis process.However,in the data normalization module,MS-DIAL only performed LOESS and internal standard ions elimination methods.Statistical analysis of MS-DIAL was performed based on EXCEL software macro (http://prime.psc.riken.jp/compms/others/main.html),including principal component analysis (PCA),projection to Latent Structure regression (PLS-R),and projection to latent structure based discriminant analysis (PLS-DA) analysis.We found that the normalized approach was too simple to cope with the growing number of complex metabolomics data,and the cost of Microsoft Office was not negligible.Meanwhile,the operating efficiency and operating environment of EXCEL software are limited by computer configuration and system.OpenNAU is based on the opensource R and PHP languages for the visual operation of untargeted metabolic data analysis,providing more space and cost savings for users to choose software.In addition,our enrichment analysis strategy is superior to MetaboAnalyst 5.0 in untargeted metabolomics analysis.
Our aim is to develop analysis process for various scenarios and present them in text form with summaries and annotations.By utilizing the label of each pipeline,we can create artificial intelligence that can generate complex analysis processes through simple human-machine communication (37).
However,the analysis process on our platform still has some limitations.In terms of computation time,the IPO software takes a considerable amount of time to optimize parameters,and the time required for preprocessing raw data increases exponentially with increase in data volume.To address this issue,we need to enhance the MetaQC module to expand the data types of untargeted metabolomics,refine ion extraction parameters,and increase individual operations for imported samples.Additionally,we have discovered that the recently released Norm ISWSVR package significantly improves the data quality of large-scale metabolomics data (11).We will overcome this shortcoming and add new analysis packages in the future.
Conclusions
Our study presents the openNAU software,a platform for evaluating and analyzing untargeted metabolic data.The software is designed to be user-friendly and features analytics processes at this core.Additionally,it effectively safeguards raw data and simplifies the process of untargeted metabolomics analysis.Furthermore,it not only includes a data quality assessment process but also provides the complete workflow for untargeted metabolomics analysis.
Acknowledgements
None.
Footnote
Conflicts of Interest: The authors have no conflicts of interest to declare.
 Chinese Journal of Cancer Research2023年5期
- Chinese Journal of Cancer Research的其它文章
- Genetic abnormalities assist in pathological diagnosis and EBVpositive cell density impact survival in Chinese angioimmunoblastic T-cell lymphoma patients
- Baseline radiologic features as predictors of efficacy in patients with pancreatic neuroendocrine tumors with liver metastases receiving surufatinib
- A novel multimodal prediction model based on DNA methylation biomarkers and low-dose computed tomography images for identifying early-stage lung cancer
- Genetic susceptibility loci of lung cancer are associated with malignant risk of pulmonary nodules and improve malignancy diagnosis based on CEA levels
- Update of latest data for combined therapy for esophageal cancer using radiotherapy and immunotherapy: A focus on efficacy,safety,and biomarkers
- Inspired by novel radiopharmaceuticals: Rush hour of nuclear medicine
