Application of UPLC-MS/MS for separation and quantification of 3α-Hydroxy Tibolone and comparative bioavailability of two Tibolone formulations in healthy volunteers
Vijay P.Shinde,Ashutosh Pudage,Arvind Jangid,Hiren Mistri,P.K.Patel
aKadi Sarva Vishvavidyalaya, Sarva Vidyalaya Campus, Sector 15/23, Gandhinagar, India
bAccutest Research Laboratories (I) Pvt. Ltd., Unit II, Opp. The Grand Bhagwati Hotel, S.G. Highway, Bodakdev,Ahmedabad 380059, India
cDepartment of Chemistry, M.G. Science Institute, Navrangpura, Ahmedabad 380009, India
1. Introduction
Tibolone substitutes for the loss of estrogen production in postmenopausal women and alleviates menopausal symptoms[1,2].It has estrogenic effects on the vagina, bone and the thermoregulatory centers in the brain (hot flushes) [3,4] and it is also used in the prevention of osteoporosis when intolerant of, or contraindicated for,other medical products approved for the prevention of osteoporosis.
After oral administration Tibolone is rapidly metabolized into three compounds [5] which contribute to the pharmacological effects of Tibolone. Two of these metabolites (3α-Hydroxy Tibolone and 3β-Hydroxy Tibolone) have predominantly an estrogenic effect [3,6,7]; a third metabolite (Δ4 isomer of Tibolone) and the parent compound have predominantly progestrogenic and androgenic activities [6,7]. Due to rapid metabolism,the plasma levels of Tibolone and Δ4 isomer of Tibolone are very low. As peak plasma levels of 3α-Hydroxy Tibolone are high it was monitored to determine the pharmacokinetic parameters [5].
Several methods have been reported on quantification of Tibolone with and without its metabolites in different biological matrices.Timmer et al. [5] applied gas chromatography—mass spectrometry(GC—MS)method described by Verhoeven et al.[8]for quantification of Tibolone and its metabolites in pharmacokinetic study of Tibolone in human plasma demonstrating LLOQ 0.100 ng/mL without any method validation details. Kang and Kim [9] developed solid phase extraction (SPE) GC—MS method for quantification of 3α-Hydroxy Tibolone and 3β-Hydroxy Tibolone in plasma with LLOQ 0.500 ng/mL.Verheul et al.[10]reported GC—MS method for quantification of Tibolone and its metabolites from monkey plasma (LLOQ 0.100 ng/mL) and urine (LLOQ 0.500 ng/mL) which involved a solid phase extraction followed by derivatisation of samples. The method applied was validated for human serum and some important experiments like matrix effect, hemolysis effect and relevant stabilities were not performed during validation.
Literature survey indicated wide use of GC—MS technique in analysis of Tibolone and its metabolites compared to liquid chromatography—mass spectrometry (LC—MS) or LC—MS/MS technique.Zacharia et al. [11] reported a need to employ the LC—MS method for quantification of Tibolone as in the GC—MS method Tibolone gets converted to 7α-methyl-ethinyl estradiol.Nevertheless,liquid chromatography coupled with atmospheric ionization mass spectrometry is a highly sensitive and selective technique compared to other techniques[12,13].Zuo et al.[14]reported an LC—MS method for quantification of 3α-Hydroxy Tibolone and 3β-Hydroxy Tibolone in human plasma.This method was quite time consuming because its long run time and high injection volume lead to column blockage after continuous injections. Use of high plasma volume requires more blood sample collection from volunteers and results in higher matrix effect during sample preparation. Some of the parameters like matrix effect,hemolysis effect, stability of analytes in plasma and solution form,incurred sample reanalysis were not discussed, which play an important role during bioanalysis.
In view of these limitations,it was important to develop and validate a rapid and reliable bioanalytical method for quantification of major Tibolone metabolite i.e.,3α-Hydroxy Tibolone in human plasma using LC—MS/MS which will be more selective and sensitive than earlier reported GC—MS and LC—MS methods. The present method developed has a run time of 5 min,which shows high throughput because of its ability to acquire large number of biological samples in a single day.Use of 0.500 mL plasma volume greatly reduces the matrix effect and improves the compliance of volunteers in process of blood sample collection. Less injection volume (10 μL) helps in retaining the chromatographic performance of column, for large number of injections and thus extends its lifetime.Usage of less mobile phase flow rate indicates the low solvent consumption. Deuterated IS helps in improving accuracy and precision of the method. The method developed was fully validated as per regulatory requirements and successfully applied to comparative bioavailability study of two tibolone formulations.
2. Experimental
2.1. Chemicals and reagents
3α-Hydroxy Tibolone and 3α-Hydroxy Tibolone-13CD3(IS) were provided by Toronto Research Chemicals Inc. (Lot Number 13-SHG-55-1 and 17-SHG-167-3 respectively).Acetonitrile and methanol(J.T.Baker,HPLC grade)were purchased from RFCL Limited,New Delhi,India. Ammonium acetate and p-toulenesulfonyl isocyanate (PTSI)were obtained from Sigma-ALDRICH Co., USA. Ethyl acetate was provided by s d FINE-CHEM Limited, Mumbai, India. Water was used from in-house MilliQ?Gradient A-10?system made in France.Plasma was obtained by centrifugation of blood treated with the anticoagulant K3EDTA.
2.2. Calibration standards and quality control samples
Stock and working solutions of 3α-Hydroxy Tibolone and 3α-Hydroxy Tibolone-13CD3were prepared in appropriate solvent.Calibration standards for 3α-Hydroxy Tibolone were prepared by spiking blank plasma with working solutions to obtain the final concentrations of 0.100, 0.200, 0.500, 2.500, 7.000, 14.000,21.000, 28.000, 35.000 ng/mL. Quality control samples were prepared in blank plasma at concentrations of 0.280 (quality control at low level,QCL),4.500(quality control at medium level one, QCM1), 12.500 (quality control at medium level two,QCM2), and 26.250 ng/mL (quality control at high level, QCH).The spiked plasma samples (standards and quality controls) were extracted in each batch of sample analysis.
2.3. Sample preparation
All frozen human plasma samples were initially thawed at room temperature. A 500 μL volume of human plasma sample was introduced into a tarsons centrifuge tube having conical bottom,followed by 25 μL of internal standard solution (160 ng/mL of 3α-Hydroxy Tibolone-13CD3). After vortexing for 30 s ethyl acetate was added(3 mL)to all the tubes and extraction was performed by shaking for 30 min on reciprocating shaker at 300/min shaking frequency.After shaking, all the samples were centrifuged at 3200 rpm at 10°C for 5 min.The upper organic layer was transferred to polypropylene tubes.Then samples were dried under nitrogen flux at 45°C for 20 min.Dried extract was reconstituted with 60 μL of acetonitrile. Samples were derivatized by addition of 50 μL of PTSI in acetonitrile and vortexing for 2 min. 100 μL of 2 mM ammonium acetate was added and vortexed for 30 s to stop the derivatization.
2.4. Chromatographic conditions
Derivatized samples(10 μL)were injected into an ACQUITY UPLC?BEH C18 1.7 μm(2.1 mm×100 mm)analytical column operating at 30°C. The compounds were eluted by pumping mobile phase,methanol (70%) and 2 mM ammonium acetate (30%) using binary pumps at a flow rate of 0.220 mL/min.The temperature of autosampler was kept at 5°C and the run time was 5 min.
2.5. Mass spectrometer conditions
MS detection was performed in the negative ESI mode on Waters Quattro Premier XE (MICROMASS?MS TECHNOLOGIES,UK) tandem mass spectrometer.
Source parameters and compound parameters were optimized during the infusion of derivatized product of 3α-Hydroxy Tibolone and 3α-Hydroxy Tibolone-13CD3through the interface connected with the Acquity UPLC System (Waters) and were as follows:Capillary,?4.20 kV;Extractor,?6.00 V;RF Lens,?0.1 V;source temperature, ?130°C; desolvation temperature, ?420°C; desolvation gas flow, ?1150 L/h; cone gas flow, ?10 L/h.
For 3α-Hydroxy Tibolone cone voltage was set at 50.00 V and collision energy at 32.00 eV,whereas for 3α-Hydroxy Tibolone-13CD3cone voltage was set at 47.00 V and collision energy at 31.00 eV.
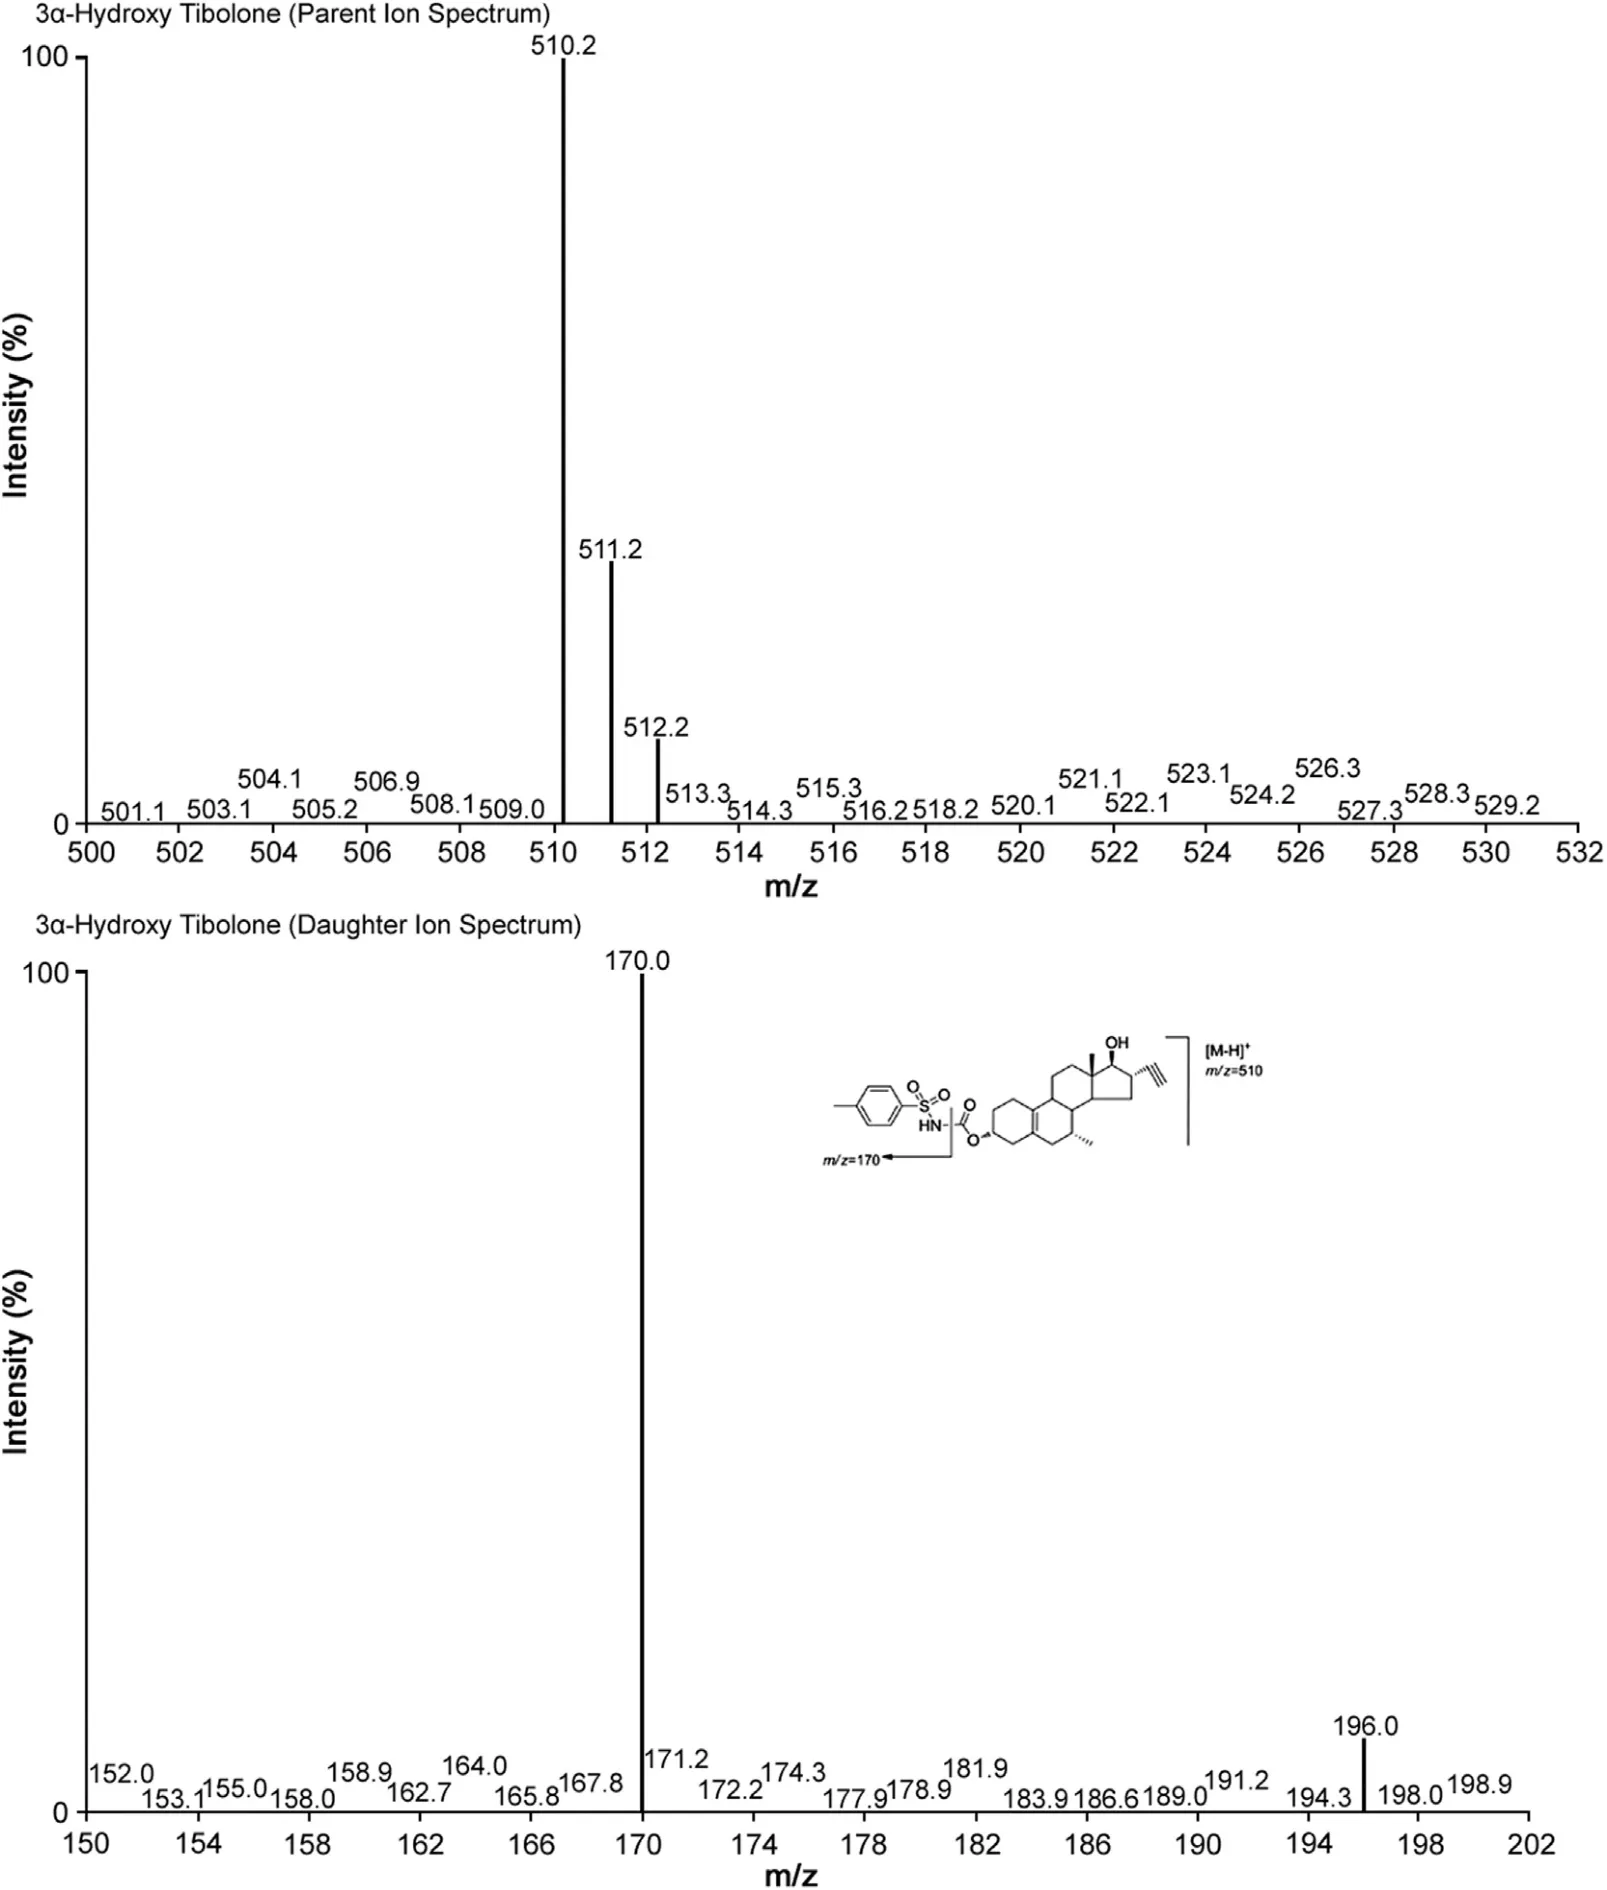
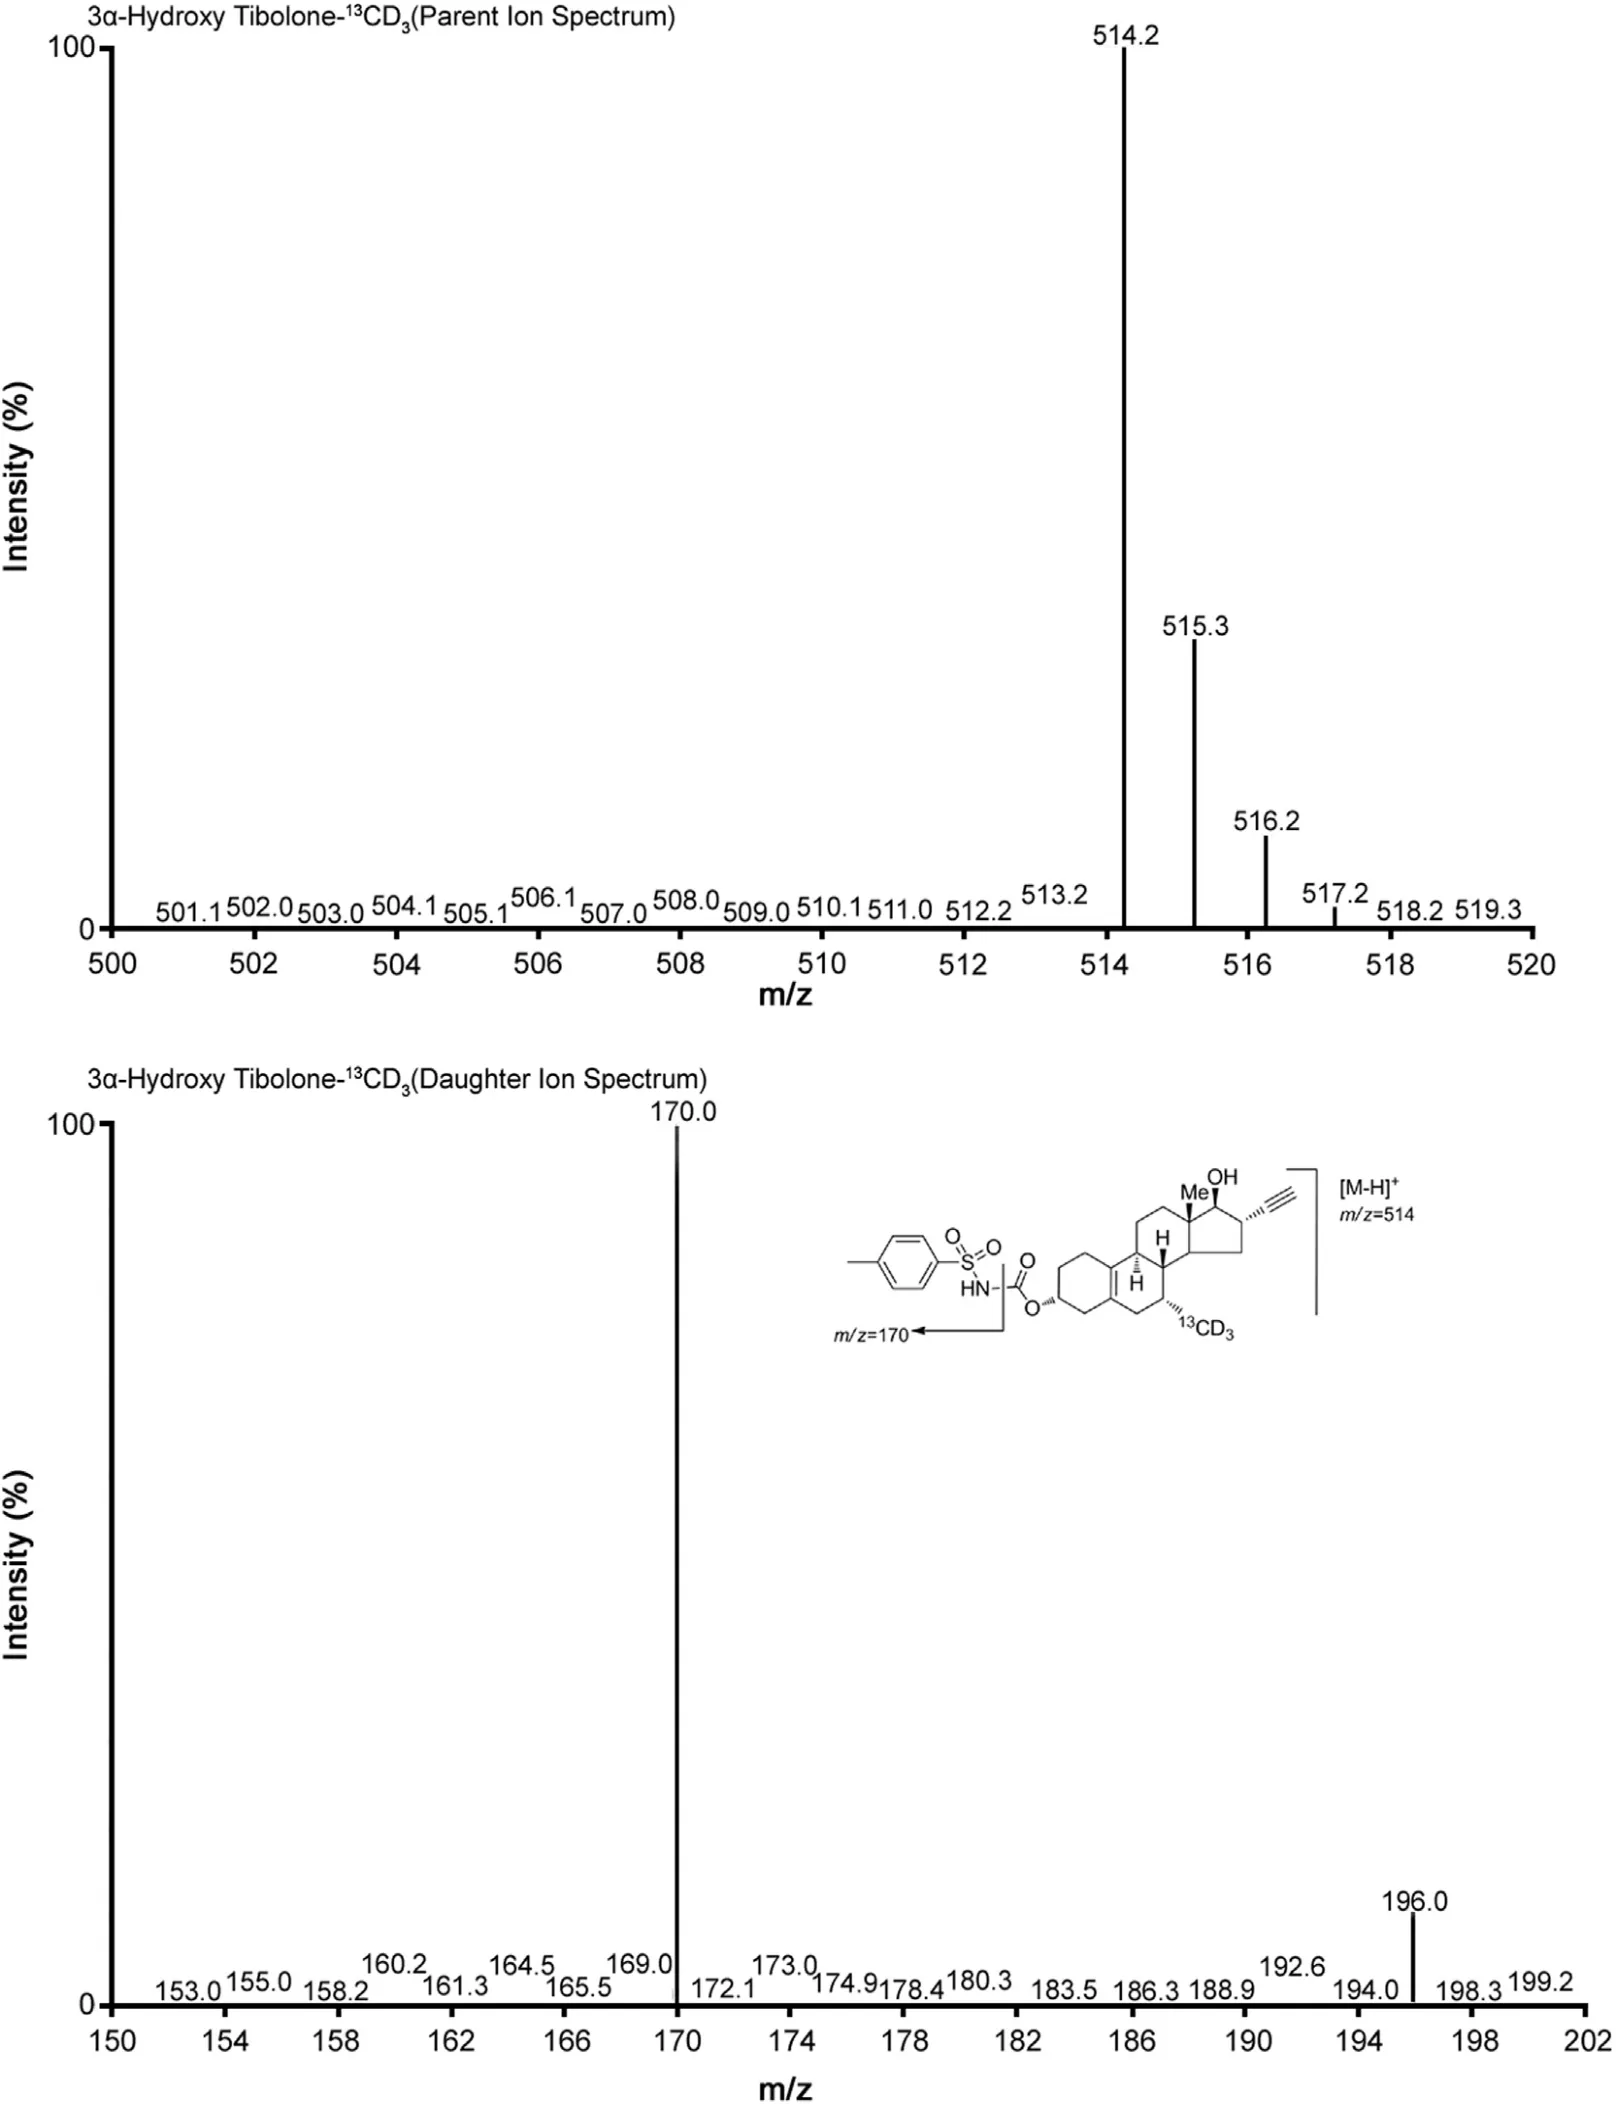
Multiple reaction monitoring(MRM)was used for the detection of 3α-Hydroxy Tibolone and 3α-Hydroxy Tibolone-13CD3.The m/z 510.2→170.0 (Fig.1) transition was monitored for 3α-Hydroxy Tibolone and the m/z 514.2→170.0 (Fig.2) transition for 3α-Hydroxy Tibolone-13CD3. Data acquisition and analysis were performed using the software MassLynx Version 4.1
2.6. Method validation
All sample analyses were carried out in a GLP-compliant manner and in accordance to the current Brazilian regulatory agency requirements, National Health Surveillance Agency (ANVISA)[15], and the US Food and Drug Administration Bioanalytical Method Validation guidance [16].
2.6.1. Linearity
The standard calibration curves were constructed using the peak area ratios of 3α-Hydroxy Tibolone and IS vs. 3α-Hydroxy Tibolone nominal concentrations of the nine plasma standards(0.100, 0.200, 0.500, 2.500, 7.000, 14.000, 21.000, 28.000,35.000 ng/mL). Linear regression with weighting factor 1/x2was performed to assess the linearity. In addition, a blank (non-spiked sample) and a zero plasma sample (only spiked with IS) were run to demonstrate the absence of interferences.
2.6.2. Recovery
The 3α-Hydroxy Tibolone recovery was evaluated by calculating the mean of the area ratio of the six replicates of each QCL(0.280 ng/mL), QCM1 (4.500 ng/mL), QCM2 (12.500 ng/mL),QCH (26.250 ng/mL) concentration and dividing the extracted sample mean area ratio by the unextracted (Aqueous sample)sample area ratio of the corresponding concentration.
2.6.3. Precision and accuracy
Precision and accuracy of the method were evaluated using three different batches of quality control sample at concentrations of 0.280, 4.500, 12.500, 26.250 ng/mL and also including the lowest limit of quantification (LLOQ), 0.100 ng/mL. Each batch was quantified with a specific calibration curve. For intra-batch assay precision and accuracy,six replicates of quality control samples at five concentration levels were assayed all at once within a day to obtain CV (%) and accuracy values. The inter-batch assay precision and accuracy were determined by analyzing mean values of quality control sample from three plasma batches to obtain the corresponding inter-batch CV(%) and accuracy values.
2.6.4. Sensitivity
The LLOQ was determined for 3α-Hydroxy Tibolone, based on two criteria:(a)the analyte response as LLOQ had to be at least five times base line noise and (b) the analyte response at LLOQ being determined with precision of ±20% and accuracy of 80—120%.
2.7. Matrix effect
It is either ion enhancement or suppression due to co-eluting matrix components at the retention time and MRM of the analyte and IS.Quantitative assessment of matrix effect provides useful information in validation of MS based bioanalytical methods.As it is not possible to completely eliminate the effect of matrix, the consistency (%CV) in matrix effect is checked in different plasma sources (relative matrix effect). The precision (%CV) should be ≤15% for the area ratio of analyte/IS at each level for relative matrix effect [17].
Ion suppression/enhancement effects on the MRM LC—MS/MS sensitivity can be checked by the post-column analyte infusion experiment.A standard solution of analyte(at MQC level)is to be infused post-column via a ‘T' connector into the mobile phase at 10 μL/min and aliquot of extracted control plasma is then injected into the column by the autosampler and MRM LC—MS/MS chromatogram is to be acquired for analyte. Any dip in the baseline upon injection of double blank plasma (without IS)indicates ion suppression, while a peak at the retention time of analyte indicates ion enhancement. Absolute matrix effect (ME)was assessed by comparing the mean area ratio response of unextracted samples (spiked after extraction) with mean area of neat standard solutions (in mobile phase).
2.8. Hemolysis effect
It was performed to assess the impact of hemolysed human plasma on the accuracy and precision of the assay. Six replicates of QCL and QCH were prepared in hemolysed plasma and analyzed against calibration curve spiked in normal plasma.
2.9. Stability

Fig.1 Parent ion spectra (upper trace) and product ion spectra (lower trace) of 3α-Hydroxy Tibolone.
All stability tests of 3α-Hydroxy Tibolone were performed in human plasma using six replicates of plasma spiked with 3α-Hydroxy Tibolone at QCL and QCH levels except for stock solution stability that was performed at aqueous QCM2 level.Type of stabilities included freeze—thaw stability (5 cycles at?70°C), bench top stability (room temperature), autosampler stability (5°C), dry extract stability (2—8°C), long term storage stability in plasma (?70°C), and stock solution stability (room temperature)
2.10. Pharmacokinetics and statistical analysis.
The analytical method developed here was applied to evaluate comparatively the 3α-Hydroxy Tibolone plasma concentration from two formulations of Tibolone tablet 2.5 mg, in normal,healthy,adult,post-menopausal/surgical menopause female human subjects under fasting conditions.
Fifty healthy female volunteers were selected for study after assessment of their health status by clinical evaluation (physical examination, ECG) and routine laboratory tests. Bioequivalence between the two formulations was assessed by calculating individual test/reference ratios for the peak of concentration(Cmax), area under the curve (AUC) of plasma concentration until the last concentration observed (AUClast) and the area under the curve between the first sample (pre-dose) and the infinite sample(AUC0-inf).
Cmaxand the time taken to achieve this concentration (tmax)were obtained directly from the curves. The areas under the 3α-Hydroxy Tibolone plasma concentration vs.time curves from zero to the last detectable concentration (AUClast) were calculated by applying the linear trapezoid rule. Statistical calculations were defined at the level of p≤0.05 and bioequivalence for the two formulations was concluded as the 90.0% confidence interval of 3α-Hydroxy Tibolone falls within the acceptable range of 80.00—125.00% for Cmax, AUC0-tand AUC0-inf, defined by both the US Food and Drug Administration (FDA) [18,19] and the National Sanitary Surveillance Agency (ANVISA) [15]. The software used for statistical analysis was SAS software version 9.2.

Fig.2 Parent ion spectra (upper trace) and product ion spectra (lower trace) of 3α-Hydroxy Tibolone-13CD3.
2.11. Incurred sample reanalysis
The assay reproducibility was demonstrated by reanalysis of 5%of total subject samples on completion of subject sample analysis and difference between initial and repeated concentration was found to be within ±15%.
3. Results and discussion
3.1. Method development
The goal of this work was to develop and validate a simple,rapid,selective and sensitive method for the quantitative determination of 3α-Hydroxy Tibolone in plasma samples. For this MS optimization was done by direct infusion of derivatized products of 3α-Hydroxy Tibolone and its deuterated IS. For detection MRM was generated for the analyte and IS as it is more selective, sensitive and reliable than SIM mode detection [20].
PTSI was used as derivatizing reagent to improve the analyte sensitivity in negative ESI mode [14]. The concentration of PTSI also plays an important role in derivatization and it was observed that the concentration of PTSI reported by Zuo et al. [14] for derivatization did not give the desired product.It was optimized to 1% PTSI in acetonitrile to get the desired derivatized product and the amount to be added in each sample was also optimized to 50 μL to get the best result in terms of sensitivity. The solvent used for preparation of stock solution and working solution is important as it is observed that the solvent containing OH group does not allow the derivatization process due to strong affinity of PTSI towards OH group. Therefore, stock and working solutions of analyte and IS were prepared in pure acetonitrile.
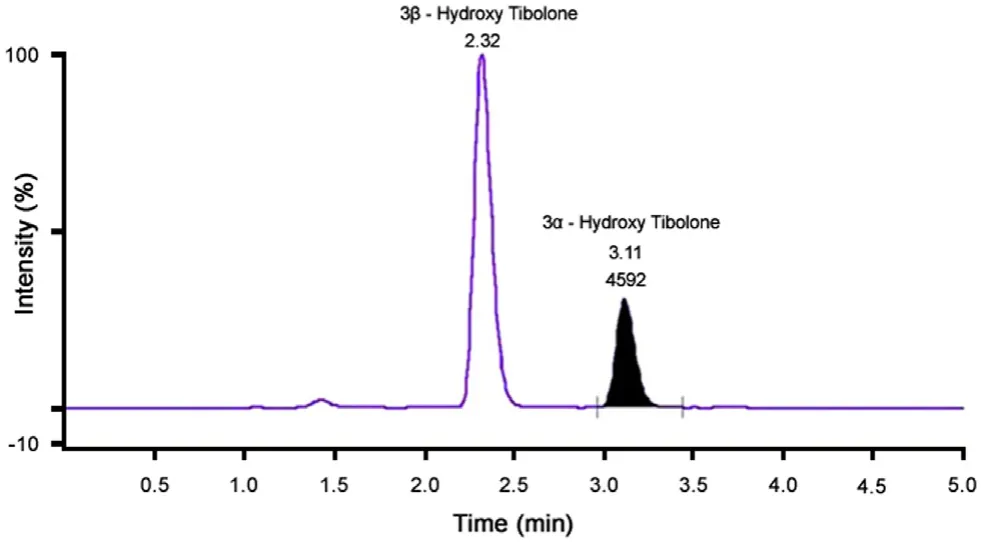
Chromatographic conditions, especially the composition of the mobile phase and selection of suitable column, were optimized through several trials to achieve the best resolution and highest signals of analyte and IS. Separation science was revolutionized with the introduction of UPLC and the use of acquity column with 1.7 μm particle size enabled us to achieve the best resolution,speed and sensitivity during the analysis. Two stereoisomers 3α-Hydroxy Tibolone and 3β-Hydroxy Tibolone were separated using analytical column ACQUITY UPLC?BEH C18 1.7 μm(2.1 mm×100 mm). Fig.3 shows actual separation of two metabolites in subject sample.
Liquid—liquid extraction method was optimized for the extraction of analyte and IS from plasma samples. Addition of 2 mM ammonium acetate to stop the derivatization instead of water also helps to get the maximum sensitivity at LLOQ level. The UPLC—MS/MS method described here for drug quantification and separation is in accordance with National Sanitary Surveillance Agency (ANVISA) [15] and US Food and Drug Administration requirements [16].
3.2. Linearity and selectivity
The simplest regression method for the calibration curves of 3α-Hydroxy Tibolone was Y=mX+C from 0.100 to 35.000 ng/mL.Correlation coefficient ranged from 0.9993 to 0.9997. The LLOQ was 0.100 ng/mL. The chromatograms obtained from the LLOQ and extracted blank plasma are presented in Figs. 4 and 5. 3α-Hydroxy Tibolone and IS retention times were around 3.2±0.5 min and 3.1±0.5 min respectively. The signal to noise ratio was higher than 6. In the case of 3α-Hydroxy Tibolone and its IS, no significant interference was obtained at their respective retention times when six different lots of normal blank human plasma, two different lots each of hemolysed and lipemic blank human plasma with K3-EDTA as an anticoagulant were processed and evaluated against six extracted LLOQ samples. Furthermore,blank plasma samples from all volunteers were run before unknown concentration sample quantification showing a clear chromatogram in all cases.

Fig.3 Chromatogram showing the separation of two metabolites in actual subject sample.

Fig.4 MRM chromatograms of(A)blank normal human plasma and(B) 3α-Hydroxy Tibolone at LOQ concentration (0.100 ng/mL).

Fig.5 MRM chromatograms of(A)blank normal human plasma and(B) 3α-Hydroxy Tibolone-13CD3.
3.3. Recovery
Absolute recoveries were evaluated for 3α-Hydroxy Tibolone and its IS in terms of peak area ratio. Recovery (%) and % CV for QCL, QCM1, QCM2, and QCH were as follows: 89.20 and 6.34,95.29 and 1.93, 97.16 and 2.22, 94.78 and 1.98, respectively.
3.4. Accuracy and precision
Intra-batch precision and accuracy of the assay were measured for 3α-Hydroxy Tibolone at each QC level (0.280, 4.500, 12.500,26.250 ng/mL). Calculated inter-batch precision and accuracy of the method ranged from 1.94% to 5.78% and 98.93% to 101.55%respectively as presented in Table 1.These results were within the acceptance criteria for precision and accuracy i.e.,deviation values within ±15% of the nominal values, except for LLOQ which could show a ±20% deviation. The LLOQ was validated as 0.100 ng/mL, showing intra-batch precision and accuracy of the method as 10.83% and 94.00% respectively.
3.5. Matrix effect
The relative matrix effect was checked and %CV was 1.92 at LQC and 0.49 at HQC level. As the precision is within the acceptance criteria,it is concluded that the matrix effect is consistent and precise.
3.6. Hemolysis effect
The precision and accuracy of quality control samples at QCL and QCH levels were found to be within acceptance criteria; hence it was concluded that hemolysis effect is absent.
3.7. Stability of 3α-Hydroxy Tibolone
The stability test of 3α-Hydroxy Tibolone in human plasma showed no significant degradation, when kept on bench at room temperature for 9 h before processing. The percentage difference for low and high QC samples was 3.10 and ?1.58 respectively.For five freeze—thaw cycles it was ?5.72 and ?9.11. Extracted samples of 3α-Hydroxy Tibolone were stable for 56 h when kept in autosampler at 5°C and the percentage difference for QCL and QCH was 1.47 and ?4.51 respectively. Dry extracted samples were stable for 28 h at 2—8°C and the percentage difference was?8.97 and ?13.96 for QCL and QCH respectively.
Stock solution of 3α-Hydroxy Tibolone was found to be stable for 23 h at room temperature and the percentage difference was 2.57, whereas it was stable for 10 days at 2—8°C and the percentage difference was ?1.81.These stability experiments were performed at medium QC level. 3α-Hydroxy Tibolone was stable in plasma at ?70°C for 126 days.
3.8. Comparative pharmacokinetic parameters
A total of 50 volunteers finished the study. Table 2 shows the values of pharmacokinetic parameters of both formulations (test and reference formulations).
4. Conclusion
This work describes a fast,sensitive and robust method to quantify 3α-Hydroxy Tibolone in human plasma using 3α-Hydroxy Tibolone-13CD3as an internal standard. Extracted samples were analyzed by UPLC—ESI-MS/MS. This method agrees with the requirements proposed by the US Food and Drug Administrationand ANVISA of high sensitivity, selectivity and high sample throughput in comparative pharmacokinetic assays such as bioequivalence studies. The lowest concentration quantified was 0.100 ng/mL with suitable accuracy and precision. The intraassay precision ranged from 1.27% to 10.83% while inter-assay precision ranged from 1.94% to 12.50%. The intra-assay accuracy ranged from 94.00% to 102.83% while inter-assay accuracy ranged from 98.93% to 103.00%. The described method for separation and quantification of 3α-Hydroxy Tibolone in human plasma was successfully applied in bioequivalence study of two 2.5 mg Tibolone tablet formulations using an open, randomized,two-period, cross-over design.

Table 1 Accuracy and precision data for 3α-Hydroxy Tibolone quantification in human plasma.

Table 2 Arithmetic mean pharmacokinetic parameters obtained from 50 volunteers after administration of each of 2.5 mg Tibolone tablet formulation.
The author is thankful to Dr. Satish Sawant and Dr. Nirav Gandhi for providing state of art laboratory facility and their co-operation during the research work.The author would also like to express his gratitude to Ahmedabad Education Society and Principal of M.G. Science Institute for providing Library facility to carry out the research work.
[1] P.Albertazzi,R.Di Micco,E.Zanavdi,Tibolone:a review,Maturitas 30 (1998) 295—305.
[2] R.A. Moore, Livial: a review of clinical studies, Br. J. Obstet.Gynaecol. 106 (Supplement 19) (1999) S1—S21.
[3] H.J. Kloosterboer, G.H. Ederveen, Tibolone: a steroid with a tissuespecific mode of action, J. Steroid Biochem. Mol. Biol. 83 (2003)157—165.
[4] C.L. Smith, B.W. O'Malley, Coregulator function: a key to understanding tissue specificity of selective receptive modulators, Endocr.Rev. 25 (2004) 45—71.
[5] C.J. Timmer, H.A.M. Verheul, D.P. Doorstam, Pharmacokinetics of Tibolone in early and late post-menopausal woman, Br. J. Clin.Pharmacol. 54 (2002) 101—106.
[6] H.J. Kloosterboer, Tibolone: a steroid with a tissue-specific mode of action, J. Steroid Biochem. Mol. Biol. 76 (2001) 231—238.
[7] M.E. de Gooyer, H. deckers, W.G.E.J. Schoonen, et al., Receptor profiling and endocrine interactions of tibololne, Steroids 68 (2003)21—30.
[8] C.H.J. Verhoeven, R.M.E. Vos, L.P.C. Delbressine, The in vivo metabolism of Tibolone in animal species, Eur. J. Drug Metab.Pharmacokinet. 27 (2002) 1—10.
[9] K.W. Kang, Y.G. Kim, Bioequivalence studies of Tibolone in premenopausal women and effects on expression of the Tibolonemetabolizing AKR1C (aldo-keto reductase) family caused by estradiol, J. Clin. Pharmacol. 48 (2008) 1430—1437.
[10] H.A.M. Verheul, C.J. Timmer, M.L.P.S. Van lersel, et al., Pharmacokinetics parameters of Tibolone and its metabolites in plasma,urine, faces and bile from ovariectomizes cynomolgus monkeys after a single dose or multiple doses of Tibolone, Drug Metab. Dispos. 35(7) (2007) 1112—1118.
[11] L.C. Zacharia, E.K. Jacjson, H.J. Kloosterboer, et al., Conversion of Tibolone to 7α-methyl-ethinyl estradiol using gas-chromatography—mass spectrometry and liquid chromatography—mass spectrometry:interpretation and clinical implications, Menopause 13 (2006) 926—934.
[12] K.Shimada,K.Mitamura,T.Higashi,Gas chromatography and highperformance liquid chromatography of natural steroids, J. Chromatogr. A 935 (2001) 141—172.
[13] W.F. Smyth, Electrospray ionisation mass spectrometric behaviour of selected drugs and their metabolites,Anal. Chim.Acta 492(2003)1—16.
[14] M. Zuo, M.J. Gao, Z. Liu, et al., p-Toluenesulfonyl isocyanate as a novel derivatization reagent to enhance the electrospray ionization and its application in the determination of two stereoisomers of 3-hydroxyl-7-methylnorethynodrel in plasma,J.Chromatogr.B Anal.Technol. Biomed. Life Sci 814 (2005) 331—337.
[15] National Health Surveillance Agency (ANVISA) Guide for Validation of Analytical and Bioanalytical Methods Resolution-RE n.899.Available from: 〈http://www.anvisa.gov.br〉, May 2003.
[16] Guidance for Industry:Bioanalytical Method Validation,U.S.Department of Health and Human Services, Food and Drug Administration,Centre for Drug Evaluation and Research (CDER). Available from:〈http://www.fda.gov/cder/guidance/index.htm〉, May 2001.
[17] B.K. Matuszewski, M.L. Constanzer, C.M. Chavez-Eng, Strategies for the assessment of matrix effect in quantitative bioanalytical methods based on HPLC—MS/MS, Anal. Chem. 75 (2003)3019—3030.
[18] Guidance for Industry: Food-effect Bioavailability and Fed bioequivalence Studies, U.S. Department of Health and Human Services,Food and Drug Administration, Centre for Drug Evaluation and Research (CDER). Available from: 〈http://www.fda.gov/cder/gui dance/index.htm〉, December 2002.
[19] Guidance for Industry: Bioavailability and Fed bioequivalence Studies for Orally Administered Drug Products-General Considerations, U.S. Department of Health and Human Services, Food and Drug Administration, Centre for Drug Evaluation and Research(CDER). Available from: 〈http://www.fda.gov/cder/guidance/index.htm〉, March 2003.
[20] V.K. Karra, N.R. Pilli, J.K. Inamadugu, et al., Simultaneous determination of pioglitazone and candesartan in human plasma by LC—MS/MS and its application to a human pharmacokinetic study,J. Pharm. Anal. 2 (2012) 167—173.
 Journal of Pharmaceutical Analysis2013年4期
- Journal of Pharmaceutical Analysis的其它文章
- LC-MS/MS determination and pharmacokinetic study of bergenin, the main bioactive component of Bergenia purpurascens after oral administration in rats
- Characterization of phloroglucinol derivatives and diterpenes in Euphorbia ebracteolata Hayata by utilizing ultra-performance liquid chromatography/quadrupole time-of-flight mass spectrometry
- Application of analytical instruments in pharmaceutical analysis
- Investigation of the interaction between indigotin and two serum albumins by spectroscopic approaches
- In vitro antibacterial and free radical scavenging activity of green hull of Juglans regia
- Ultra-high-performance liquid chromatography for the determination of exenatide in monkey plasma by tandem quadrupole mass spectrometry
