多元醇法合成具有不同長(zhǎng)徑比的棒狀LiFePO4/C材料
2014-10-18 05:27:36胡有坤任建新魏巧玲郭孝東鐘本和
物理化學(xué)學(xué)報(bào) 2014年1期
胡有坤 任建新 魏巧玲,3 郭孝東,* 唐 艷 鐘本和 劉 恒
(1四川大學(xué)化學(xué)工程學(xué)院,成都 610065;2四川大學(xué)材料科學(xué)與工程學(xué)院,成都 610064;3清華大學(xué)化工系,北京 100084)
1 Introduction
Olivine-type LiFePO4has recently attracted a great deal of attentions due to its relatively high theoretical capacity of 170 mAh·g-1,low cost,thermal stability.and environmental benign.However,olivine LiFePO4has a low electronic conductivity and a low lithium-ion diffusion coefficient(~1.8×10⁻¹⁴cm2·s-1),1-3which are the limitations of LiFePO4to be used in large scales.The previous progressive efforts have devoted to overcoming this obstacle by doping various metals,4,5minimizing the particle size,6,7coating carbon on particle surface,8,9and customizing particle morphologies.10-13
Nano-sized materials have high discharge capacity probably due to the small particle size and large specific surface area,which offers short diffusion paths and effective area to the transmission of Li-ions.10Recently,customizing particle morphologies is also becoming more and more prevalent because these factors are well-known to significantly influence electrochemical performance.10,11In order to synthesize homogenous nano-sized LiFePO4and control its morphology at the same time,various synthesis technologies have been adopted such as the polyol process,10-12,14co-precipitation,13,15solid-state reactions,16,17hydrothermal synthesis,18-20solvothermal methods,10,21,22and the solgel process.23
The polyol process is a new method to synthesize LiFePO4,in this process,the polyol medium acts not only as a solvent,but also as a stabilizer and a deoxidizer.Jinsub et al.10showed that multi-morphous LiFePO4synthesized by solvothermal process achieved high discharge capacity,which was determined to be 161 and 110 mAh·g-1at 0.25C and 8C,respectively.In ethylene glycol medium,Deng12and Sun24et al.reported their researches on three-dimensional(3D)LiFePO4architectures.Deng et al.12showed their nest-like LiFePO4/C architectures with prodigious surface area,which calculated to be 14.4 m2·g-1in the relative pressure(p/p0)range of 0.05-0.30.Sun et al.24discussed the effect of ethylenediamine on controlling the morphology of LiFePO4particles and found that ethylenediamine has a great effect on the release of isolated iron ions in their synthetic system.
As mentioned in the above literature,LiFePO4nanoparticles with different morphologies were synthesized in different organic solvents.As we known,LiFePO4materials would show better electrochemical properties after calcination,but the special morphologies above mentioned would change their microstructures during the high temperature processing,then it seemed that the materials prepared with special morphologies did not affect electrochemical performance directly because these morphologies were unable to be maintained after heat treatment.
Our previous work25showed that LiFePO4nanoparticles synthesized in polyol medium have good electrochemical performance.In this work,highly crystalline LiFePO4nanorods were synthesized with different lengths and widths in the medium of triethylene glycol due to its strong chelating ability for assembling the nano-sized building blocks into rod-like microstructures.The surface energies would be dropped to a very low level after long reflux reaction time and the organic compounds are transformed into a layer of carbon that in situ restricted the growth of LiFePO4crystallites,26so the morphologies of precursors would be maintained after heat treatment and its effect on electrochemical performance could be characterized directly.
2 Experimental
2.1 Preparation of the LiFePO4/C composites
Stoichiometric FePO4·2H2O(29.12%content of Fe),LiOH·H2O(99%)were used as the starting materials and triethylene glycol(99%)was employed as solvent,deoxidizer,and chelating agent.
Firstly,0.3 mol starting materials and 90 mL triethylene glycol were added into anagate jar and milled for 4 h at room temperature.Then the resulting mixture was transferred into three three-neck round flasks with volume of 500 mL equally,each flask was added simultaneously with 90 mL triethylene glycol.The flasks were heated at 280°C and a set of reflux device was superimposed on each flask,the reflux reaction time of the three flasks was controlled at 4,10,and 16 h,respectively.Special attention should be given to remove the water of the flask once an hour.Three precursors were obtained after removing the remaining triethylene glycol of the resulting mixture under reduced pressure atmosphere.The three precursors with the reflux reaction time of 4,10,and 16 h were named as precursors A,B,and C,respectively.
In order to improve the material crystallinity and electrical conductivity of the LiFePO4,carbon-coating LiFePO4/C composites were obtained by calcining the mixture of the precursors and the remnant of organic compounds under nitrogen atmosphere at 700°C for 4 h,then three products were obtained.The three samples,whose reflux time controlled at 4,10,and 16 h,were denoted as samples A,B,and C,respectively.
2.2 Material characterization
The crystalline structures of products were analyzed by X-ray diffraction(XRD,D/max-rB,Rigaku,Cu Kαradiation)(λ=0.15418 nm,operated at 40 kV and 40 mA,scintillation counter,scanning range(2θ):10°-70°,step scanning:0.5(°)·min-1).The morphology and particle size of the prepared particles were observed by scanning electron microscopy(SEM,SPA400 Seiko Instruments,10 keV,vacuity>10-3Pa).The microscopic structure of the as-prepared sample was characterized by transmission electron microscope(TEM)and high resolution transmission electron microscope(HRTEM)(JEM-2100,JEOL,Japan).
2.3 Battery preparation and electrochemical measurement
The electrochemical performances of synthesized materials were tested by constant current charge-discharge method.The working cathode was composed of 80%(w)composite power,13%(w)acetylene black as conducting agent,and 7%(w)polyvinylidene fluoride(PVDF)as binder.After being blended in N-methyl-2-pyrrolidine(NMP),the mixtures were spread uniformly onto a thin aluminium foil,dried in vacuum at 120°C for 15 h and then cut into pieces.The electrolyte was 1 mol·L-1LiPF6solution in a mixed solvent of ethylene carbonate(EC)and dimethyl carbonate(DMC)(VEC:VDMC=1:1),Celgard 2400 as the separator.Metal lithium foils were used as the counter electrodes.The coin type cells were assembled in an argon filled glove box.The cells were galvano statically charged and discharged at room temperature between 2.5 and 4.3 V(versus Li/Li+)on the electrochemical test instrument.The cyclic voltammetry tests(CV)and electrochemical impedance spectroscopy(EIS)were performed on electrochemical workstation(CHI660B).The CV test was carried out at a scanning rate of 0.1 mV·s-1between 2.5 and 4.3 V.The amplitude of the AC signal was 5 mV over a frequency range from 100 kHz to 10 mHz.
3 Results and discussion
3.1 Material characterizations
Fig.1 shows the XRD patterns of the samples and precursors.The diffraction peaks except peaks of precursor A are in full accord with the ordered LiFePO4olivine structure indexed with orthorhombic Pnma space group(JCPDS Card No.83-2092)without other peaks such as FePO4,Fe3(PO4)2,and Fe2O3,although FePO4source was used.The main sharp diffraction peaks of LiFePO4are evident for the precursor A in Fig.1a,indicating that the LiFePO4olivine phase is synthesized in the reflux process,however,it also has some other peaks such as Fe3(PO4)2,Li3PO4,which may because its reflux time was only 4 h.Increasing the reflux reaction time from 4 to 10 h or 16 h,the crystallinity of precursors,which is calculated by Jada 5.0,has been heightened from the original about 85%to more than 94%,and the impurity peaks disappear.As shown in Fig.1b,the diffraction peaks get sharper after the precursors are calcined at high temperature,which indicates that all the three samples are well-crystallized.Even though element analyses of the final products reveal that the carbon contents of samples A,B,and C are 2.34%,2.44%,and 2.58%,respectively,there is no evidence of carbon in XRD patterns because the residual carbon from the remnant of organic compounds is in amorphous state.In order to calculate the unit cell parameters of the three samples,Rietveld refinement method is adopted.As shown in Table 1,the lattice parameters and cell volumes show good agreement with that reported in the literature.10The average crystallite sizes(D)estimated from the half width of the most intense peaks taking the Scherrer formula(D=Kλ/B cosθ=0.89λ/B cosθ,where K is Scherrer′s constant,B is half width of diffraction peaks,θ is the diffraction angle,and λ is the X-ray wavelength)theoretical basis,for the samples A,B,and C are instructed to be 35.7,33.1,and 32.6 nm,respectively.
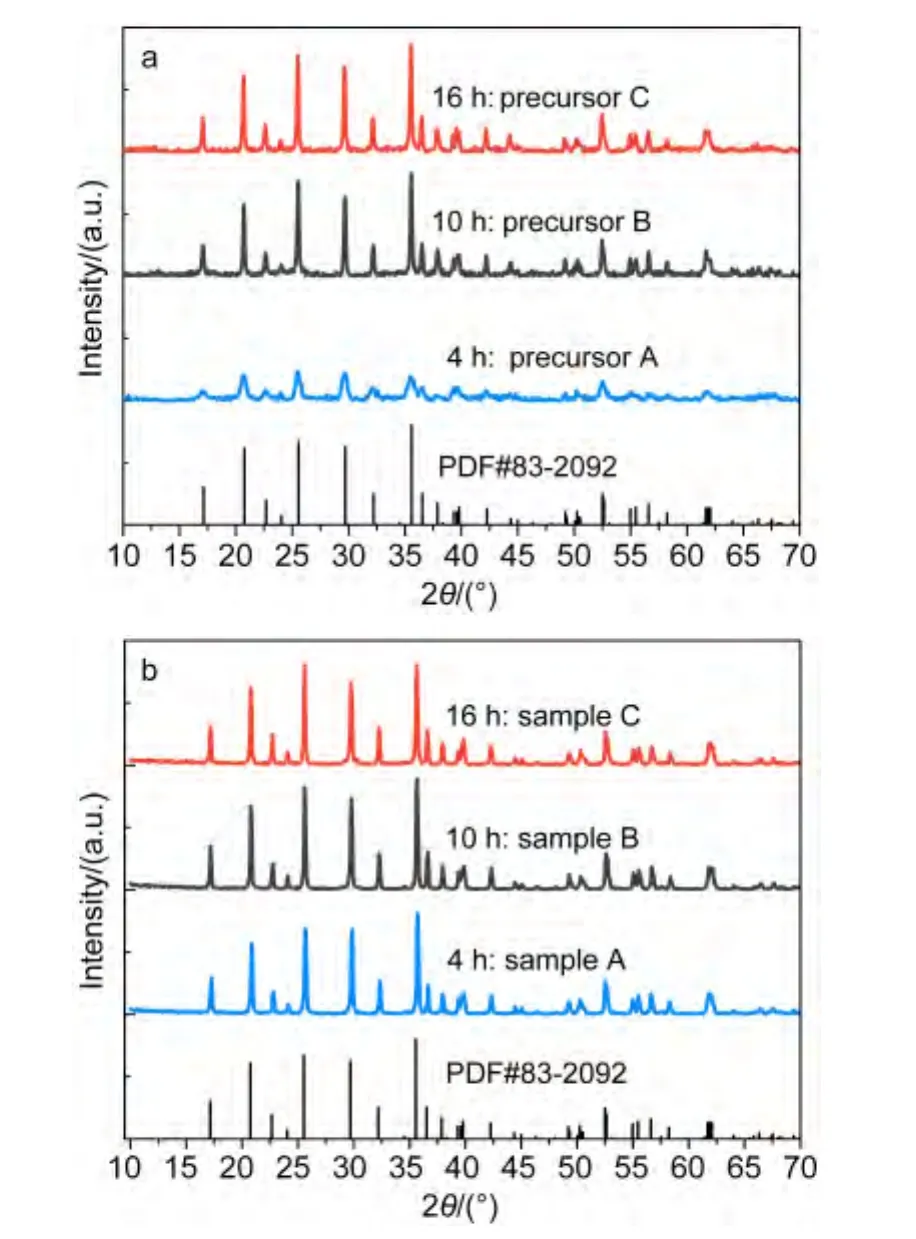
Fig.1 XRD patterns of(a)precursors A,B,C and(b)samples A,B,C
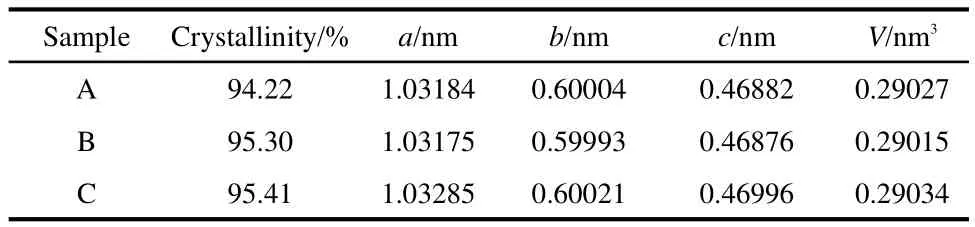
Table 1 Lattice parameters of the samples A,B,and C
The field-emission SEM analysis was used to observe the morphologies and the particle sizes of the samples.The morphologies of precursors A,B,and C have a significant difference.The SEM image in Fig.2a shows microstructure for precursor A,it can be clearly observed that the particles of precursor A present irregular short rod-like shape with some subtle particles.The average size of the microstructures ranges from 100 to 200 nm in length,60 to 100 nm in diameter,and aspect ratio of the rod is small which ranges from 1:1 to 3:1 approximately.The SEM image in Fig.2b reveals that precursor B consists of long rod-like,irregular short rod-like,and other subtle particles.The particle size distribution is wide which ranges from 100 to 400 nm in length,40 to 100 nm in diameter.The microstructure of precursor C with the reflux time of 16 h is shown in Fig.2c,the particle size distribution is narrow,presenting rod-like shape and its aspect ratio is the biggest among the three precursors,which is estimated at 5:1 approximately.In order to study whether these morphologies of the as-prepared precursors can be maintained after heat treatment,the SEM measurements of the three samples are carried out,as shown in Fig.2d,Fig.2e,and Fig.2f,respectively,big change in the morphologies of the three samples does not appear.This result indicates clearly that it is possible to obtain final LiFePO4/C products with desired morphologies by synthesis of lithium iron phosphate precursor in polyol medium.
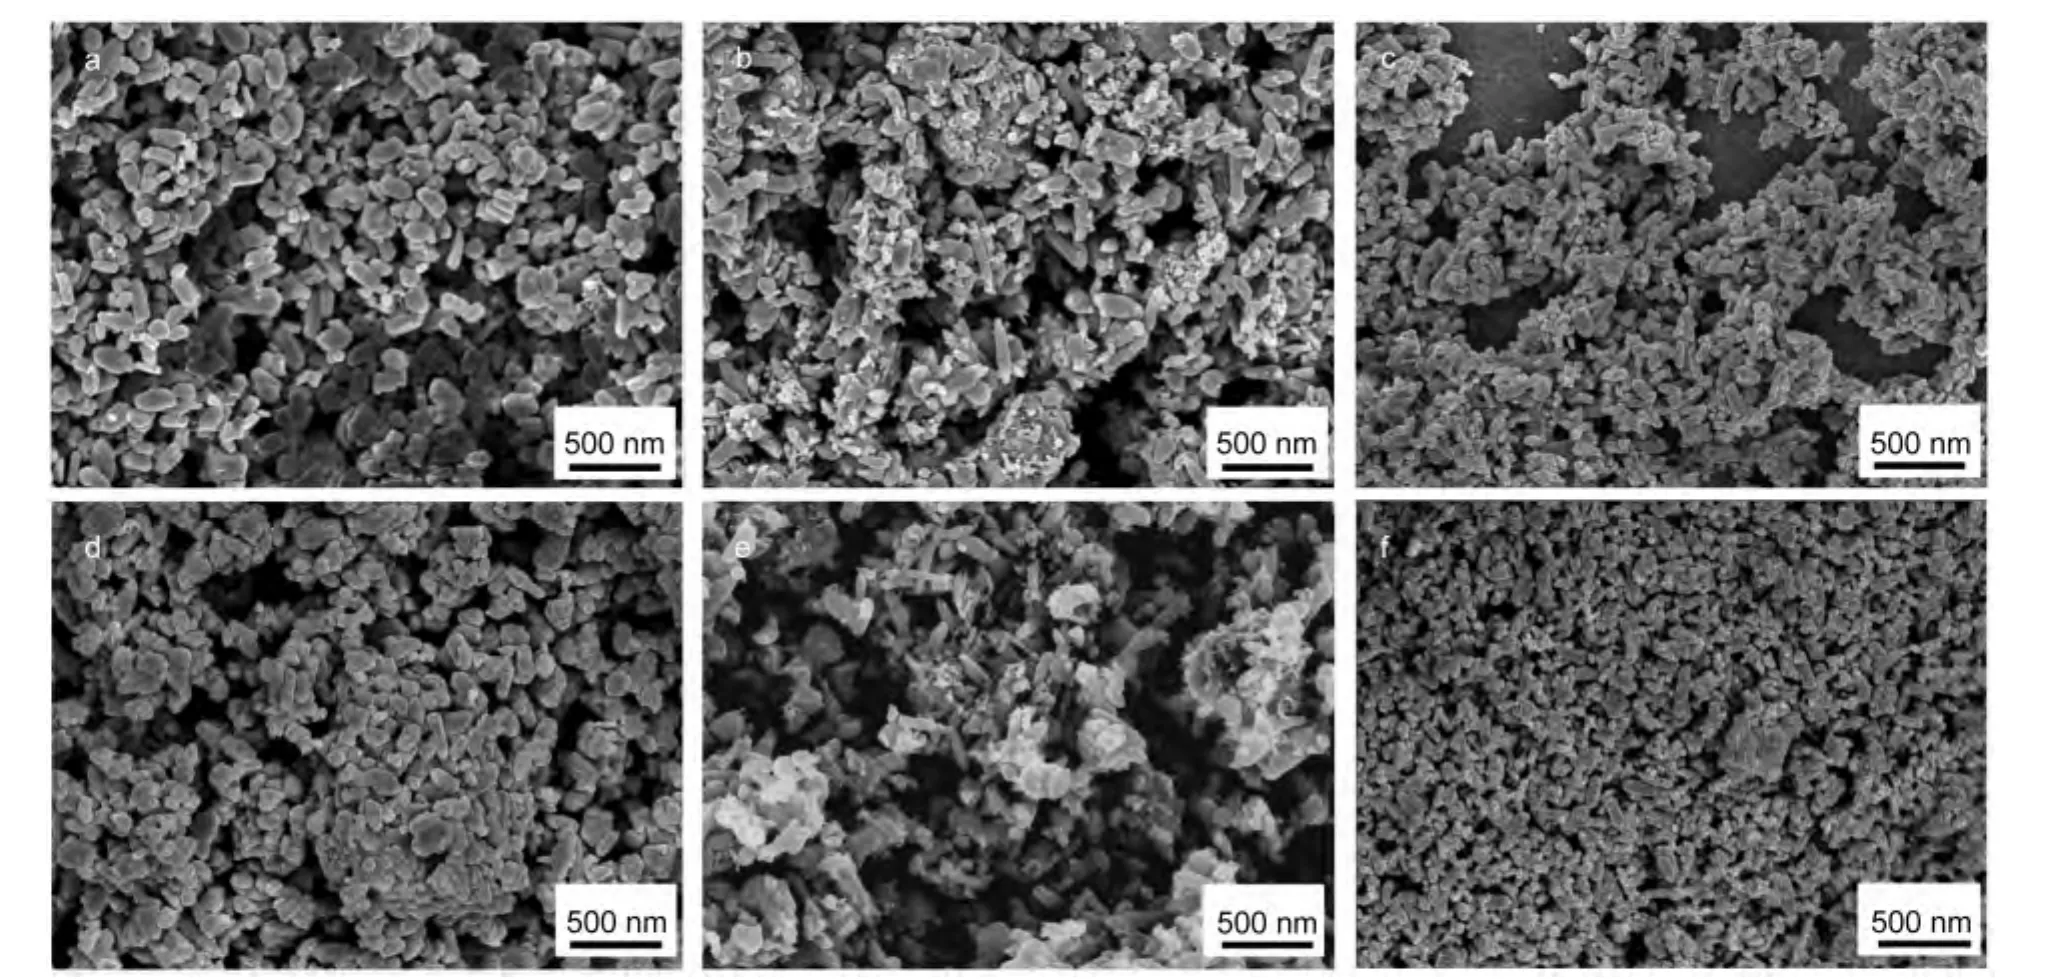
Fig.2 SEM images of the obtained particles
The TEM,high resolution TEM(HRTEM),and the selected area electron diffraction(SAED)images of the sample B are demonstrated in Fig.3.As shown in Fig.3a,it reveals clearly that the obtained LiFePO4/C consists of many irregular shaped particles such as long rod,short rod,and other subtle particles with the size less than 400 nm.A layer of amorphous phase carbon with the thickness over 1 nm covered on the surface of LiFePO4particles can be observed in Fig.3(b,d).This indicates that the remnant of organic compounds after vacuum distillation could be carbonized to provide a layer of homogeneousdispersed residual carbon on the surface of primary particles.The HRTEM image recorded from a part of an individual LiFePO4/C nanorod marked by a white circle(Fig.3c)shows the crystal lattices clearly,demonstrating that the sample is well-crystallized.The demonstrated crystal lattices evidence the d-spacing estimates of the adjacent lattice with 0.392 and 0.202 nm,corresponding to the(210)and(212)planes of orthorhombic LiFePO4crystals,respectively,which agree well with the results observed from the SAED pattern in Fig.3c.These results clearly revealed the growth of the nanocrystals along the[212]direction.
From the results of XRD analysis,TEM and SEM images,we can make a bold speculation that triethylene glycol acts as deoxidizer and chelating agent,which plays an important role in reducing Fe3+ions into Fe2+ions and changing morphology of the LiFePO4precursor.When FePO4·2H2O and LiOH·H2O were mixed together in polyol medium at its boiling point,due to the stronger reduction and complexing ability of triethylene glycol(TEG),the LiFePO4precursor with short rod-like morphology was synthesized,and with increasing refluxing time,the aspect ratios become bigger as a whole.After reduced pressure distillation,the remnant of organic compounds is well scattered on the surface of LiFePO4particles.Finally,the LiFePO4/C sample was obtained by high-temperature calcination.The above-mentioned product formation mechanism is presented in the schematic drawing,as shown in Fig.4.
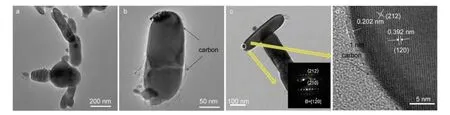
Fig.3 TEM and HRTEM images and SAED pattern of sample B
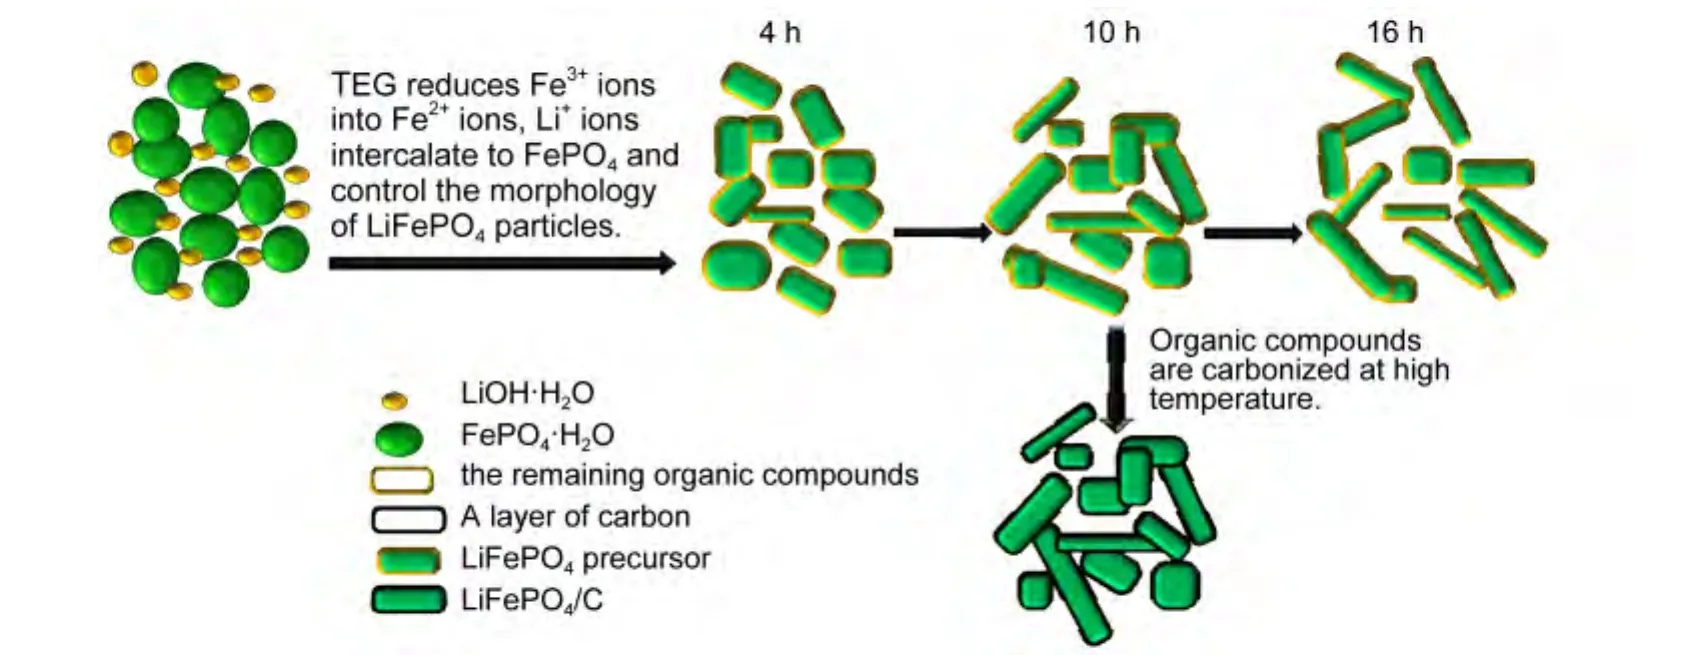
Fig.4 Product formation mechanism of the obtained particles
3.2 Electrochemical measurements
In order to investigate the electrochemical performances of the three LiFePO4/C samples,they are manufactured into cathode material for lithium-ion batteries.Fig.5a shows the chargedischarge curves of LiFePO4/C at current densities of 0.1C and 5C in the voltage window of 2.5-4.3 V.At 0.1C,it shows that sample B has an apparent charge and discharge plateau at 3.45 and 3.40 V,respectively,corresponding to the Fe2+/Fe3+redox reaction,the charge plateaus of other samples are a little higher than sample B but the discharge plateaus are the opposite.At 5C,the sample C demonstrates a slower enlargement in electrochemical polarization,compared with other samples.The plateau images imply that the electrode reactions27,28of samples B and C are better than others at 0.1C and 5C,respectively.
From Fig.5(a,b),it can be seen clearly that at low discharge rates sample B exhibits high discharge capacity and little capacity fading,reaching to 163 mAh·g-1at 0.1C in the voltage range of 2.5-4.3 V,samples A and C are registered to be 150 and 153 mAh·g-1,respectively,also with little capacity fading at low discharge rates.As shown in Fig.5c,with the discharge rate increasing,unpredictable but reasonable phenomena appear.The discharge capacities at 1C,3C,5C,and 10C are determined to be 135,122,113,and 101 mAh·g-1for the sample B and 120,100,93,and 78 mAh·g-1for the sample A,respectively,however,higher discharge capacities are registered to be 135,125,118,110 mAh·g-1for the sample C at the corresponding rates.What′s more,when the discharge rate is increased to 20C,the sample C maintains a discharge capacity of about 98 mAh·g-1after 20 cycles,which presents 57.6%of the theoretical capacity.Compared with the sample C,the samples A and B deliver discharge capacities of 86 and 59 mAh·g-1,respectively.As shown in Fig.5c,when the current rate is returned back to 1C again,the discharge capacities of the samples A,B,and C can be resumed to be 134,133,and 119 mAh·g-1,respectively,which means that the crystal structures of the obtained three samples are steady enough to endure electrical discharge at high discharge rates.From the results above,we can see obviously that the sample B at low discharge rates and the sample C at high discharge rates have more consummate electrochemical performances than others at the corresponding rates.As we known,the capacities of the three samples are controlled by some factors,which are variable and have not accurate value,such as the sizes and shapes,surface characteristics,arrangement types,crystallographic directions,and linking characteristics of the particles.As shown in the SEM images of Fig.2,in the sample B,the connections between particles are efficient,which may reduce charge transfer resistance during electrochemical reaction,10and in the sample C,its good performance may be due to the crystal growth with desirable crystallographic direction and smaller particle sizes.Put simply,above reasons situate the sample B at better electronic conductivity and sample C at higher diffusion of lithium ions across the two-phase boundary,what′s more,the electrode reactions are mainly controlled by electronic conductivity and diffusion of lithium ions at low and high discharge rates,respectively,so above phenomena appear.
The CV curves of the three LiFePO4/C samples in the voltage range of 2.5-4.3 V at the scan rate of 0.1 mV·s-1are shown in Fig.6.Each of the CV curves consists of an anodic peak and a cathodic peak,corresponding to the charge and discharge reactions of the Fe2+/Fe3+redox couple,or the lithium ion intercalation/deintercalation.28In the CV curves of LiFePO4/C cathode material,the smaller distance between charge and discharge voltage plateaus,the higher and sharper current peaks imply more excellent electrode reaction kinetics and more perfect electrochemical performance.The CV curves of samples B and C show more symmetrical,higher and sharper shape of the anodic/cathodic peaks,which indicates an improvement in the kinetics of the lithium insertion/extraction at the electrode/electrolyte interface.Compared with the samples B and C,the sample A has the weaker peaks in CV curves,and the distance between charge and discharge voltage plateaus peaks is bigger,indicating the electrochemical kinetics could be inhibited and the electrode polarization phenomenon is more serious,which are in accord with the electrochemical performances shown in Fig.5.

Fig.6 CV curves of samples A,B,and C under the potential window of 2.5-4.3 V
To evaluate the diffusion coefficient of lithium ions,electrochemical impedance spectroscopy(EIS)measurements are carried out under discharge condition with the voltage of 3.4 V.Fig.7a shows the Nyquist curves of the three samples and the equivalent circuit fitted by Zview2.0 program used for imitating the experimental impedance data is shown inset.All of the three Nyquist curves include a semicircle in high frequency region and approximate straight line in low frequency region.An intercept at the Z?axis in high frequency corresponds to the Ohmic resistance(Rs),representing the resistance of electrons and lithium ions getting through the electrolyte.The semicircle represents electric charge transfer process,and the numerical value of the diameter of the semicircle on the Z?axis is approximately equal to the charge transfer resistance(Rct).The slope line in the lower frequency region represents the Warburg impedance,which is associated with lithium-ion diffusion in material particles.29As shown in Fig.7a,the Ohmic resistances of the three samples are small and almost the same,which indicates the resistances of electrons and lithium ions getting through electrolyte in the three samples are similar and can be ignored for the survey of cathode materials.Rctof the sample B is the smallest one among the three electrodes,which indicates that its contact resistance is the smallest.The fitting impedance parameters according to the equivalent circuit and the diffusion coefficient of lithium ions calculated from EIS are shown in Table 2.
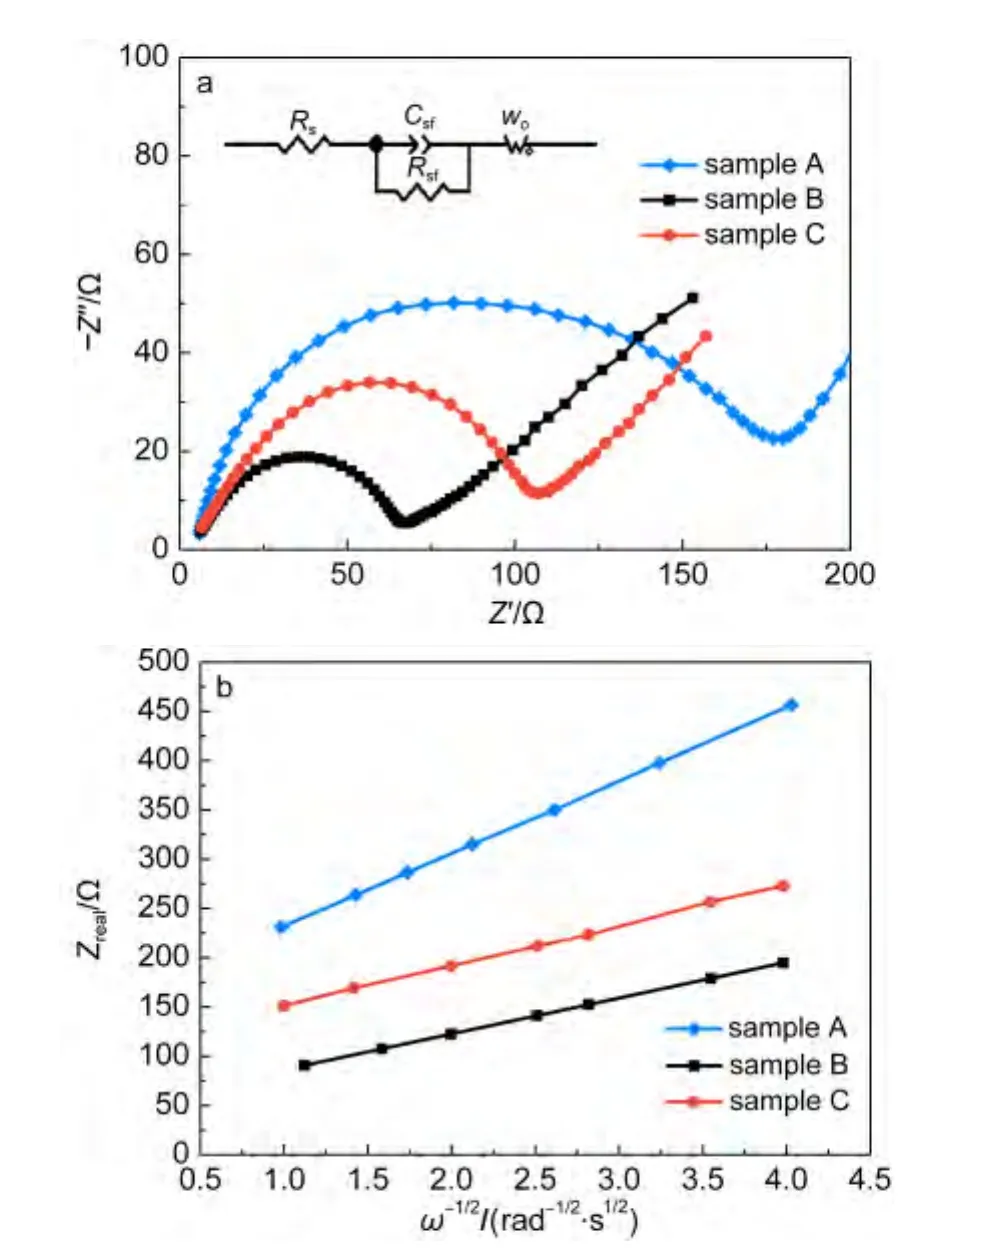
Fig.7 (a)Electrochemical impedance spectra of samples A,B,and C(inset:the equivalent circuit used for imitating the experimental impedance data);(b)relationship plot between impedance and angle frequency at low frequency region
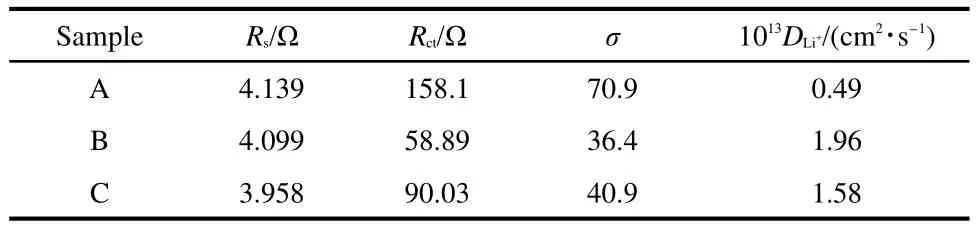
Table 2 Fitting impedance parameters according to the equivalent circuit form Nyquist curves for the three samples and the diffusion coefficients of lithium ions(D Li+)
The lithium-ion diffusion coefficient could be calculated using the formula as follows:
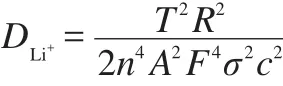
In above formula,R is the gas constant,T is the absolute temperature,n is the number of charge transfer,A is the surface area of cathode,F is the Faraday constant,c is the concentration of lithium ions.The Warburg coefficient(σ)is calculated by the linear fit result of Z?and ω-1/2from the EIS data,obeying the following formula:
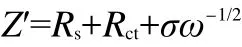
In the second formula,ω is the angle frequency.According to this formula,the slope σ can be calculated,as shown in Fig7b.Utilizing this σ in the first formula,the lithium-ion diffusion coefficients of the samples A,B,and C can be calculated to be 0.49×10-13,1.96×10-13,and 1.58×10⁻¹³cm2·s-1,respectively,it can be seen clearly that the electrochemical kinetics with Li+extraction for the sample B is the easiest compared with other samples.
4 Conclusions
In summary,we proposed an economical and simple polyol synthesis route to control the morphology of LiFePO4/C only by different reflux reaction time and the characteristics of TEG itself.The TEG medium can act not only as a deoxidizer in the process,but also as a chelating agent.In the synthesis process,TEG reduces Fe3+ions to Fe2+ions and controls the moving direction of Fe2+and Fe3+ions,leading to modulating the growth direction of LiFePO4crystallite,therefore,at different reflux reaction time,the material is assembled into different morphologies.What?s more,the remnant of organic compounds deriving from TEG can be served as carbon source for coating a layer of carbon on LiFePO4/C particles during thermal treatment.Electrochemical tests show that the specific discharge capacities can be improved at low discharge rate or high discharge rate by choosing appropriate time.The sample with reflux reaction time of 10 h exhibits the highest discharge capacity at low discharge rate.The sample with reflux reaction time of 16 h shows par excellence reversible capacities at high discharge rate,which is determined to be 110,98 mAh·g-1at 10C,20C,respectively.Under the current levels,we can not know the exact diffusing direction of Li+ions in the materials and just deduce it from the results of electrochemical performance,more in depth studies should be carried out.
(1)Andersson,A.S.;Thomas,J.O.J.Power Sources 2001,97,498.
(2)Whittingham,M.S.;Savinell,R.F.;Zawodzinski,T.Chem.Rev.2004,104,4243.doi:10.1021/cr020705e
(3)Padhi,A.K.;Nanjundaswamy,K.S.;Goodenough,J.B.J.Electrochem.Soc.1997,144,1188.doi:10.1149/1.1837571
(4)Yang,M.R.;Ke,W.H.;Wu,S.H.J.Power Sources 2007,165,646.doi:10.1016/j.jpowsour.2006.10.054
(5)Cheng,Y.;Wang,G.;Yan,M.M.;Jiang,Z.Y.J.Solid State Electrochem.2007,11,310.
(6)Ferrari,S.;Lavall,R.L.;Capsoni,D.;Quartarone,E.;Magistris,A.;Mustarelli,P.;Canton,P.J.Phys.Chem.C 2010,114,12598.doi:10.1021/jp1025834
(7)Delacourt,C.;Poizot,P.;Levasseur,S.;Masquelier,C.Electrochem.Solid-State Lett.2006,9,A352.
(8)Konarova,M.;Taniguchi,L.J.Power Sources 2010,195,3661.doi:10.1016/j.jpowsour.2009.11.147
(9)Yang,S.T.;Zhao,N.H.;Dong,H.Y.;Yang,J.X.;Hue,H.Y.Electrochim.Acta 2005,51,166.doi:10.1016/j.electacta.2005.04.013
(10)Jinsub,L.;Mathew,V.;Kangkun,K.;Jieh,M.;Jaekook,K.J.Electrochem.Soc.2011,158,A736.
(11)Kim,D.;Lim,J.;Choi,E.;Gim,J.;Mathew,V.;Paik,Y.;Jung,H.;Lee,W.;Ahn,D.;Paek,S.;Kim,J.Surf.Rev.Lett.2010,17,111.doi:10.1142/S0218625X10014053
(12)Deng,H.G.;Jin,S.L.;Zhan,L.;Qiao,W.M.;Ling,L.C.Electrochim.Acta 2012,78,633.doi:10.1016/j.electacta.2012.06.059
(13)Zheng,J.C.;Li,X.H.;Wang,Z.X.;Guo,H.J.;Zhou,S.Y.J.Power Sources 2008,184,574.doi:10.1016/j.jpowsour.2008.01.016
(14)Cao,Y.B.;Duan,J.G.;Jiang,F.;Hu,G.R.;Peng,Z.D.;Du,K.Acta Phys.-Chim.Sin.2012,28(5),1183.[曹雁冰,段建國(guó),姜 峰,胡國(guó)榮,彭忠東,杜 柯.物理化學(xué)學(xué)報(bào),2012,28(5),1183.]doi:10.3866/PKU.WHXB201202221
(15)Franger,S.;Le,C.F.;Bourbon,C.;Rouault,H.J.Power Sources 2003,119,252.
(16)Arnold,G.;Garche,J.;Hemmer,R.;Strobele,S.;Vogler,C.;Wohlfahrt-Mehrens,A.J.Power Sources 2003,119,247.
(17)Yamada,A.;Chung,S.C.;Hinokuma,K.J.Electrochem.Soc.2001,148,A224.
(18)Yang,S.F.;Zavalij,P.Y.;Whittingham,M.S.Electrochem.Commun.2001,3,505.doi:10.1016/S1388-2481(01)00200-4
(19)Dokko,K.;Koizumi,S.;Nakano,H.;Kanamura,K.J.Chem.Mater.2007,17,45.doi:10.1039/b613457m
(20)Zhao,H.C.;Song,Y.;Guo,X.D.;Zhong,B.H.;Dong,J.;Liu,H.Acta Phys.-Chim.Sin.2011,27(10),2347.[趙浩川,宋 楊,郭孝東,鐘本和,董 靜,劉 恒.物理化學(xué)學(xué)報(bào),2011,27(10),2347.]doi:10.3866/PKU.WHXB20110905
(21)Murugan,A.V.;Muraliganth,T.;Manthiram,A.Electrochem.Commun.2008,10,903.doi:10.1016/j.elecom.2008.04.004
(22)Gong,H.X.;Yu,Y.;Li,T.;Mei,T.;Xing,Z.;Zhu,Y.C.;Qian,Y.T.;Shen,X.Y.Mater.Lett.2012,66,374.doi:10.1016/j.matlet.2011.08.093
(23)Kim,J.K.;Choi,J.W.;Chauhan,G.S.;Ahn,J.H.;Hwang,G.C.;Choi,J.B.;Ahn,H.J.Electrochim.Acta 2008,53,28.
(24)Sun,C.W.;Rajasekhara,S.;Goodenough,J.B.;Zhou,F.J.Am.Chem.Soc.2011,133,2132.doi:10.1021/ja1110464
(25)Wen,J.J.Study on the Lquid Phase Synthesis of Lithium Iron Phosphate for Cathode Materials.MS Dissertation,Sichuan University,Chengdu,2012.[文嘉杰.液相法合成磷酸鐵鋰正極材料的研究[D].成都:四川大學(xué),2012.]
(26)Wang,Y.G.;Wang,Y.R.;Hosono,E.J.;Wang,K.X.;Zhou,H.S.Angew.Chem.Int.Edit.2008,47,7461.doi:10.1002/anie.v47:39
(27)Lin,Y.B.;Lin,Y.;Zhou,T.;Zhou,T.;Zhao,G.Y.;Huang,Y.D.;Huang,Z.G.J.Power Sources 2013,226,20.doi:10.1016/j.jpowsour.2012.10.074
(28)Dimesso,L.;Spanheimer,C.;Jacke,S.;Jaegermann,W.J.Power Sources 2011,196,6729.doi:10.1016/j.jpowsour.2010.11.015
(29)Barsoukov,E.;Kim,J.H.;Yoon,C.O.;Lee,H.J.Electrochem.Soc.1998,145,2711.doi:10.1149/1.1838703
猜你喜歡
中國(guó)機(jī)械工程(2022年22期)2022-11-25 08:24:30
中國(guó)機(jī)械工程(2022年7期)2022-04-20 03:25:38
云南化工(2021年9期)2021-12-21 07:44:16
云南化工(2021年6期)2021-12-21 07:31:42
中小學(xué)校長(zhǎng)(2021年9期)2021-10-14 14:36:16
中國(guó)機(jī)械工程(2019年17期)2019-09-19 07:43:32
物理化學(xué)學(xué)報(bào)(2018年6期)2018-03-08 03:45:49
中國(guó)機(jī)械工程(2018年4期)2018-03-06 05:34:58
中國(guó)眼鏡科技雜志(2016年9期)2016-12-01 06:37:33
生物骨科材料與臨床研究(2016年6期)2016-03-06 08:20:12