Imaging complex near-surface structures in Yumen oil field by joint seismic traveltime and waveform inversion
JIANG Wenbin,ZHANG Jie
(Laboratory of Seismology and Physics of Earth’s Interior,School of Earth and Space Sciences,University of Science and Technology of China,Hefei 230026,China)
Imaging complex near-surface structures in Yumen oil field by joint seismic traveltime and waveform inversion
JIANG Wenbin,ZHANG Jie
(Laboratory of Seismology and Physics of Earth’s Interior,School of Earth and Space Sciences,University of Science and Technology of China,Hefei 230026,China)
The first-arrival traveltime tomography is a standard approach for near-surface velocity estimation.However,it cannot resolve complex near-surface structures and will produce a smooth velocity model with low resolution.Early arrival waveform inversion is a robust tool for imaging the near surface structures,but it requires a good initial model to avoid cycle skipping between the predicted and observed data.Furthermore,waveform inversion requires substantial computation efforts.Therefore,we present joint seismic traveltime and waveform inversion method,and we expect the joint inversion method retains the advantages of both traveltime inversion and full waveform inversion and overcomes their respective drawbacks at the same time.The objective function includes both the traveltime and waveform misfit.At each iteration,the traveltimes are calculated by wavefront raytracing,and the waveforms are computed using a finite-difference method.The nonlinear optimization problem is solved by the conjugate gradient method.We apply the joint inversion method to study complex near-surface area where shallow overthrust and rugged topography present a significant challenge for applying traveltime inversion and waveform inversion alone.We test synthetic data to verify the advantages of the joint method,and then apply the method to a 2D dataset acquired in Yumen Oil field,China.The inversion results suggest that the joint traveltime and waveform inversion helps constrain the very shallow velocity structures and also resolve complex overthrust with large velocity contrasts.
joint inversion,FWI,traveltime tomography
1 Introduction
Accurate near-surface velocity model is essential for imaging subsurface structures in seismic exploration.The first-arrival traveltime tomography has been widely applied for near-surface imaging[1-4].However,traveltime inversion assumes a high frequency approximation of the data which results in a suboptimal estimate of subsurface velocity model.In addition,the model resolution of traveltime inversion is less than that of waveform inversion[5].Full waveform inversion (FWI) is a promising method for refining subsurface velocity model.Since no high frequency assumption is required,FWI yields highly resolved velocity models,and gives accurate results in geologically complex areas[5-8].
One fundamental challenge of FWI is the local minimum issue caused by the cycle-skipping between the predicted and observed data[9].In recent years,many new methods are proposed to improve the performance of FWI in subsurface model building.Researchers made great efforts to develop new FWI algorithms that can avoid or mitigate the cycle-skipping problem.WU et al.[10]developed a waveform envelope inversion method,which used waveform envelope to extracts low-frequency information of data.Envelope inversion method can avoid cycle-skipping problem and retrieve long-wavelength background velocity model for FWI.WARNER et al.[11]proposed adaptive waveform inversion,which reformulates the objective functions in terms of matching filters.The difference between observed and predicted data will project onto the time lag of the filter.Another effort tried to recover the background velocity model using traveltime shift as the misfit function.MA et al.[12]proposed a hybrid waveform inversion.They used wave-equation reflection traveltime inversion to update the low-wavenumber component and used FWI to update high-wavenumber details of the velocity model.JIAO et al.[13]developed adjustive full waveform inversion method,which built the relation between traveltime shift and model.Thus,FWI can correct the wrong background velocity model and mitigate cycle skipping issues.
The first arrival traveltimes and the early arrival waveforms are different attributes of the seismic data.The later one is associated with the near surface structures with profound information.However,waveform inversion has the problem of nonuniqueness of the model solutions.It means that there could be many global minima and all of them fit data well (Fig.1).In some real data cases,the results of waveform inversion may not fit the first arrival traveltimes any more for the nonuniqueness of the FWI.ZHANG et al.[14]developed joint first arrival traveltime and waveform inversion to image the near surface velocity model using different types of data.The joint traveltime and waveform method minimizes the misfit function for both traveltimes and waveform in the inversion process.In this way,the joint inversion method can fit both data by combining different physical imaging theories[14].The inclusion of traveltimes in the joint inversion helps constrain the velocity estimation of upper layers tightly and reduce artifacts near the sources and receivers.
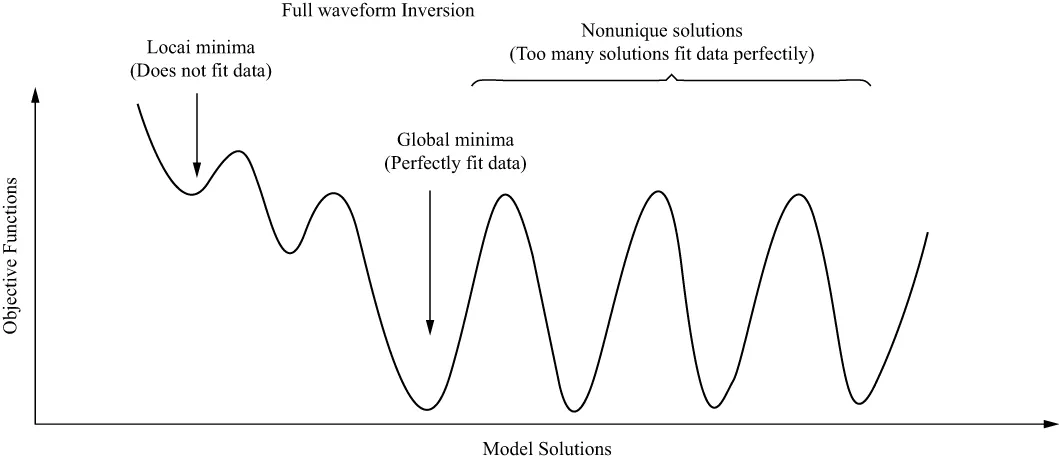
Figure 1 Schematic plot explaining nonunique problem of full waveform inversion
Most of the full waveform inversion methods are designed to image marine velocity structures or crosshole velocities where topography is simple or near-surface low velocity zones are not any concern[15-19].For near-surface velocity structure imaging,it sometimes requires to handle large topography variations in the full waveform inversion.The forward modeling using finite difference approach may produce inaccurate results in this situation.ZHANG et al.[20]proposed a variable grid mesh system for acoustic finite-difference modeling to solve this problem.In this study,we adopt this grid mesh system to FWI and the joint inversion method.
PetroChina carried out a multichannel large-offset 2D seismic survey in northwest China,Yumen Oil Field in September,2004.YILMAZ et al.[21]analyzed the Yumen large-offset data and derived a prestack depth migration image.We apply our joint inversion method to obtain an accurate near-surface velocity model and compare it with conventional FWI results.
We shall first present the theory of joint traveltime and waveform inversion.Through applying the joint inversion approach to 2D synthetic data,we study the performance of the joint inversion method for the situation where the velocity contrasts are large,and rugged topography is also significant.Then,we test the new method on real data acquired in Yumen oil field,China.Finally,we shall present conclusions of the results.
2 Theory
In the following,we shall discuss the theory of the joint inversion.Waveform inversion is a nonlinear problem.When the starting model is not close enough to the true one,the inversion process will stuck into local minimum and may not converge to the correct result.However,the traveltime inversion is nonlinear but stable.We could take advantages of the two methods to recover near-surface velocity model.The traveltime information can also constrain the near surface velocity and mitigate artifacts in model.
The objective function of joint traveltime and waveform inversion is defined as:
(1)
wherePobsis observed data,Psynis calculated waveform,tobsis picked traveltime from observed data,tsynis synthetic traveltime,mis the velocity model,m0is a priori model.Lis a Laplacian operator for regularization,ωis a scaling factor between waveform residual and traveltime residual[14].
We apply a regularized nonlinear conjugate gradients method to minimize the joint inversion misfit function,and calculate the following gradient to determine the model update direction:
(2)
PFis the forward propagated source wavefield,andPBrepresent the backward propagated residual wavefield.The first term on the right side of Equation (2) can be calculated by zero-lag correlation ofPFandPB[6-7,15,22-23].ATis a transposed sensitivity matrix of traveltimes containing raypath information,equivalent to the impact of traveltime sensitivity[2,14,24].For the traveltime inversion problem,we can easily access bothATandAmatrix after raytracing.Thus,we are able to place the following preconditioner to the gradient iteratively:
(3)
wheregkis the gradient of waveform inversion for thek-thiteration,Pis a preconditioner from traveltime tomography,andpkis a preconditioned gradient.With the combining traveltime data in the joint inversion,the inverse matrix of traveltime sensitivity could be treated as an effective preconditioner to waveform inversion.Thus,the joint inversion could find solutions quicker than performing FWI alone.We can easily access the raypath sensitivity matrix by applying raytracing in traveltime tomography.Therefore,computational cost in one-iteration of joint traveltime and waveform inversion is comparable to one-iteration FWI.In this study,the traveltime and raypath calculations are based on the algorithm of ZHANG et al[2].
During the inversion process,selection of a weighting factor ω between waveform misfit and traveltime misfit is an important issue.Ifωis too large,the joint inversion will yield a smoothed and low resolution model close to traveltime tomography.Ifωis too small,the joint inversion cannot constrain the near-surface velocity well.In this study,we estimate the regularization parameterωfrom several experiments and fix them between 10-3and 10-2.We have observed that the regularization parameters in this range can lead to a reasonable inversion result.We can also adjustωvia trial and error to produce an acceptable model in practice.
For FWI component,we adopt a variable grid mesh system for time domain acoustic finite-difference modeling to handle large topography variations in FWI.Topography shall be sufficiently sampled with refined boundary conditions in such a system.At the same time,the high velocity area in the deeper part of the model is not oversampled,ensuring efficient computation[20].
3 Synthetic tests
We carry out a synthetic test to analyze the nonlinearity of the objective functions.The true model is homogenous with a velocity of 2000m/s.We build a constant velocity model range from 1000m/s to 3000m/s with 10m/s interval.The acquisition geometry consists of 1 shot,and 100 receivers.The receivers are placed along surface at a 25 m interval.We calculate the objective functions value analytically.Assuming the forward modelling data from velocity model of 2000m/s is observed data,others are predicted data.Therefore,we can calculate traveltime residual and waveform residual versus different velocity models.
Fig.2 shows the objective function of traveltime inversion,waveform inversion and the joint inversion (the weighting factor is 0.5,the objective functions were normalized) versus hypothetical velocities.The objective function of waveform inversion contains many local minima.If the starting model is far from the true model,waveform inversion will stuck into local minimum and produce wrong inversion result.Traveltime inversion shows weak nonlinearity and is more stable than waveform inversion,but the resolution of traveltime inversion is low.The joint inversion helps mitigate nonlinearity of the misfit function.It suggests that the joint inversion can mitigate the dependence of initial model better than the waveform inversion alone.Different weighting factors on the traveltime residual will change the shape of misfit function curve.If the weighting factor is small,the shape of misfit function curve is close to waveform misfit curve.It includes many local minimum.If the weighting is large,the joint inversion will yield a smoothed and low resolution model close to traveltime tomography.Appropriate weighting factor helps the joint inversion avoid local minimum and produce a relatively high resolution model.
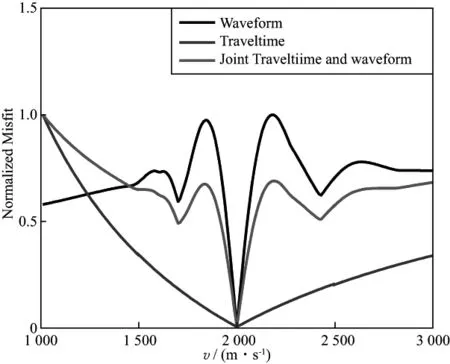
Figure 2 Objective functions for different near-surface inversion strategies (black:waveform inversion,blue:first-arrival traveltime tomography,red:joint traveltime and waveform inversion (weighting factor equals to 0.5))
Furthermore,we apply the joint inversion method to a 2D synthetic model.The true model is shown in Fig.3a,which is designed according to a geological model of Yumen Oil Field.It includes faults,high-velocity contrasts,and rugged topography.To test the resolving power and reliability of the survey geometry,we choose the same shot and receiver intervals in the synthetic test as in Yumen seismic survey.It includes 80 shots with interval of 170m,and about 750 receivers for each shot with interval of 20m,a 10Hz peak frequency Ricker wavelet is used as the source wavelet.We use the acoustic finite-difference method to generate the shot records.Traveltimes were calculated by the shortest path ray-tracing method.Fig.3b presents a smoothed model,which is used as an initial model for FWI and the joint inversion.Figs.4a and 4b show the result of waveform inversion and the joint inversion result,respectively.Both FWI and the joint inversion could recover the fault zone successfully.However,in the FWI result,the velocity of the top low-velocity layer seems too high.The joint inversion produces fewer artefacts near shots and receivers in the solution.The joint traveltime and waveform inversion ensures the near-surface velocities to fit the first-arrival traveltime.Therefore,it constrains near surface velocity using traveltime information.
Fig.5a shows the waveform overlay of a shot gather between observed waveform (black) and synthetic waveform (red) calculated with initial model.It clearly shows that the initial model does not produce cycle skipping for waveform.We compare the waveform overlay of a shot gather between observed data (black) and synthetics (red) associated with FWI result (Fig.5b),and overlay between observed data (black) and synthetics (red) associated
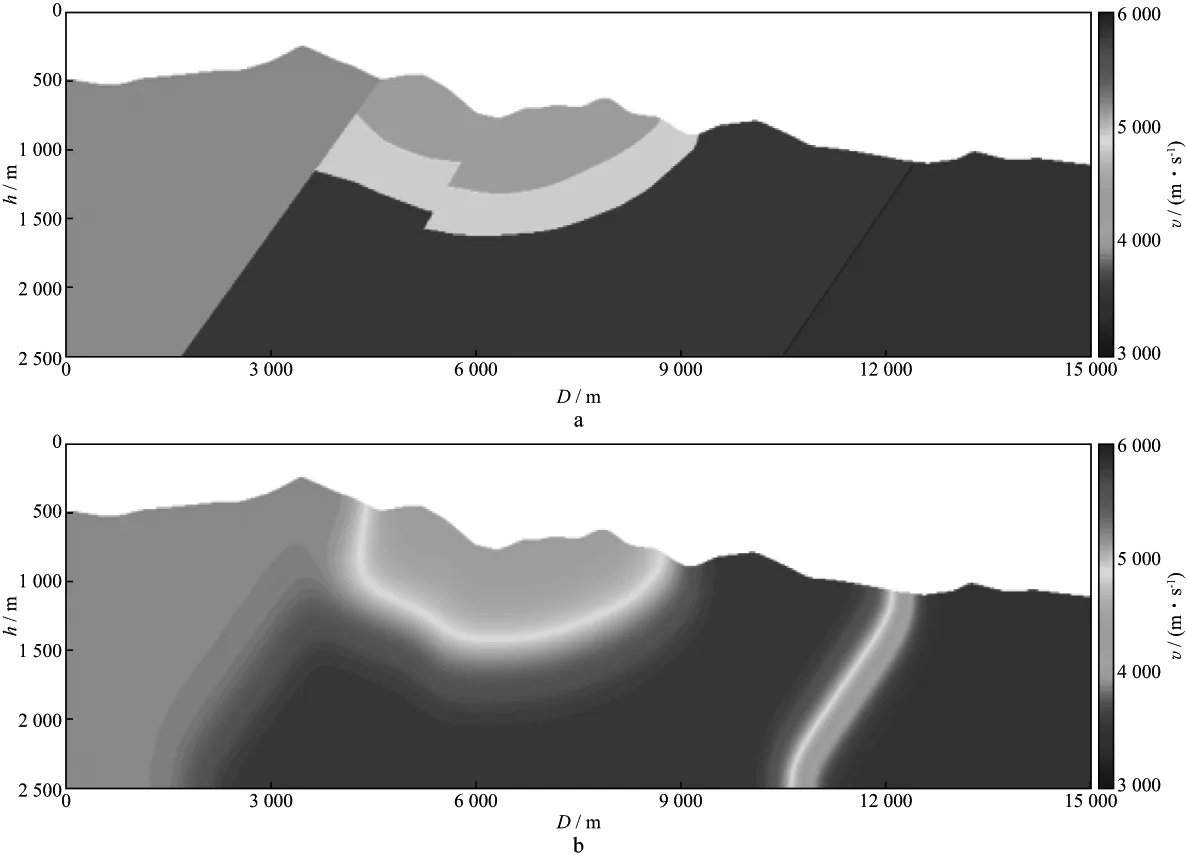
Figure 3 The 2D model designed according to a geological model of Yumen Oil Field (a) Initial model for FWI and the joint inversion (b)
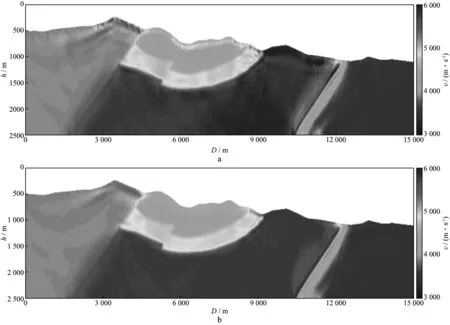
Figure 4 Inversion results of the synthetic examplea the waveform inversion result; b the inverted model of joint traveltime and waveform inversion
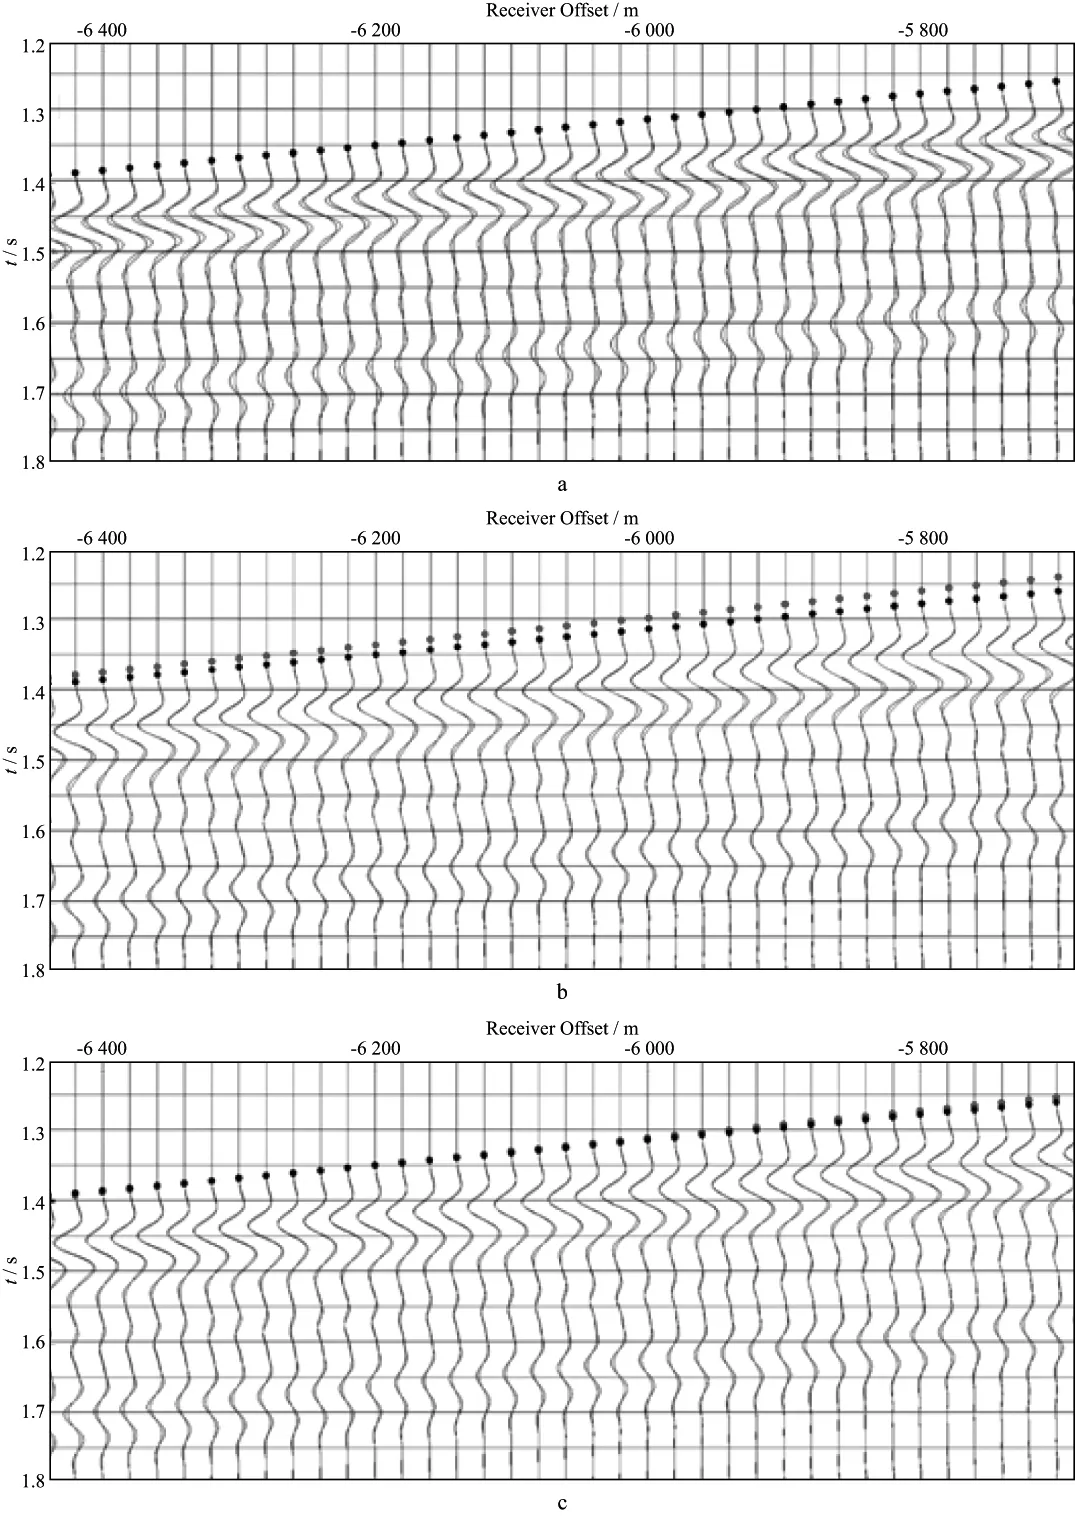
Figure 5 Waveform overlays of a shot gathera Waveform overlay between observed data (black) and synthetics (red) associated with initial model.The black points represent picked traveltimes; b Waveform overlay between observed data (black) and synthetics (red) associated with FWI result.The black points and red points represent picked traveltimes and synthetic traveltime calculated using FWI result,respectively; c Waveform overlay between observed data (black) and synthetics (red) associated with the joint inversion result.The black points and red points represent picked traveltimes and synthetic traveltime calculated using the joint inversion result,respectively
with the joint inversion result (Fig.5c).The black points represent picked traveltimes.The red points in Figs.5b and 5c represent synthetic traveltime calculated using FWI result and the joint inversion result,respectively.We can observe that the traveltime data calculated using FWI result have a large time shift compared with picked traveltimes,while the traveltime data calculated from the joint inversion result are close to the picked traveltime.This clearly demonstrates that the joint inversion fits traveltime and waveform simultaneously in the inversion process.
To quantify the accuracy of these results,we calculate the normalized data misfit (Fig.6a) and model misfit (Fig.6b) curves of the FWI and the joint inversion.The data misfit curves depict that the joint inversion method converges faster than the FWI because of the effective preconditioner.The model misfits of two methods decrease to the same level,means similar inversion results were obtained.We set the weighting factor as 0.01 in our inversion process.An appropriate weighting factor is important to lead to a good inversion result for the joint inversion.
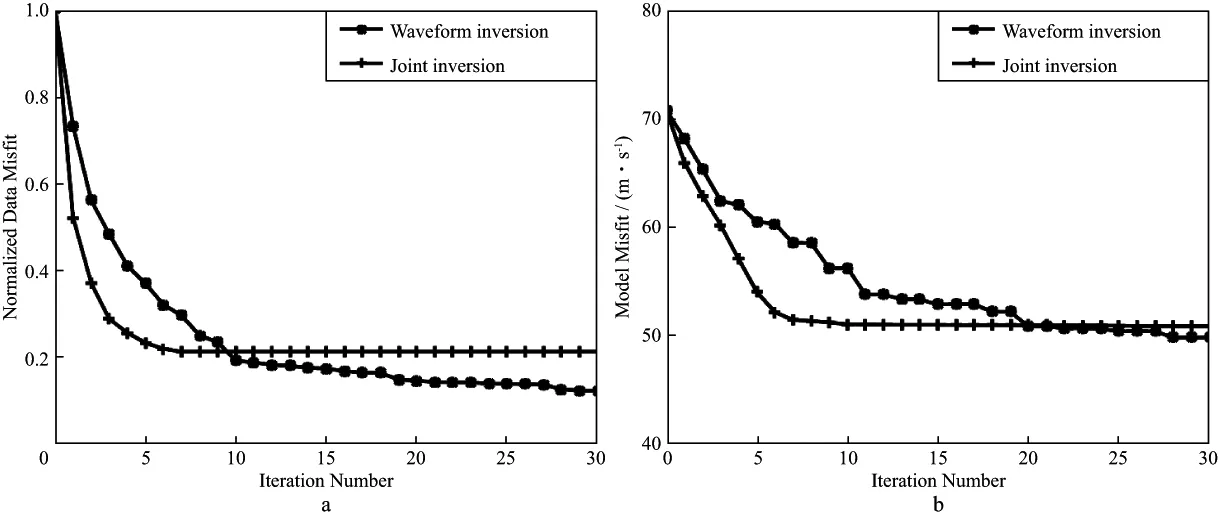
Figure 6 Convergence curves of the synthetic examplea The normalized data misfit of the waveform inversion and the joint inversion; b The model misfit of the waveform inversion and the joint inversion
4 Field data applications
A 2-D seismic survey was conducted at Yumen Oil Field.This area has significant lateral velocity variations and irregular topography associated with a rugged terrain.PetroChina conducted the seismic survey to retrieve the complex imbricate structures associated with the Yumen oil reservoir beneath the high velocity Kulong Shan allochthonous rocks in order to position production wells accurately.The Yumen large-offset survey line is in the SSW-NNE dominant structural dip direction.The northern part of the line is in Gobi Tan (Desert) and the southern half is over the Kulong Shan (mountains)[21].It is a survey line with large topography variations:the altitude difference along the line is larger than 1000m from south to north.The geometry consists of 211 shots with a 170m interval.A total of 1401 receiver groups are placed along 28km line at a 20m interval.The receiver spread is fixed for all shots in the common-spread acquisition geometry.Among the 211 shot records,we use 137 shot gathers for the near surface imaging.
We select the near offset data (3km) to image the near-surface velocity structures in this study.We pick the first-arrival traveltime from the field records and edit traces.Fig.7 shows a typical common shot gather (CSG) from shot 20,with the black points indicating the picked traveltime.The average reciprocal error of the picks for most of the shots is approximately 10ms.The near surface area includes large topography variations,and the first-arrival data indicates complex near surface structures in the area.We conduct the first-arrival traveltime tomography[2]with a model consisting of 1410×101 cells and a uniform grid spacing of 20m.Fig.8 presents the first-arrival traveltime tomography solution.The traveltime tomography result shows strong lateral and vertical velocity variations below rugged topography.The near-surface velocities are higher in the Kulong Shan (left) half of the model compared to the Gobi Tan sediments (right).
To resolve more details in the near surface ve-locity model,we apply FWI alone and the joint inversion to real data.The traveltime tomography solution is used as the starting model for FWI and the joint inversion.Fig.9 shows CSG 20 after a bandpass filter applied,removing bad trace,and muting data with an early-arrival time window of 100ms.Fig.10a depicts the average amplitude spectrums of raw data (solid line) and early arrival waveform (dash line)for CSG 20.The raw data is within a bandwidth of 6~30Hz.We can observe that the dominant frequency of the early arrival waveform is about 10Hz.We extract the source wavelet from each shot record for FWI and the joint inversion.Fig.10b shows the source wavelet for CSG 20.
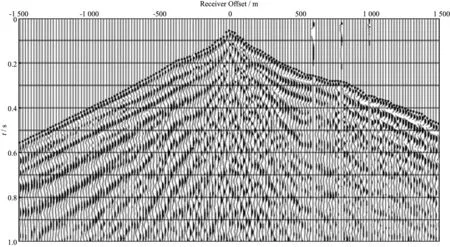
Figure 7 Field records from the Yumen seismic survey (Shot 20).Black points represent the picked traveltimes
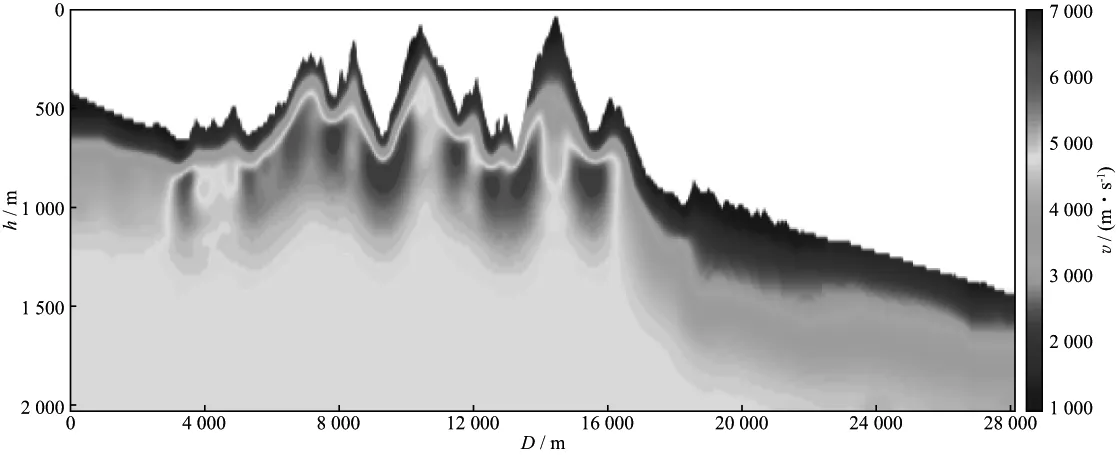
Figure 8 The near-surface model estimated from the first-arrival times
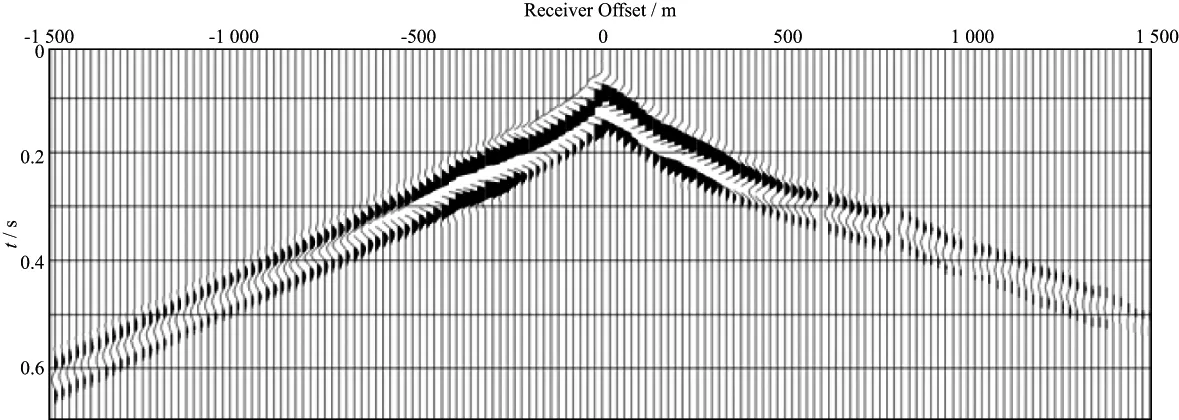
Figure 9 The CSG 20 after preprocessing
Figs.11a and 11b show the early-arrival waveform inversion and the joint inversion solutions,respectively.Both waveform inversion and the joint inversion present more velocity details than traveltime tomography alone.The joint inversion result is similar with the waveform inversion result,but fewer arte-facts are generated in the near-surface zones.
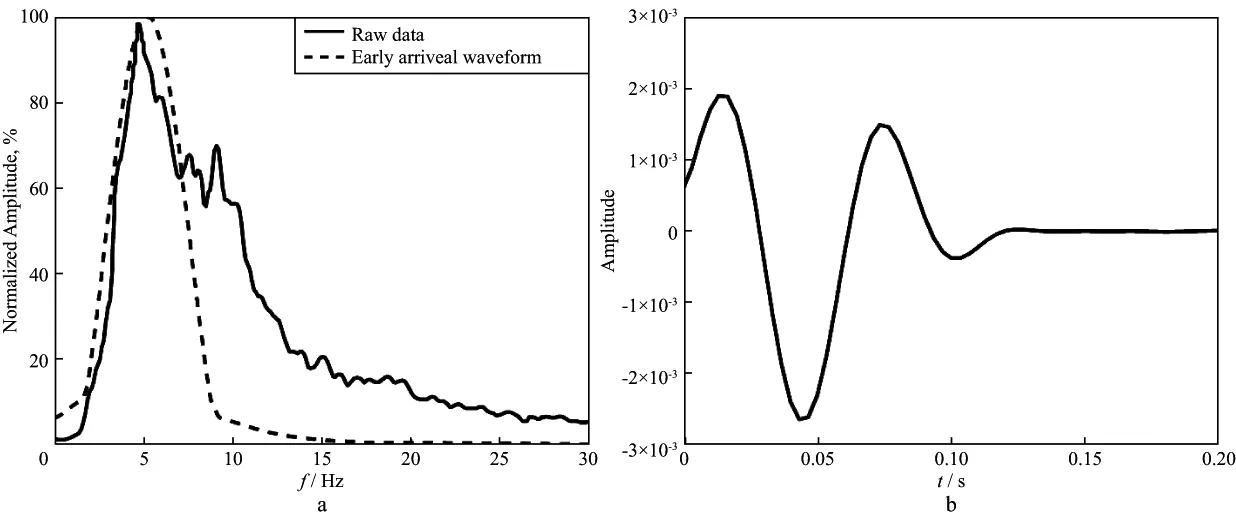
Figure 10 The average amplitude spectrums of raw data (solid line) and early arrival waveform (dash line) for CSG 20 (a) Source wavelet for CSG 20 (b)
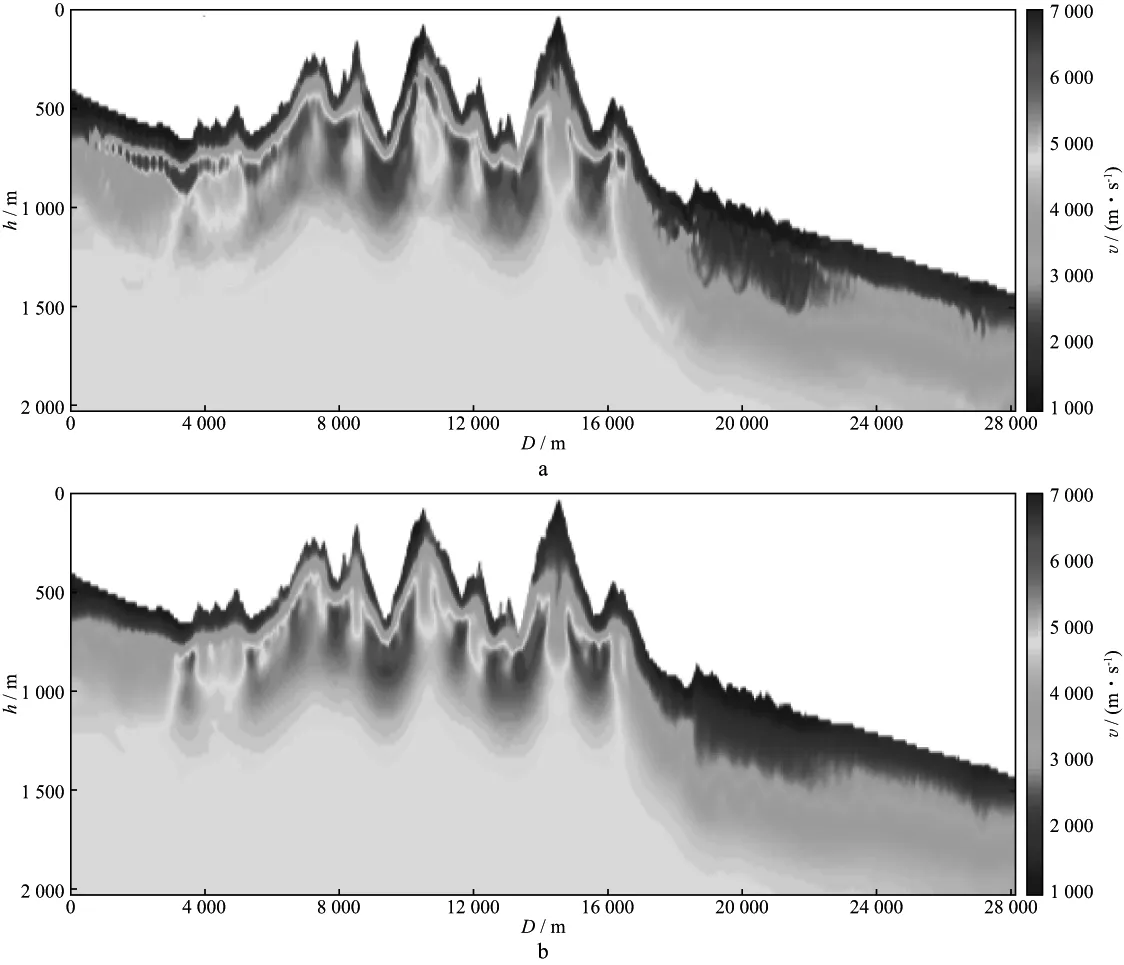
Figure 11 Waveform inversion result (a) The joint inversion solution (b)
Fig.12a depicts the waveform overlay of a shot gather (black) with synthetic waveform (red) associated with traveltime inversion result.Figs.12b and Figs.12c show corresponding waveform overlay of the same shot gather between observed data (black)
and synthetics (red) associated with FWI result,and overlay between observed data (black) and synthetics (red) associated with the joint inversion,respectively.The overall waveform fit of waveform inversion is good except that some part of synthetic waveform does not match the observed data (900~1500m).
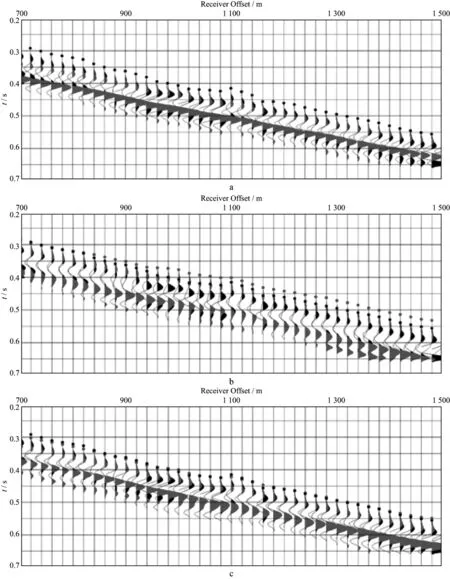
Figure 12 Waveform overlays of a shot gathera Waveform overlay between observed data (black) and synthetics (red) associated with traveltime inversion result.The black points represent picked traveltimes; b Waveform overlay between observed data (black) and synthetics (red) associated with waveform inversion result.The black points and red points represent picked traveltimes and synthetic traveltime calculated using waveform inversion result,respectively; c Waveform overlay between observed data (black) and synthetics (red) associated with the joint inversion result.The black points and red points represent picked traveltimes and synthetic traveltime calculated using the joint inversion result,respectively
The waveforms of the joint inversion are matched better than the waveform inversion due to the constraints of the traveltime information.The black points in three figures are picked traveltimes.The red points (Fig.12b,c) represent synthetic traveltimes calculated using the FWI result and the joint inversion result,respectively.We can observe a large time shift between traveltime calculated using the FWI result and picked traveltimes,while the traveltimes calculated from the joint inversion result are closer to the picked traveltimes.It suggests that fitting traveltime information by the joint inversion helps constrain the top near-surface velocity structures tightly.
Fig.13 shows the normalized data misfit of waveform inversion and the joint inversion versus iterations.The waveform inversion needs about 10 iterations,while the joint inversion needs only 6 iterations to converge.The joint inversion helps speed up the inversion process and save computational effort.
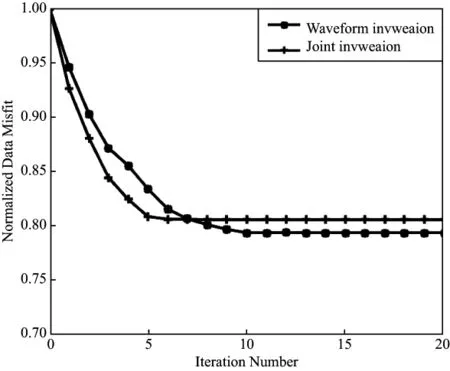
Figure 13 The normalized data misfit of the waveform inversion and the joint inversion
5 Conclusions
We apply a joint traveltime and waveform inversion approach to image the complex near-surface structures.Numerical experiment confirms that joint traveltime and waveform inversion produces a reasonable solution for models with large topography variations.Then we apply the joint method to data collected from Yumen Oil field in China.The result shows that the joint inversion can match waveform data better and does not produce shallow artefacts in the velocity model.The joint inversion method enables us to fit traveltime and waveform simultaneously in the inversion process.Therefore,the joint inversion helps produce more reliable near-surface velocity solutions than the waveform inversion method alone.
Both the first arrival traveltimes and the early arrival waveforms are reliable sources of seismic data.With a traveltime preconditioner applied,the joint inversion converges faster than the waveform inversion alone.The joint inversion method helps constrain the nonunique solutions.However,nonuniqueness of model solutions is a fundamental issue in traveltime tomography and FWI.The joint inversion method may not entirely solve the problem,but it helps constrain the solutions.
ACKNOWLEDGMENTS We gratefully acknowledge the financial support of the National Natural Science Foundation of China (Grant No.41374132 and No.41674120).We appreciate the support from GeoTomo,allowing us to use TomoPlus software package.We thank PetroChina for offering the data from Yumen oil field.
[1] ZHU X H,SIXTA D P,ANGSTMAN B G.Tomostatics:turning-ray tomography+static corrections[J].The Leading Edge, 1992,11(12):15-23
[2] ZHANG J,TOKS?Z M N.Nonlinear refraction traveltime tomography[J].Geophysics,1998,63(5):1726-1737
[3] LEUNG S,QIAN J.An adjoint state method for three-dimensional transmission traveltime tomography using first-arrivals[J].Communications in Mathematical Sciences,2006,4(1):249-266
[4] TAILLANDIER C,NOBLE M,CHAURIS H,et al.First-arrival traveltime tomography based on the adjoint-state method[J].Geophysics,2009,74(6):WCB1-WCB10
[5] SHENG J,LEEDS A,BUDDENSIEK M,et al.Early arrival waveform tomography on near-surface refraction data[J].Geophysics,2006,71(4):U47-U57
[6] TARANTOLA A.Inversion of seismic-reflection data in the acoustic approximation[J].Geophysics,1984,49(8):1259-1266
[7] PRATT R G,SHIN C,HICKS G J.Gauss-Newton and full Newton methods in frequency-space seismic waveform inversion[J].Geophysical Journal International,1998,133(2):341-362
[8] VIGH D,KAPOOR J,MOLDOVEANU N,et al.Breakthrough acquisition and technologies for subsalt imaging[J].Geophysics,2011,76(5):WB41-WB51
[9] VIRIEUX J,OPERTO S.An overview of full-waveform inversion in exploration geophysics[J].Geophysics,2009,74(6):WCC1-WCC26
[10] WU R S,LUO J R,WU B Y.Ultra-low-frequency information in seismic data and envelope inversion[J].Expanded Abstracts of 83rdAnnual Internat SEG Mtg,2013:3078-3082
[11] WARNER M,GUASCH L.Adaptive waveform inversion-FWI without cycle skipping-theory[J].Expanded Abstracts of 76thEAGE Conference and Exhibition,2014:324-331
[12] MA Y,HALE D.Wave-equation reflection traveltime inversion with dynamic warping and hybrid waveform inversion[J].Expanded Abstracts of 83rdAnnual Internat SEG Mtg,2013:871-876
[13] JIAO K,SUN D,CHENG X,et al.Adjustive full waveform inversion[J].Expanded Abstracts of 85thAnnual Internat SEG Mtg,2015:1091-1095
[14] ZHANG J,CHEN J.Joint seismic traveltime and waveform inversion for near surface imaging[J].Expanded Abstracts of 84thAnnual Internat SEG Mtg,2014:934-937
[15] PRATT R G.Seismic waveform inversion in the frequency domain,part 1:theory and verification in a physical scale model[J].Geophysics,1999,64(3):888-901
[16] MULDER W A,PLESSIX E E.Exploring some issues in acoustic full waveform inversion[J].Geophysical Prospecting,2008,56(6):827-841
[17] SEARS T J,SINGH S C,BARTON P J.Elastic full waveform inversion of multi-component OBC seismic data[J].Geophysical Prospecting,2008,56(6):843-862
[18] BOONYASIRIWAT C,SCHUSTER G T,VALASEK P,et al.Applications of multiscale waveform inversion to marine data using a flooding technique and dynamic early-arrival windows[J].Geophysics,2010,75(6):R129-R136
[19] KELLY S,RAMOS-MARTINEZ J,ZOU K,et al.Inversion of refractions and reflections by full-waveform inversion for marine streamer data:classification of problem types and solution methods[J].The Leading Edge,2013,32(9):1130-1138
[20] ZHANG W,ZHANG J.Full-waveform tomography with consideration for large topography variations[J].Expanded Abstracts of 81stAnnual Internat SEG Mtg,2011:2539-2542
[21] YILMAZ O,ZHANG J,SHIXIN Y.Acquisition and processing of large-offset seismic data:a case study from northwest China[J].Expanded Abstracts of 75thAnnual Internat SEG Mtg,2005:2581-2584
[22] LAILLY P.The seismic inverse problem as a sequence of before stack migrations[C]∥Conference on Inverse Scattering:Theory and Application.Philadelphia:SIAM,1983:206-220
[23] TARANTOLA A.Inversion of travel times and seismic waveforms[C]∥Seismic Tomography.Switzerland:Springer Netherlands,1987:135-157
[24] JIANG W,ZHANG J.Imaging complex near-surface land area with joint traveltime and waveform inversion[J].Expanded Abstracts of 85thAnnual Internat SEG Mtg,2015:1441-1445
(編輯:朱文杰)
2016-10-17;改回日期:2016-11-30。
JIANG Wenbin (1992—),Ph.D Candidate,his main research interests are travel-time inversion and FWI.
P631
A
1000-1441(2017)01-0057-12
10.3969/j.issn.1000-1441.2017.01.007

