Asymmetric Relationship between the Meridional Displacement of the Asian Westerly Jet and the Silk Road Pattern
Xiaowei HONG,Riyu LU,and Shuanglin LIClimate Change Research Center,Chinese Academy of Sciences,Beijing 00029,China
2State Key Laboratory of Numerical Modeling for Atmospheric Sciences and Geophysical Fluid Dynamics,Institute of Atmospheric Physics,Chinese Academy of Sciences,Beijing 100029,China
3University of the Chinese Academy of Sciences,Beijing 100049,China
4Nansen-Zhu International Research Centre,Institute of Atmospheric Physics,Chinese Academy of Sciences,Beijing 100029,China
5Department of Atmospheric Science,School of Environmental Studies,China University of Geosciences,Wuhan 430074,China
1.Introduction
The meridional displacement of the Asian jet(JMD)in summer,which manifests as the leading mode of zonal wind anomalies in the upper troposphere over the midlatitude Eurasian continent,has been revealed by recent studies(Du et al.,2016;Hong and Lu,2016;Wei et al.,2017).The JMD is characterized by a north–south seesaw pattern,with out-of-phase anomalies in zonal wind to the north of the climatological mean Asian jet axis and to the south.In other words,a northward JMD corresponds to westerly anomalies to the north of the axis and easterly anomalies to the south,and vice versa.Hong and Lu(2016)emphasized that the circulation anomalies associated with the JMD appear inhomogeneous along the zonal direction,with much stronger amplitudes over West Asia and East Asia but weak amplitudes over Central Asia.
Hong and Lu(2016)found that the JMD is significantly related to the Silk Road Pattern(SRP),which is a well-known teleconnection pattern in summer along the Asian jet in the form of alternate southerly and northerly anomalies,and behaves as the leading mode of upper-tropospheric meridional wind anomalies(e.g.,Lu et al.,2002;Sato and Takahashi,2006;Kosaka et al.,2009;Yasui and Watanabe,2010;Chen and Huang,2012).Corresponding to a northward(southward)JMD,the SRP tends to appear as a Specific phase,that is,there are southerly(northerly)anomalies over the Caspian Sea.Hong and Lu(2016)suggested that the JMD may trigger the meridional wind anomalies at the entrance of the Asian jet,and further induce the downstream SRP.This JMD–SRP connection therefore results in a combination of the JMD-and SRP-related circulation anomalies manifested by two significant anomalous anticyclones(cyclones)in the midlatitudes,with one located over West Asia and the other over East Asia,but a weak cyclone(anticyclone)over Central Asia(Hong and Lu,2016).These circulation anomalies—particularly the two anticyclonic(or cyclonic)anomalies over West Asia and East Asia—have been identified as the dominant pattern in the leading mode of upper-tropospheric hori-zontal winds(Hong and Lu,2016).
The SRP propagates along the Asian jet,and its wave source has been demonstrated in various previous studies to be around the entrance of the Asian jet(e.g.,Enomoto et al.,2003;Sato and Takahashi,2006;Kosaka et al.,2009;Yasui and Watanabe,2010;Chen and Huang,2012;Lin and Lu,2016).For instance,through model experiments,Yasui and Watanabe(2010)indicated that the diabatic forcing over the Black Sea and the Caspian Sea contributes to more than 60%of the SRP response.Chen and Huang(2012)suggested that the SRP is triggered through the advection of vorticity by the divergent flow over this domain.Therefore,changes in the wave source here might be crucial for the variability of the SRP and the JMD–SRP relationship.
The present study is an extension of Hong and Lu(2016).We show that a positive JMD–SRP relationship exists during northward JMD years but not during southward years(section 3).Furthermore,the possible mechanisms underlying this asymmetry in the JMD–SRP relationship are explored(section 4).Conclusions are given in section 5.
2.Data and methods
The main data source for this study is the monthly NCEP–NCAR reanalysis dataset(Kalnay et al.,1996),with a 2.5°×2.5°horizontal resolution.The analysis period for all data is 1958–2014,and the average calculations for June–July–August(JJA)are used to represent summer.
We define separate indexes for the JMD and SRP,as follows.In line with Yasui and Watanabe(2010),we define the SRP index(SRPI)as the principal component(PC)of the leading mode for the 200-hPa meridional wind(V200)anomalies,which is obtained through empirical orthogonal function(EOF)analysis in the domain(20°–60°N,0°–150°E).A positive(negative)SRPI indicates an SRP phase with southerly(northerly)anomalies over the Caspian Sea.In addition,we define the JMD index (JMDI) as the difference in 200-hPa zonal wind(U200)anomalies between the domains(40°–55°N,40°–150°E)and(25°–40°N,40°–150°E),which are located to the north and south of the climatological jet axis,respectively,following Hong and Lu(2016).A positive(negative)JMDI indicates a northward(southward)JMD.To obtain robust results,we also use another index for the JMD,i.e.,the PC of the first EOF mode of U200 anomalies over the domain(20°–60°N,0°–150°E)(hereafter,Upc1).
The main method used in the present study is composite analysis.Positive and negative cases are defined as the maximum 14 years and minimum 14 years,respectively,based on the JMDI and Upc1(Table 1).The same number for positive and negative cases is used deliberately to guarantee a reliable description of the asymmetry in the JMD–SRP relationship.This total of 28 years constitutes about half of the entire analysis period,and the residual 29 years are considered as“normal”cases.These normal cases are used as a reference,i.e.,the anomalies for positive/negative cases are the differences between these cases and normal cases.Besides using 14 selected years,we also checked other thresholds andobtained similar results(not shown).The Student’s t-test is used to test the statistical significance of the analyzed results.

Table 1.Selected cases for the positive and negative JMDI and Upc1.Bold and italic font delineate the discrepancies for the positive and negative phases,respectively,when selecting the cases.
3.Asymmetry in the relationship between the JMD and SRP
Figure 1 shows the composite V200 and U200 anomalies for the positive and negative JMDI cases(hereafter referred to as“JMDI+”and “JMDI?”cases),respectively.The V200 anomalies in the JMDI+cases(Fig.1a)are characterized by a well-organized wave-like pattern along the Asian jet,from West Asia to East Asia.The amplitudes of these alternate anomalies are roughly the same for each cell,which are all above 3 m s?1.The wave-like pattern along the Asian jet agrees with the SRP-related anomalies, which are represented by the red contours,and coincide well with the anomalies related to the SRP in previous studies(e.g.,Lu et al.,2002;Yasui and Watanabe,2010).By contrast,there is no clear wavelike pattern along the Asian jet for the JMDI?cases(Fig.1b).The V200 anomalies tend to be scattered to the north and south of the Asian jet,but are weak along the jet.These anomalies differ remarkably from the SRP-related anomalies(also shown as red contours in Fig.1b),even showing opposite signs over the Caspian Sea and Central Asia.Therefore,the relationship between the JMD and SRP is close for positive JMDI years but vague for negative years.
On the other hand,the composite U200 anomalies for the JMDI+and JMDI?cases also show evident distinctions.For the JMDI+cases(Fig.1c),the most prominent feature of the U200 anomalies is a north–south seesaw pattern,with westerly and easterly anomalies on the two sides of the climatological mean jet axis,respectively.Consistent with previous studies(Du et al.,2016;Hong and Lu,2016),this seesaw pattern appears much stronger over West Asia and East Asia,with the amplitudes of the centers around these regions being above 7 m s?1.Meanwhile,the anomalies over Central Asia are quite weak,as indicated by the strength being only about 2 m s?1.Hong and Lu(2016)suggested that the JMD can be further promoted by the SRP,manifested by intensi fi ed wind anomalies over West Asia and East Asia but weakened anomalies over Central Asia.Therefore,the inhomogeneous U200 anomalies in the zonal direction for the JMDI+cases(Fig.1c)can also be viewed as a manifestation of a close JMD–SRP relationship.The U200 anomalies in the JMDI?cases(Fig.1d)also exhibit a seesaw pattern,similar to that for the JMDI+cases.However,these anomalies are much weaker and tend to shift westward.

Fig.1.Composite JJA mean 200-hPa anomalies of(a,b)meridional wind and(c,d)zonal wind(contours;units:m s?1)for(a,c)positive and(b,d)negative JMDI cases.Contour intervals are 1 m s?1and zero contours are omitted.Solid and dashed contours indicate positive and negative anomalies,respectively.Thick lines delineate the jet axes for the(a,c)positive and(b,d)negative JMDI cases,which are determined by the maximum zonal wind being greater than 25 m s?1.Red solid(dashed)contours denote regions where the composite V200 anomalies exceed 2 m s?1(fall below?2 m s?1)for the(a)maximum 14 years and(b)minimum 14 years,based on the SRPI.Shading indicates regions of significance at the 0.05 level,according to the Student’s t-test.
To check that the above mentioned asymmetry in the JMD–SRP relationship is not merely the result of a particular index used,we adopt Upc1 as another index for the JMD.This index is similar to the JMDI,with the correlation coefficient between them being as high as 0.96,but the two indexes differ appreciably,as explained later.Figure 2 shows the composite V200 and U200 anomalies for the positive and negative Upc1 cases(hereafter referred to as“Upc1+”and“Upc1?”cases),respectively.It is clear that for the Upc1+cases(Figs.2a and c),there is a well-organized wave-like pattern in V200 anomalies along the Asian jet,which nearly overlaps with the anomalies related to the SRP(red contours in Fig.2a),and the north–south seesaw pattern of U200 anomalies is stronger over West Asia and East Asia.These anomalies show great resemblance to those for the JMDI+cases(Figs.1a and c),verifying the robustness of the JMD–SRP relationship in northward JMD years.By comparison,the anomalies for the Upc1?cases(Figs.2b and d)show much weaker intensity compared to those for the Upc1+cases.Hardly any significant V200 anomalies exist along the Asian jet over the western Eurasian continent,deviating greatly from those related to the SRP(red contours in Fig.2b),and the intensities of the U200 anomalies are roughly only around half those for the Upc1+cases.
Figures 1 and 2 indicate that when different indexes are used for the JMD,the related anomalies are similar for the northward JMD but quite different for the southward JMD cases.The reason for this similarity and difference is that the cases selected by the two indexes are similar for the northward JMD cases but quite different for the southward JMD cases,as shown in Fig.3 and Table 1.Almost all cases(13 of 14)are the same for the northward JMD cases,but 10 cases in total are distinct for the southward JMD cases.specifically,1960,1968,1983,1988 and 2003 are included in the JMDI?cases but are absent in the Upc1?cases;while 1965,1974,1991,2002 and 2012 are selected for the Upc1?cases but are not chosen for the JMDI?cases.
In addition, the anomalies tend to be more spatially coherent for the northward JMD cases than the southward cases.The pattern correlation coefficients in the U200 anomalies within the domain(20°–60°N,0°–150°E)between individual cases and the corresponding composites(e.g.,positive cases with the positive composite and negative cases with the negative composite)are generally greater for the positive cases than the negative cases(Table 2).
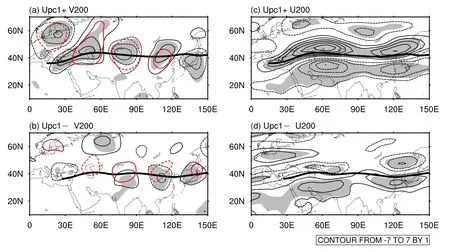
Fig.2.As in Fig.1 but for composites based on the Upc1.
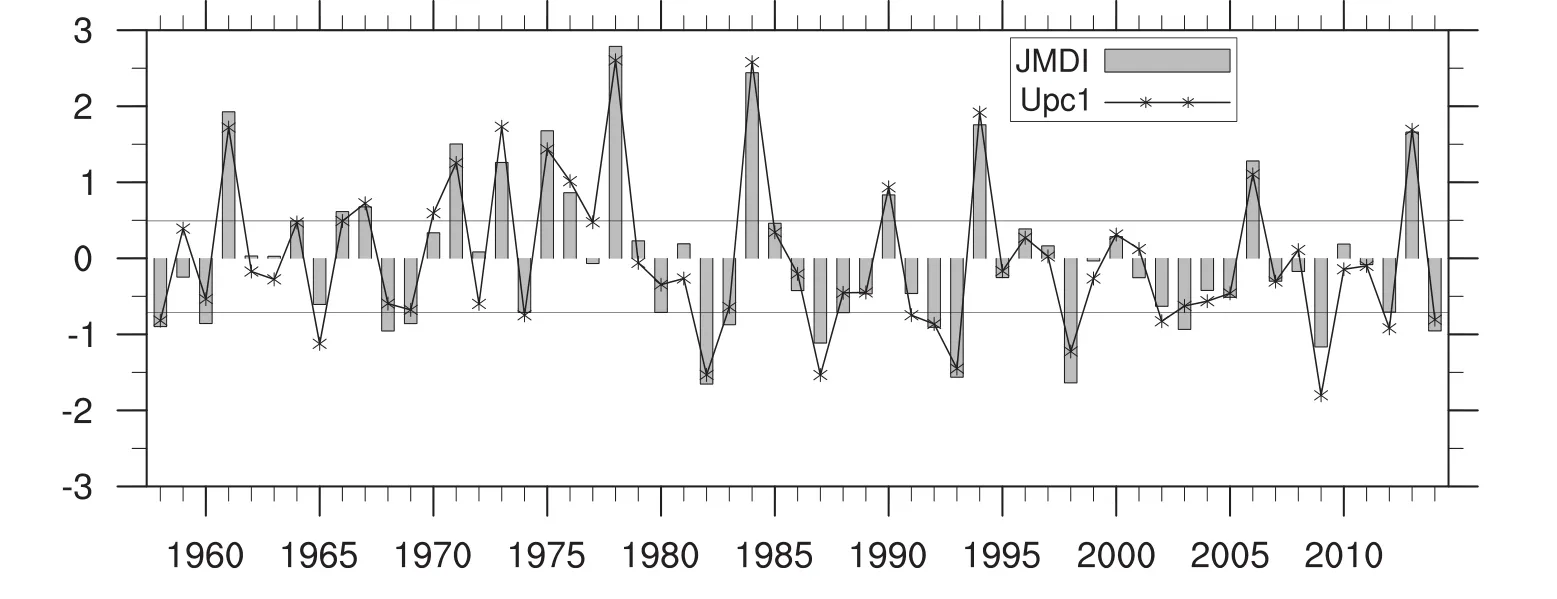
Fig.3.Time series of standardized JMDI(bars)and Upc1(marked line).The thin horizontal lines indicate the thresholds selecting the JMDI+and JMDI?cases.

Table 2.Pattern correlations coefficients(c.c.)in U200 anomalies within the domain(20°–60°N,0°–150°E)between individual selected cases(see Table 1)and the corresponding composites.
Scatterplots of standardized JMDI and Upc1 with the SRPI,as shown in Fig.4,better illustrate the asymmetry in the JMD–SRP relationship.In general,there is a positive relationship between the JMD and SRP:the SRPI is positive(negative)in most positive(negative)JMDI/Upc1 years.This positive relationship is confirmed by the correlation coefficient between the JMDI(Upc1)and SRPI,which is 0.40(0.54)and significant at the 0.01 level.However,Fig.4 also indicates an interesting detail of this positive relationship:with increment of the JMDI,the SRPI increases obviously when the JMDI is positive but tends to decrease when the JMDI is negative(Fig.4a).This can be verified by the correlation coefficients between the two indexes,which drop dramatically from 0.60 for the positive JMDI years to?0.16 for the negative JMDI years.The correlation coefficient is negative,although weak, for the negative JMDI years. The scatterplot of Upc1 and SRPI(Fig.4b)shows quite similar features to Fig.4a,with contrasting correlation coefficients of 0.62 and?0.04 for positive and negative Upc1 years,respectively.
All the above results on the asymmetry in the JMD–SRP relationship are obtained from the viewpoint of JMD indexes.If this relationship is viewed from the perspective of positive and negative SRPI years,the asymmetry can also be found.The correlation coefficient between JMDI(Upc1)and SRPI is 0.55(0.59)and significant at the 0.01 level in positive SRPI years,but is only 0.04/0.20 in negative SRPI years.For brevity,we only show the results based mainly on the JMD indexes in this paper.
4.Role of the Rossby wave source in the asymmetry of the JMD–SRP relationship
The Rossby wave source(RWS),which plays a primary role in inducing the SRP,has been demonstrated to be located around the entrance of the Asian westerly jet(Enomoto et al.,2003;Sato and Takahashi,2006;Kosaka et al.,2009;Yasui and Watanabe,2010;Chen and Huang,2012;Lin and Lu,2016).Consequently,changes in the jet stream—the JMD,for instance—may initiate corresponding changes of the RWS, and eventually influence the SRP and its connection with the JMD.Therefore,we next analyze the role played by the RWS in the asymmetry of the JMD–SRP relationship.

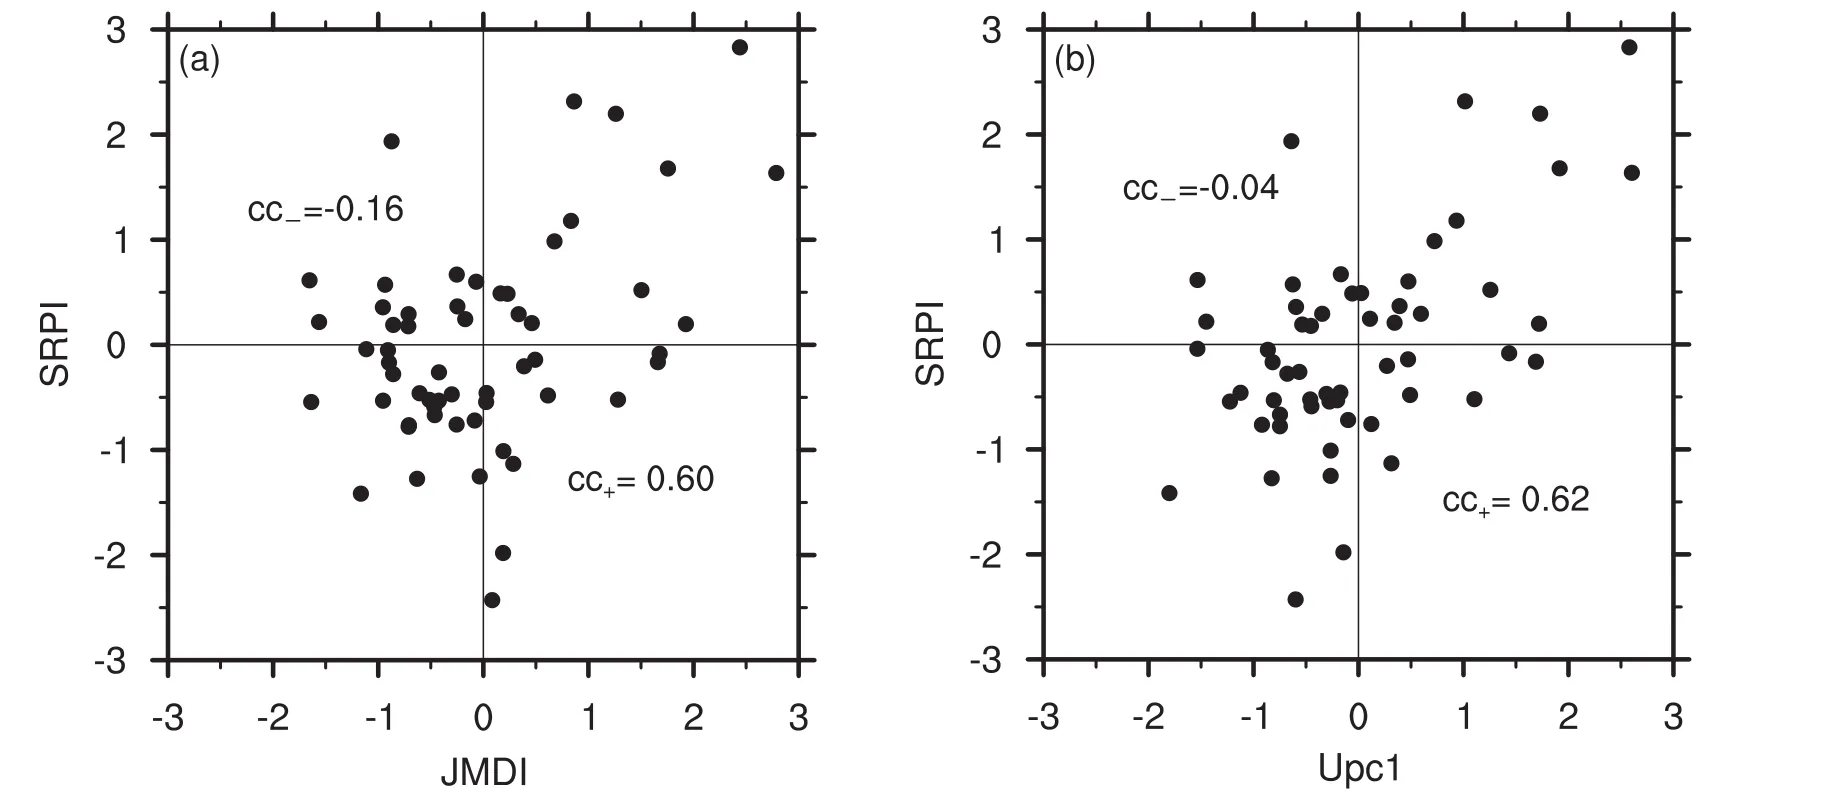
Fig.4.Scatterplots of standardized JMDI and Upc1 with the SRPI.“cc”indicates the correlation coefficient between the JMDI/Upc1 and SRPI,and the subscripts“+”and“?”denote the positive JMD years and negative JMD years,respectively.
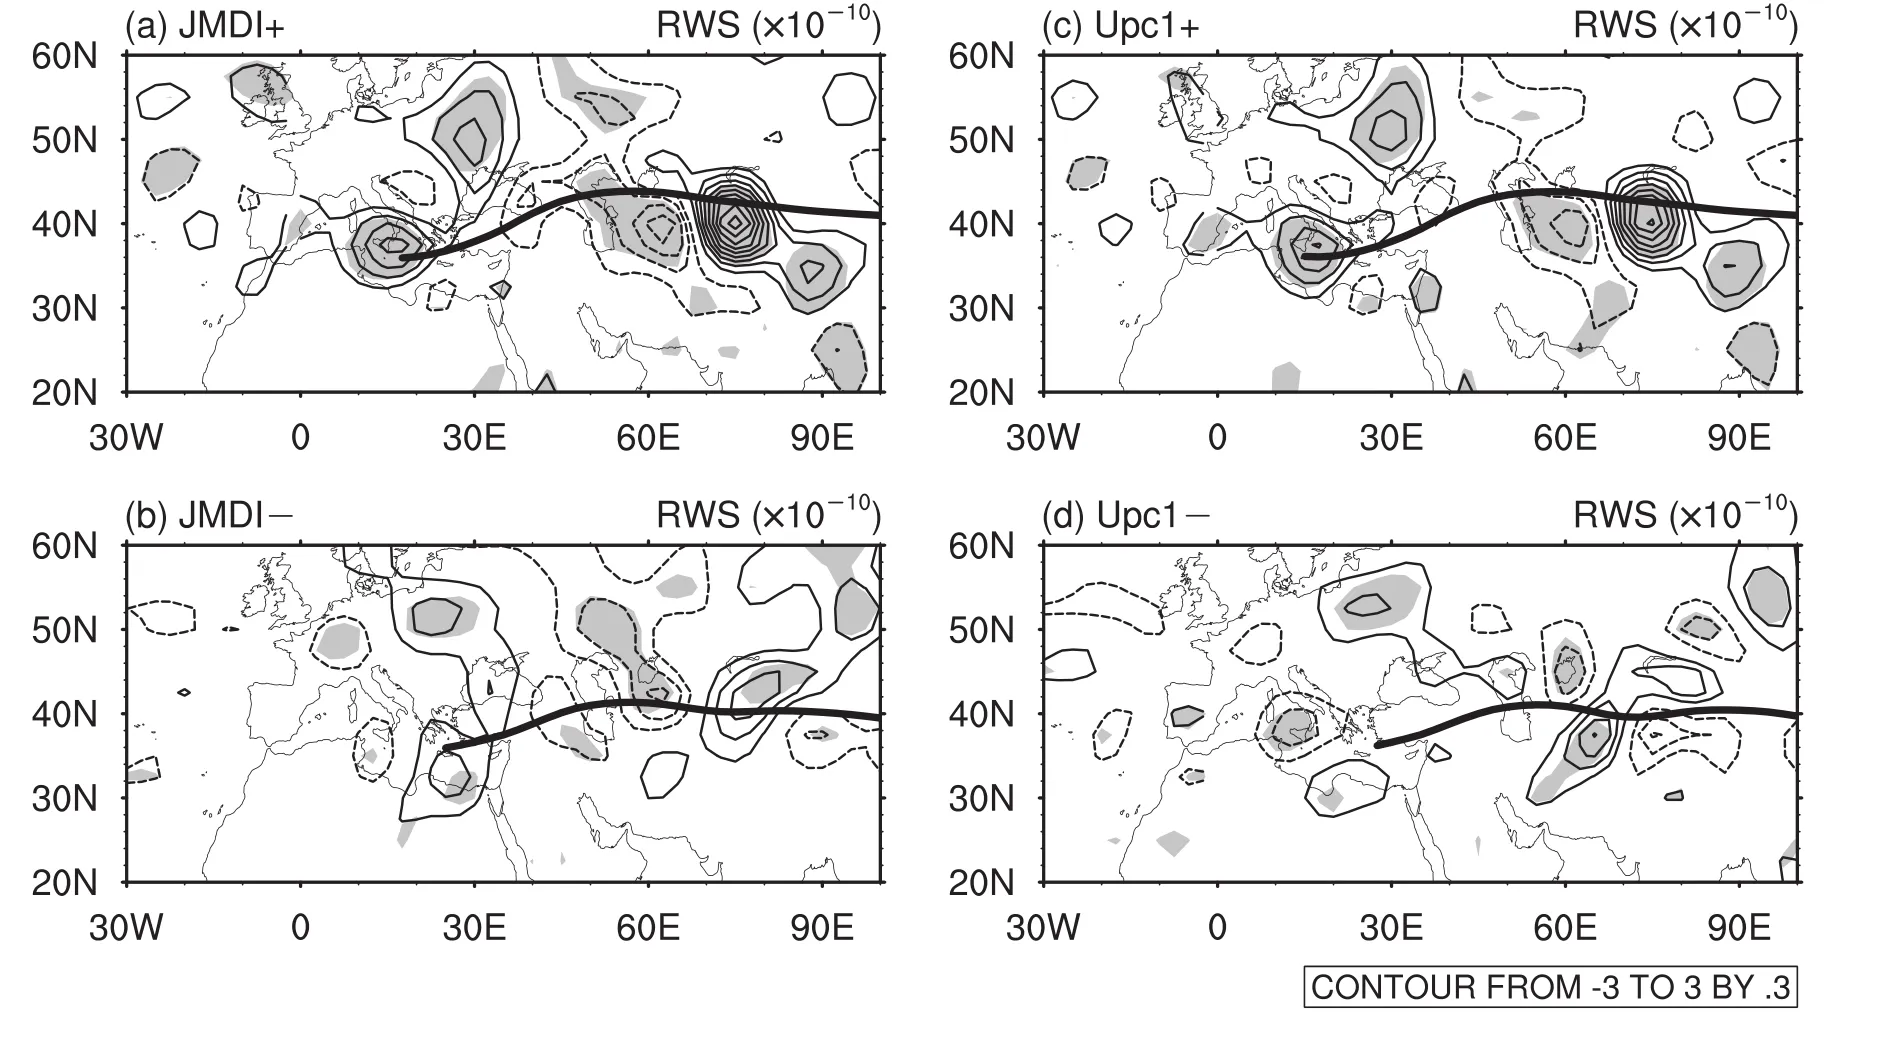
Fig.5.As in Figs.1c–d and Figs.2c–d but for the JJA mean RWS anomalies at 200 hPa(contours;units:10?10s?2).Contour intervals are 0.3×10?10s?2,and zero contours are omitted.Thick lines delineate the jet axes for the(a,c)northward and(b,d)southward JMD cases,respectively,which are determined by the maximum zonal wind being greater than 25 m s?1.
Figure 5 shows the composite 200-hPa RWS(Sardeshmukh and Hoskins,1988)anomalies,based on the JMD indexes.In the above expression,f and ζ are the planetary vorticity and relative vorticity,respectively;denotes the divergent component of horizontal winds.
The most prominent feature of the RWS for the JMD+cases is the significant anomalies over Central Asia:negative anomalies to the east of the Caspian Sea and positive ones to the south of the Lake Balkhash.There are also positive anomalies over the Mediterranean Sea and eastern Europe.These RWS anomalies are very similar to the SRP-related anomalies(Fig.6),and thus it can be deduced that the SRP is effectively triggered in northward JMD years and results in the close JMD–SRP connection.It should be mentioned that the SRP-related RWS anomalies are basically opposite in sign between the positive and negative SRPI years,so we show in Fig.6 the differences between the positive and negative years.In comparison with the JMD+cases,the RWS anomalies for the JMD?cases(Fig.5b)are much weaker and tend to be of the same sign,which may be associated with the negative correlation coefficient between the JMDI and SRPI when the JMDI is negative.On the other hand,the weak RWS anomalies for these cases suggest much less efficiency in the triggering of the SRP and the resultant JMD–SRP relationship.Results for the Upc1+composite(Fig.5c)present a high degree of similarity with those for the JMDI+composite(Fig.5a),in terms of both distribution and intensity.However,the distribution for the Upc1?cases(Fig.5d)appears much more chaotic.The noisy RWS anomalies for the southward JMD cases(Figs.5b and d)are possibly related to the smaller spatial consistency between the southward JMD cases than the northward cases.
The RWS can be rewritten as

Here,we ignore the small terms of vorticity tendency,vertical advection and twisting.Dχis the divergence and β =df/dy.
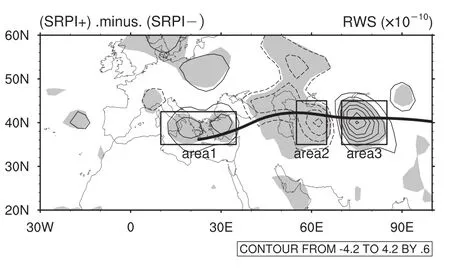
Fig.6.Composite differences in the JJA mean 200-hPa RWS anomalies(contours;units:10?10s?2)between the maximum 14 and minimum 14 SRPI years.Contour intervals are 0.6×10?10s?2,and zero contours are omitted.Shading indicates regions of statistical significance at the 0.05 level,according to the Student’s t-test.The three boxes denote domains where the SRP-related RWS anomalies are most significant.The thick line delineates the climatological jet axis,which is determined by the maximum zonal wind being greater than 25 m s?1.
Although we analyzed the horizontal distribution of each RWS term,for brevity we only show the values averaged over three domains(boxes in Fig.6),i.e.,(35°–42.5°N,10°–35°E),(35°–45°N,55°–65°E)and(35°–45°N,70°–85°E),to estimate the relative contribution of the four RWS terms.These values are shown in Fig.7.It is evident that,for both the JMDI+and Upc1+cases,term1,i.e.,the planetary vortex stretching term ?fDχ,plays the primary role in determining the RWS,for all three domains(Figs.7a and c).Term2 and term4,i.e.,?ζDχand ?Vχ·?ζ,also contribute to the RWS,but they are much weaker than term1.On the other hand,the values for the southward JMD cases are much weaker(Figs.7b and d),particularly for the Upc1?cases.The RWS anomalies for the JMDI?cases tend to be in phase with those for the northward JMD cases(Fig.7b),and those for the Upc1? cases are much weaker—consistent with the meridional wind anomalies shown in Figs.1 and 2.

Fig.7.Domain-averaged values of the four terms of the JJA mean RWS anomalies at 200 hPa for the(a)positive JMDI cases,(b)negative JMDI cases,(c)positive Upc1 cases,and(d)negative Upc1 cases.
Therefore,we focus on the anomalies of the planetary vortex stretching term(?fDχ)and show their horizontal distribution in Fig.8.significant and positive anomalies appear to the south of the Lake Balkhash,the Mediterranean Sea and eastern Europe,and negative anomalies appear around the Caspian Sea,for the northward JMD cases(Figs.8a and c).These anomalies resemble the RWS anomalies well in both distribution and intensity,con fi rming?fDχis the term that contributes most to the RWS,as shown in Fig.7.The?fDχanomalies are much weaker for the southward JMD cases(Figs.8b and d).

Fig.8.As in Fig.5 but for anomalies in term1 of the RWS.
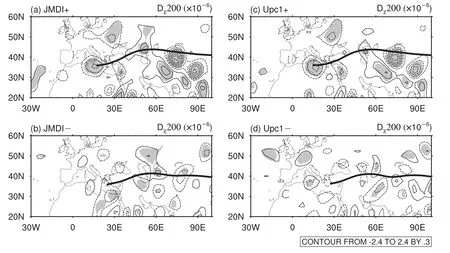
Fig.9.As in Fig.5 but for anomalies in the JJA mean 200-hPa divergence(contours;units:10?6s?1).
The planetary vortex stretching term is determined by the divergence,although can be modified by the planetary vorticity.Therefore,200-hPa divergence anomalies play a crucial role in inducing the asymmetry in the JMD–SRP relationship.The upper-tropospheric divergence anomalies are generally associated with precipitation anomalies through ascent or de-scent.Therefore,we analyzed the precipitation anomalies for the northward JMD cases,and found that there are negative anomalies in Central Asia(not shown).The region for these negative precipitation anomalies includes both anomalous convergence and divergence,shown in Figs.9a and c.Thus,the relationship between divergence and precipitation anomalies may be complicated in Central Asia,where the amount of climatological rainfall is generally light.The reason for 200-hPa divergence anomalies requires further investigation.
5.Conclusions and discussion
In this study,we have carried out further investigation into the relationship between the JMD and SRP in summer,which had been earlier identified by Hong and Lu(2016).The present results indicate that the JMD–SRP relationship is asymmetric:the SRP becomes stronger with a more northward JMD,resulting in a significant JMD–SRP relationship.However,the relationship is weak in southward JMD years.This asymmetric relationship is confirmed by the correlation coefficients between the indexes of JMD and SRP in northward and southward JMD years,which are 0.60 and?0.16 with respect to JMDI–SRPI,and 0.62 and ?0.04 with respect to Upc1–SRPI(Upc1 being another indicator quantifying the JMD),during the analysis period of this study(1958–2014).Due to this asymmetry of the relationship,the uppertropospheric zonal wind anomalies are much stronger in West Asia and East Asia and weaker in Central Asia for northward JMD years,but tend to be not well-organized for southward JMD years.
Further results suggest that northward JMD years correspond to much stronger RWS anomalies,which are primarily determined by the planetary vortex stretching term?fDχ,around the entrance of the Asian jet.specifically,there are significant positive anomalies to the south of Lake Balkhash and over the Mediterranean Sea,and negative anomalies to the east of the Caspian Sea—closely coherent with those associated with the SRP.However,the RWS anomalies are much weaker and not well-organized for southward JMD years. Therefore,we conclude that the RWS anomalies around the entrance of the Asian jet play a crucial role in inducing the asymmetry of the JMD–SRP relationship.
However,the mechanisms responsible for the asymmetry of the RWS or vortex stretching term ?fDχanomalies between northward and southward JMD years,remain unknown.This may be related to the internal processes between the JMD and RWS,but possibly also to the greater spatial coherence between northward JMDs than the southward ones.In addition,the asymmetry in the relationship between the JMD and SRP implies that their impacts on climate anomalies may also be distinct between positive and negative JMDI/SRPI years.These issues require further investigation in future studies.
Acknowledgements.We thank the two anonymous reviewers for their comments,which triggered the results shown in section 4 and helped considerably in improving the expression of our findings.This work was supported by the National Natural Science Foundation of China(Grant Nos.41320104007,41421004,and 41731177).
Chen,G.S.,and R.H.Huang,2012:Excitation mechanisms of the teleconnection patterns affecting the July precipitation in Northwest China.J.Climate,25,7834–7851,https://doi.org/10.1175/JCLI-D-11-00684.1.
Du,Y.,T.Li,Z.Q.Xie,and Z.W.Zhu,2016:Interannual variability of the Asian subtropical westerly jet in boreal summer and associated with circulation and SST anomalies.Climate Dyn.,46,2673–2688,https://doi.org/10.1007/s00382-015-2723-x.
Enomoto,T.,B.J.Hoskins,and Y.Matsuda,2003:The formation mechanism of the Bonin high in August.Quart.J.Roy.Meteor.Soc.,129,157–178,https://doi.org/10.1256/qj.01.211.
Hong,X.W.,and R.Y.Lu,2016: The meridional displacement of the summer Asian jet,Silk Road Pattern,and tropical SST anomalies.J.Climate,29,3753–3766,https://doi.org/10.1175/JCLI-D-15-0541.1.
Kalnay,E.,and Coauthors,1996:The NCEP/NCAR 40-year reanalysis project.Bull.Amer.Meteor.Soc.,77,437–471,https://doi.org/10.1175/1520-0477(1996)077<0437:TNYRP>2.0.CO;2.
Kosaka,Y.,H.Nakamura,M.Watanabe,and M.Kimoto,2009:Analysis on the dynamics of a wave-like teleconnection pattern along the summertime Asian jet based on a reanalysis dataset and climate model simulations.J.Meteor.Soc.Japan,87,561–580,https://doi.org/10.2151/jmsj.87.561.
Lin,Z.D.,and R.Y.Lu,2016:Impact of summer rainfall over southern-central Europe on the circumglobal teleconnection.Atmospheric Science Letters,17,258–262,https://doi.org/10.1002/asl.652.
Lu,R.-Y.,J.-H.Oh,and B.-J.Kim,2002:A teleconnection pattern in upper-level meridional wind over the North African and Eurasian continent in summer.Tellus A,54,44–55,https://doi.org/10.1034/j.1600-0870.2002.00248.x10.3402/tellusa.v54i1.12122.
Sardeshmukh,P.D.,and B.J.Hoskins,1988:The generation of global rotational fl ow by steady idealized tropical divergence.J.Atmos.Sci.,45,1228–1251,https://doi.org/10.1175/1520-0469(1988)045<1228:TGOGRF>2.0.CO;2.
Sato,N.,and M.Takahashi,2006:Dynamical processes related to the appearance of quasi-stationary waves on the subtropical jet in the midsummer northern hemisphere.J.Climate,19,1531–1544,https://doi.org/10.1175/JCLI3697.1.
Wei,W.,R.H.Zhang,M.Wen,and S.Yang,2017:Relationship between the Asian westerly jet stream and summer rainfall over Central Asia and North China:Roles of the Indian monsoon and the South Asian High.J.Climate,30,537–552,https://doi.org/10.1175/JCLI-D-15-0814.1.
Yasui,S.,and M.Watanabe,2010:Forcing processes of the summertime circumglobal teleconnection pattern in a dry AGCM.J.Climate,23,2093–2114,https://doi.org/10.1175/2009JCLI3323.1.
 Advances in Atmospheric Sciences2018年4期
- Advances in Atmospheric Sciences的其它文章
- Report on IAMAS Activity since 2015 and the IAPSO-IAMAS-IAGA Scientific Assembly—Good Hope for Earth Sciences
- Impact of SST Anomaly Events over the Kuroshio–Oyashio Extension on the “Summer Prediction Barrier”
- Idealized Experiments for Optimizing Model Parameters Using a 4D-Variational Method in an Intermediate Coupled Model of ENSO
- Variations in High-frequency Oscillations of Tropical Cyclones over the Western North Pacific
- Large-scale Circulation Control of the Occurrence of Low-level Turbulence at Hong Kong International Airport
- Evaluating the Capabilities of Soil Enthalpy,Soil Moisture and Soil Temperature in Predicting Seasonal Precipitation
