Large-scale Circulation Control of the Occurrence of Low-level Turbulence at Hong Kong International Airport
Marco Y.T.LEUNG,Wen ZHOU?,Chi-Ming SHUN,and Pak-Wai CHANGuy Carpenter Asia-Pacific Climate Impact Center,School of Energy and Environment,City University of Hong Kong,Hong Kong,China
2Hong Kong Observatory,Hong Kong,China
1.Introduction
Hong Kong International Airport(HKIA)handles more than 68 million passengers and 4 million tons of air cargo annually,and is one of the busiest airports in the world.It handles around 1100 flights per day.Hence,aviation safety during aircraft departure and landing is important.As shown in Fig.1,HKIA is located north of Lantau Island.The island has complex topography,with elevation varying from around mean sea level to almost 1000 m above mean sea level.This disrupts the wind passing over the island.
To monitor the low-level turbulence around HKIA—in particular over the approach and departure corridors of the airport—the Hong Kong Observatory operates a Doppler Light Detection and Range(LIDAR)system at HKIA,as presented in Fig.1.It measures the radial component of wind with a 2-μm laser beam.The LIDAR data are applied to calculate the cubic root of the eddy dissipation rate(EDR1/3),which is widely used to measure turbulence intensity.More details about the LIDAR-based EDR1/3at HKIA can be found in Chan(2011)and Hon and Chan(2014).
It has been found that the regional climate variation over Hong Kong is subject to variation in large-scale circulation(Cheung et al.,2015;Li et al.,2015;Zhou et al.,2017).This suggests that regional wind direction and speed in Hong Kong are modulated by large-scale circulation.Therefore,the occurrence and frequency of low-level turbulence at HKIA are possibly controlled by variation in the atmospheric circulation.However,the linkage between large-scale circulation and regional turbulence generation has not been investigated in previous studies.So,one of the objectives of this study is to identify the atmospheric circulation that is favorable for the occurrence of low-level turbulence.Furthermore,the atmosphere shows variation at different timescales(Lau and Li,1984;Webster et al.,1998),which affects the frequency of low-level turbulence.Therefore,another objective of this study is to clarify the contributions of seasonal,intraseasonal,and synoptic variation to the occurrence of low-level turbulence.
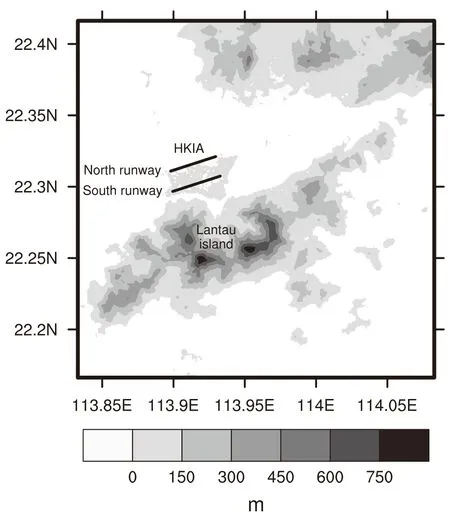
Fig.1.Map of HKIA and surrounding topography.Elevation values are from SRTM 90-m data(Jarvis et al.,2008).
The rest of this study is organized as follows:Section 2 presents the data employed in this study and the definitions of turbulence and nonturbu-lence cases.Section 3 shows the atmospheric circulation corresponding to turbulence occurrence and the contributions by forcing at different timescales.Finally,a discussion and summary are provided in section 4.
2.Data and methodology
In this study,glide-path scans of LIDAR data along two runways(north and south)at HKIA from 2014 to 2015 are employed(Fig.1).They are obtained during the scanning of the LIDAR over the arrival glide paths of the airport.The coverage goes from the ground near the runway threshold to 4 nautical miles(7.4 km)away from the threshold,which represents altitudes below approximately 388 m MSL for the 3°glide slope.The time interval between the scans of the LIDAR is around 2 min.Based on the LIDAR measurements,the cubic root of the eddy dissipation rate(EDR1/3)can be calculated.This is used to measure turbulence intensity.
We define the occurrence of low-level turbulence as any value of EDR1/3along the runway larger than or equal to 0.3 m2/3s?1.Subsequently,we calculate the possibility of turbulence occurrence(PTO)as follows:

Nevertheless,the time interval between LIDAR observations is not constant,and there are missing data in the observations.Thus,we exclude the PTO cases with fewer than 450 observations along the north or south runways in one day.The remaining PTO cases along the two runways are illustrated in Fig.2.It should be noted that the values of PTO from the southern runway are remarkably higher than those from the north runway.Both runways also demonstrate notable seasonal variation in values of PTO;the values are remarkably higher in spring than in other seasons.
We define the turbulence and nonturbu-lence cases based on the values of PTO.Turbulence cases are those with PTO values≥0.2 on either the north or south runway.nonturbu-lence cases are those with PTO values=0 on both runways.To avoid double counting the turbulence and nonturbu-lence cases,any cases with a time difference of under two days are considered as one case.Subsequently,37 turbulence and 52 nonturbu-lence cases are identified over the two-year period.
To present the state of large-scale circulation associated with turbulence and nonturbu-lence cases,different parameters in ERA-Interim data are employed,including geopo-tential(Φ),temperature(T),zonal wind(U),and meridional wind(V)(Dee et al.,2011).Additionally,we utilize the radiosonde data recorded from King’sPark Meteorological Station,to verify the result based on the ERA-Interim data.It should be noted that the radiosonde data at 0000 and 1200 UTC are averaged to be daily values.
3.Results
To investigate the circulation conditions favorable for the occurrence of low-level turbulence,we calculate the composite difference between the turbulence and nonturbu-lence cases for horizontal wind and geopo-tential at 850 hPa,as presented in Fig.3.The 850-hPa level is chosen because it is near the top of the boundary layer height in Hong Kong(around 1 to 1.5 km normally)and it is readily available from the reanalysis data.The composite difference for horizontal wind shows a cyclonic center in South China.To clarify the importance of wind direction on occurrence of the turbulence,the horizontal is divided into zonal and meridional components.For zonal wind,the composite difference between turbulence and nonturbu-lence cases at 850 hPa shows a significant westerly wind in the southeast of the Tibetan Plateau(Fig.3b).However,the zonal wind difference is weak around the South China coast.This implies that zonal wind is unlikely to be the cause of low-level turbulence.For meridional wind,the composite difference delineates significant southerly wind over the subtropical western Pacific and Southeast Asia.It shows a maximum center around the South China coast(Fig.3c).Hence,the southerly wind is remarkably stronger in turbulence cases than in nonturbu-lence cases.Accordingly,variation in the strength of the southerly is directly related to the occurrence of turbulence.
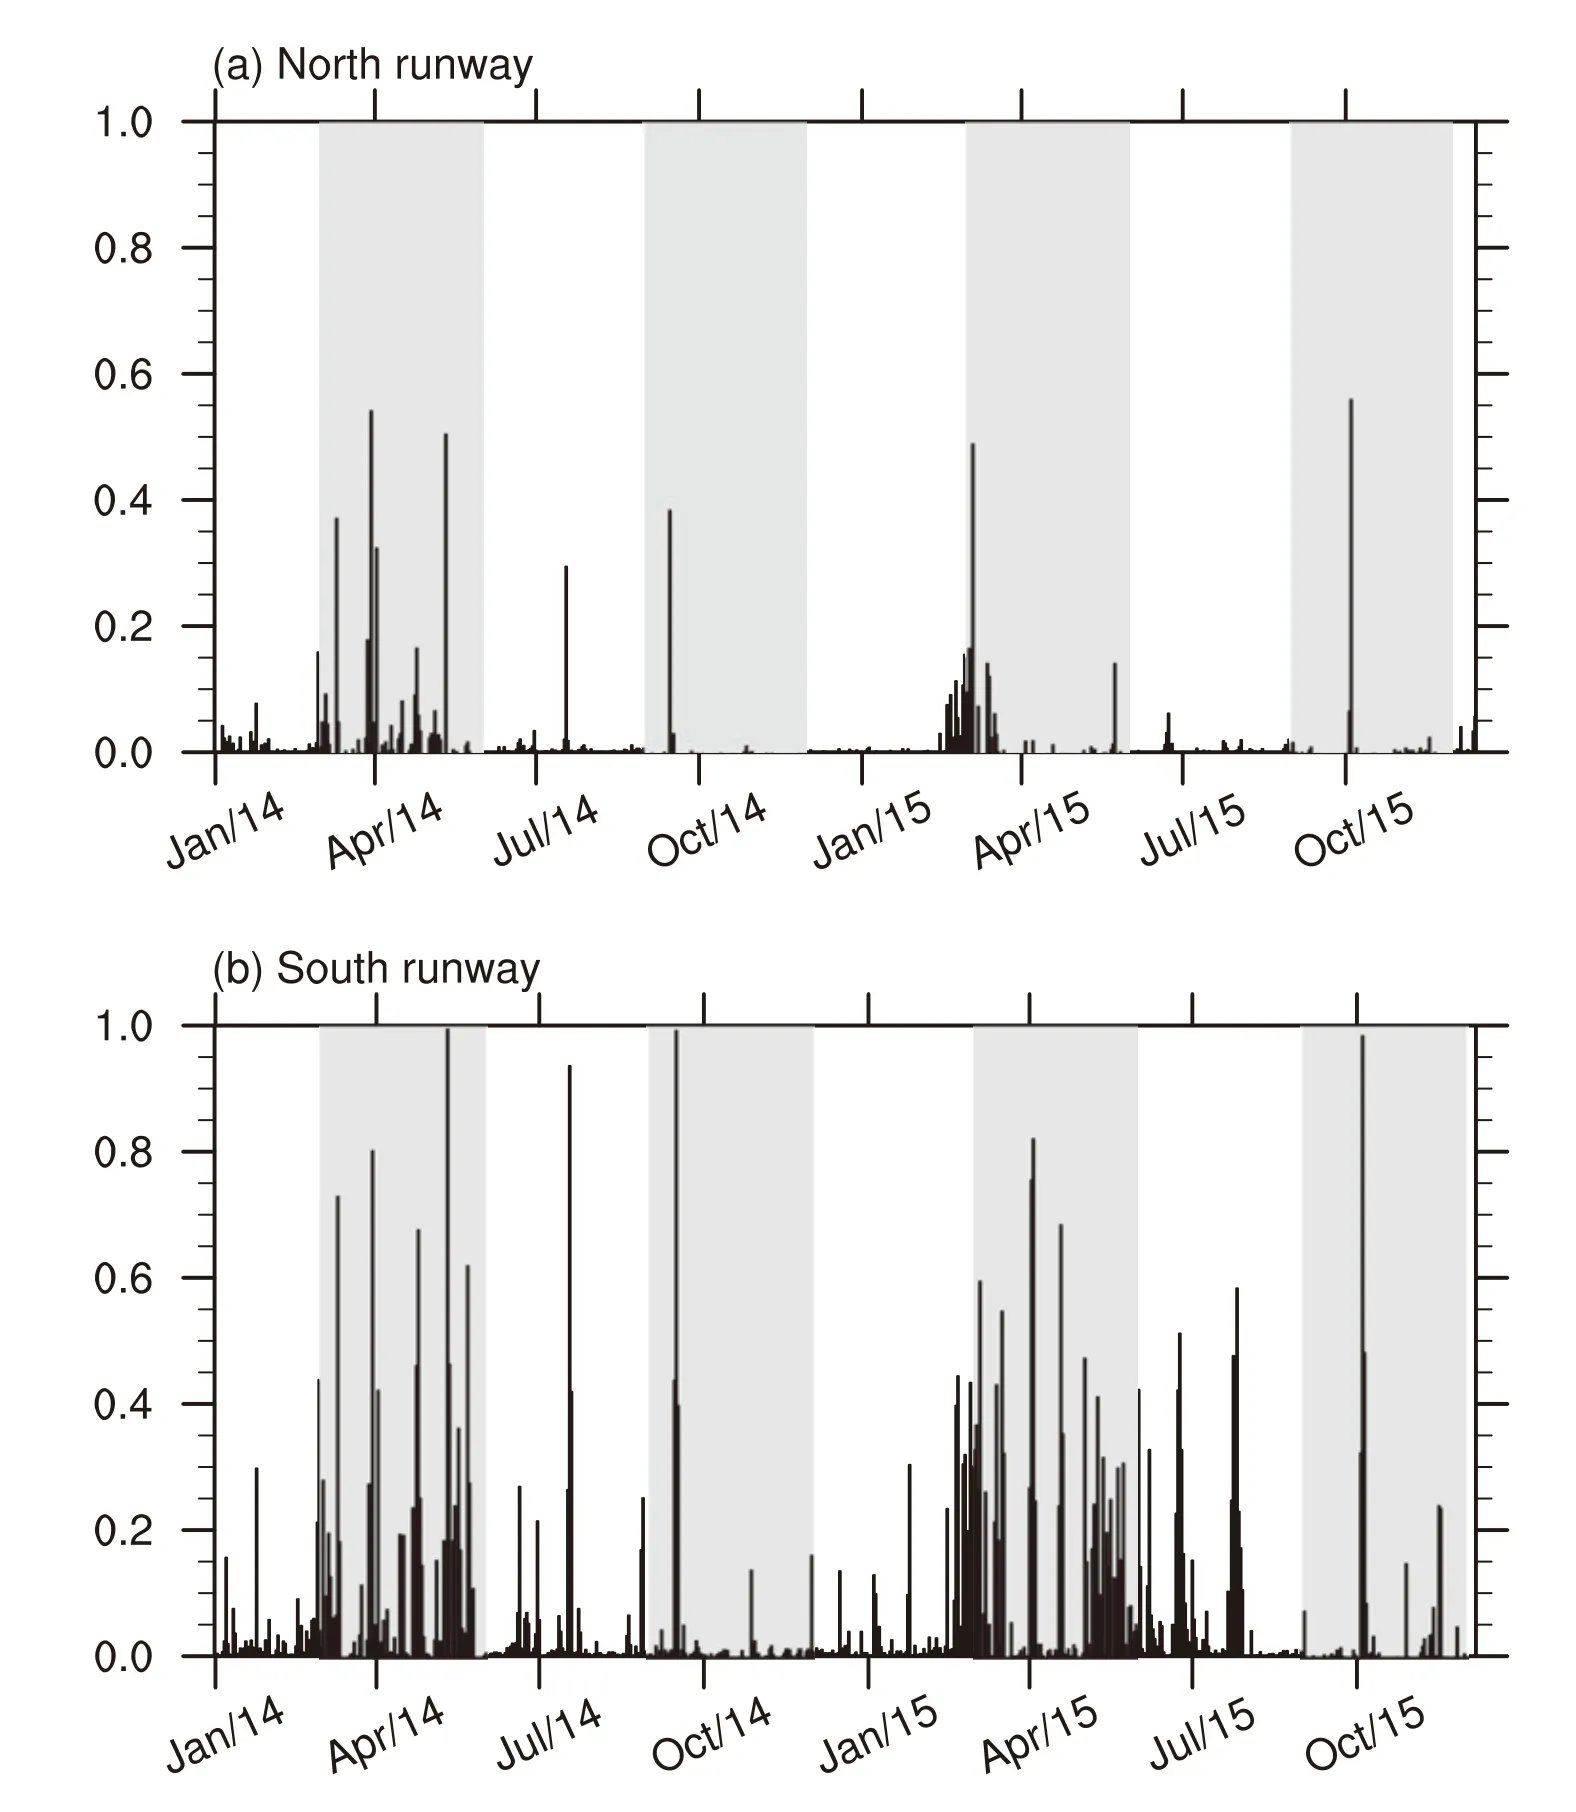
Fig.2.Possibility of turbulence occurrence along the(a)north and(b)south runway.Transitional seasons(spring and autumn)are indicated by gray shading.
In association with the difference in horizontal wind over Southeast Asia and the tropical western Pacific,we also calculate the geopo-tential difference between turbulence and nonturbu-lence cases(Fig.3d).A negative and a positive center of geopo-tential difference are found south of the Tibetan Plateau and the subtropical western Pacific,respectively.Hence,westerly wind differences are located south of the negative center and southerly wind differences are located between the negative and positive centers,because of geostrophic balance.Therefore,the negative center is linked to the occurrence of low-level turbulence through its modulation of meridional wind over the South China coast.
Since the southerly anomaly over the South China coast is possibly contributed by a combination of seasonal(>90 days),intraseasonal(90–10 days),and synoptic(< 10 days)forcing,we separate these forcings with a Lanczos filter(Duchon,1979).This filter is commonly used in temporalscale separation(Li and Zhou,2015;Li et al.,2015;Leung and Zhou,2016;Leung et al.,2017).The weight of the filter is 90 days.
The composite differences between turbulence and nonturbu-lence cases in seasonal,intraseasonal,and synoptic horizontal wind are portrayed in Fig.4.For zonal wind at 850 hPa,it is noted that the significant westerly wind difference southeast of the Tibetan Plateau is contributed by the seasonal and intraseasonal signal(Figs.4a and b).It should be noted that the significant seasonal westerly difference is off-set by the significant synoptic easterly difference around the South China coast(Figs.4a and c).This results in a weak zonal wind difference between turbulence and nonturbu-lence cases(Fig.3a).For meridional wind,the southerly wind is contributed mainly by the intraseasonal signal and followed by the synoptic signal.Despite a relatively weak contribution by the seasonal signal,Fig.2 strongly suggests that this is still a possible cause of the seasonal variation in the frequency of turbulence.Consequently,the southerly wind difference at seasonal,intraseasonal,and synoptic timescales is also important to the occurrence of low-level turbulence.

Fig.3.Composite difference between turbulence and nonturbu-lence cases for(a)horizontal wind(units:m s?1),(b)zonal wind(units:m s?1),(c)meridional wind(units:m s?1),and(d)geopo-tential,at 850 hPa(units:m2s?2).Red(blue)shading in(b–d)indicates positive(negative)values exceeding the 0.05 significance level.Values under the ground surface are shaded gray.The location of HKIA is indicated by the gray dot.
To explain the synoptic southerly wind difference between turbulence and nonturbu-lence cases,we examine the synoptic geopo-tential difference in the middle and lower troposphere(Fig.5).Leading to the occurrence of turbulence,an eastward-propagating wave train of positive and negative geopo-tential is noted in the mid-troposphere(500 hPa)over East Asia,as illustrated in the upper panel of Fig.5.Another wave train of geopo-tential is noted in the lower troposphere(850 hPa),as shown in the lower panel of Fig.5.It also shows a slight phase-lead to the wave train in the midtroposphere.The westward tilting with height of positive and negative geopo-tential centers represents the baroclinic structure of extratropical cyclones and anticyclones.Accordingly,the synoptic southerly wind difference is caused by the passage of temperate cyclones and anticyclones.
Intraseasonal geopo-tential differences between turbulence and nonturbu-lence cases in the middle and lower troposphere are presented in Fig.6.In the mid-troposphere,the intraseasonal geopo-tential differences are not significant(upper panel of Fig.6).On the contrary,a positive center of geopo-tential difference is observed in the lower troposphere over the subtropical western Pacific,as shown in the lower panel of Fig.6.This positive center is possibly related to the intraseasonal variation of the western North Pacific subtropical high that steers the southerly wind at its western flank.Therefore,the intraseasonal southerly wind difference is associated with a stronger western flank of the western North Pacific subtropical high.
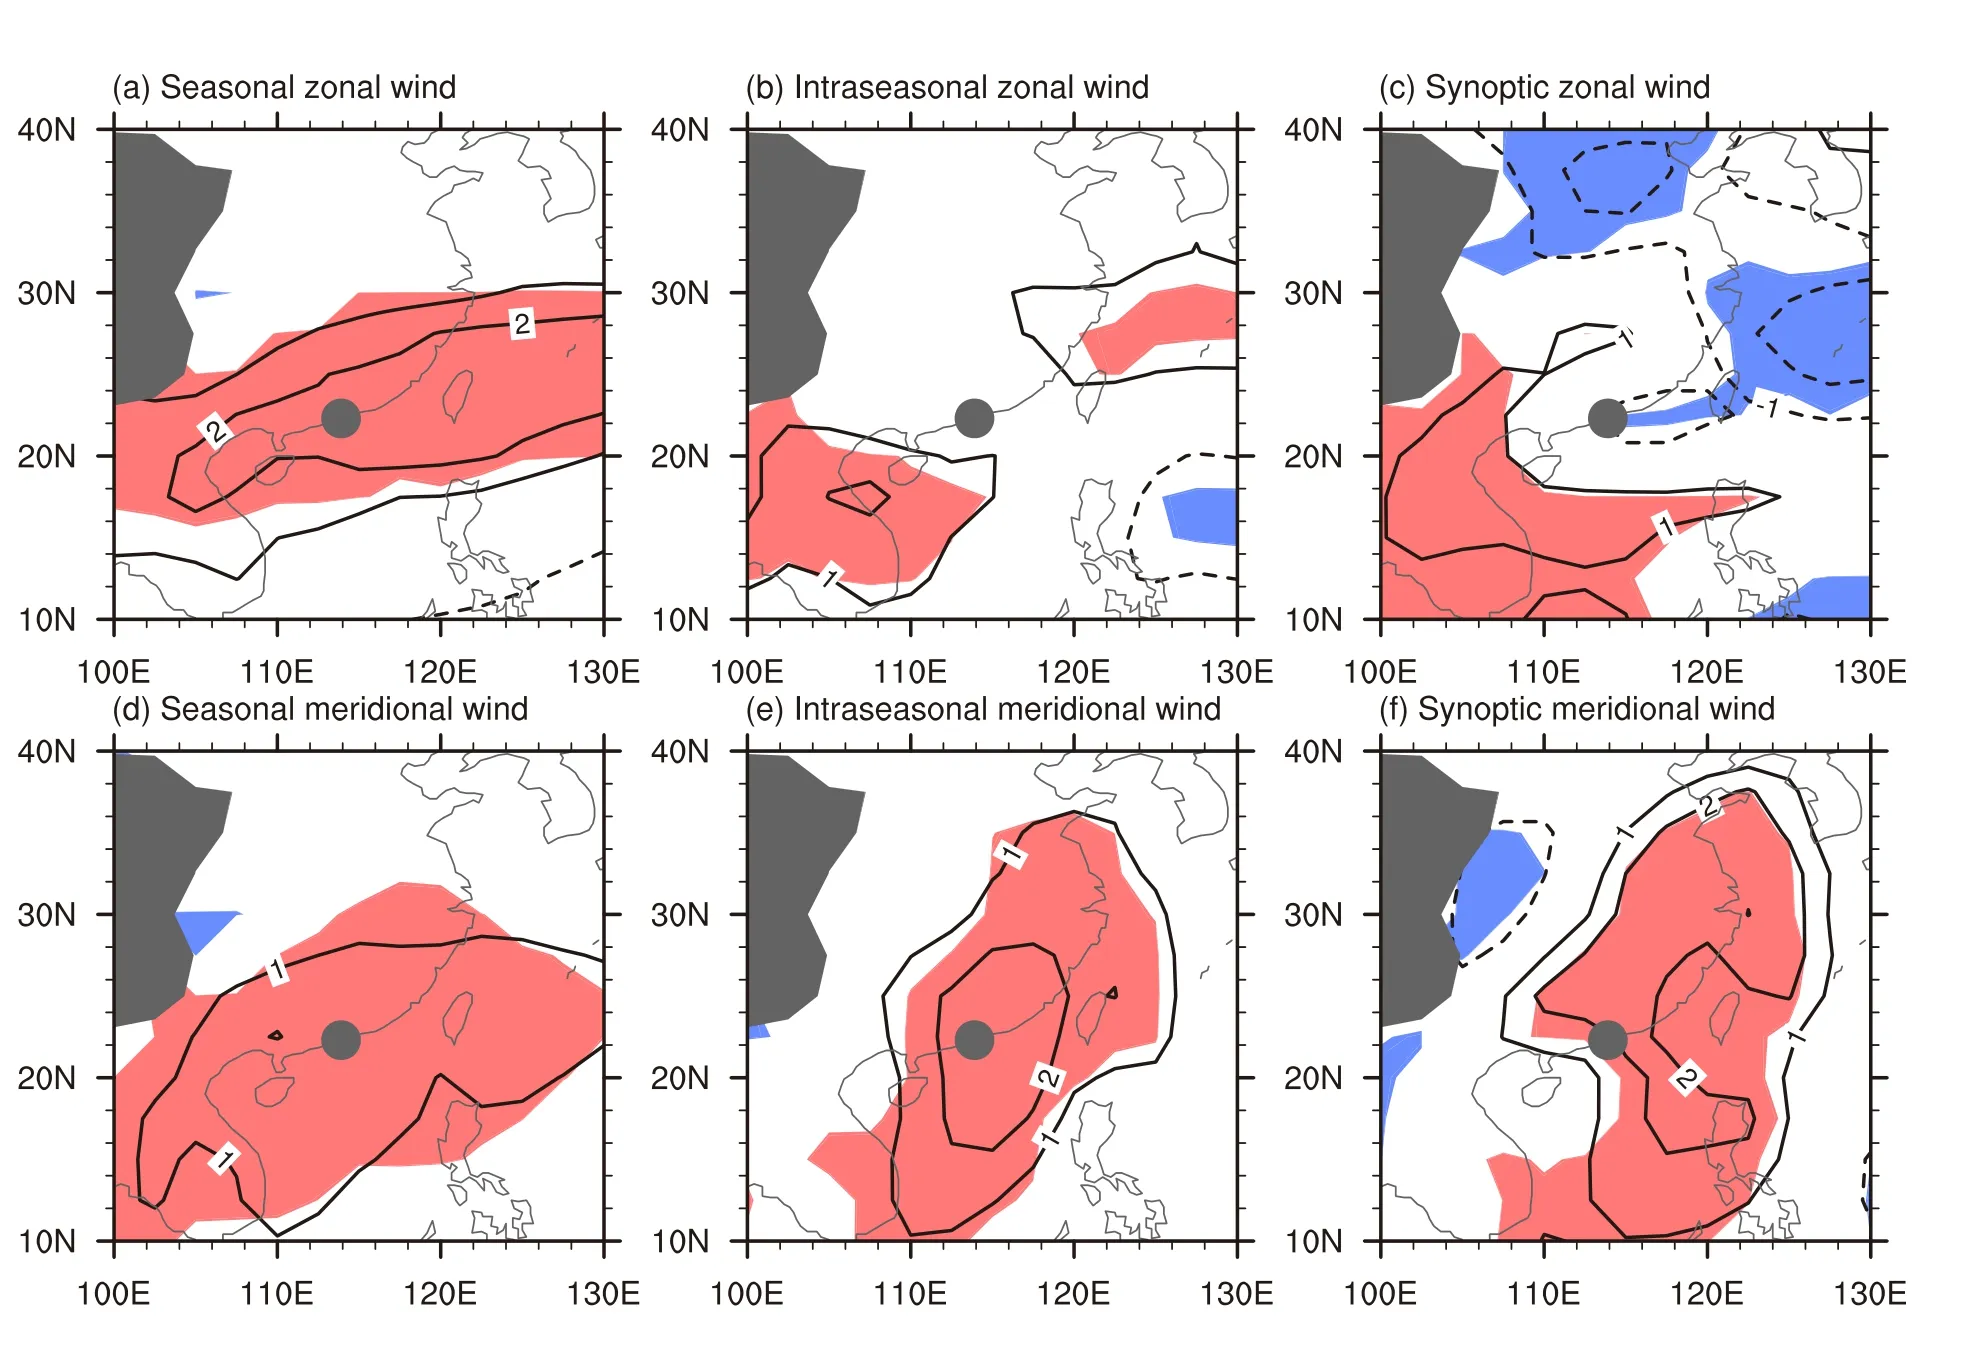
Fig.4.Composite difference between turbulence and nonturbu-lence cases for(a)seasonal,(b)intraseasonal,and(c)synoptic zonal winds.(d–f)Similar to(a–c)but for meridional winds.The units for wind are m s?1.Values under the ground surface are shaded gray.The location of HKIA is indicated by the gray dot.
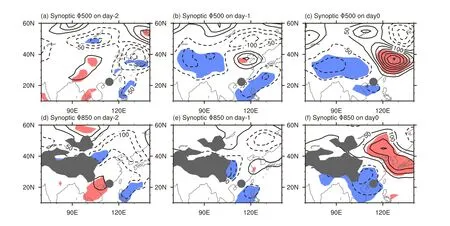
Fig.5.Synoptic difference in geopo-tential at 500 hPa(upper panel;units:m2s?2)and at 850 hPa(lower panel;units:m2s?2)from two days before[day(?2)]to the day of turbulence occurrence[day(0)].Red(blue)shading indicates positive(negative)values exceeding the 0.05 significance level.Values under the ground surface are shaded gray.The location of HKIA is indicated by the gray dot.
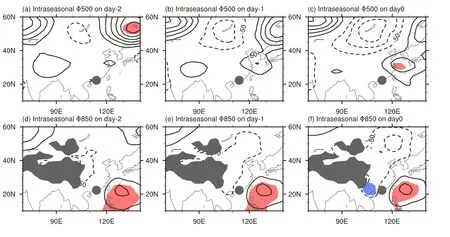
Fig.6.Similar to Fig.5 but for intraseasonal geopo-tential difference.
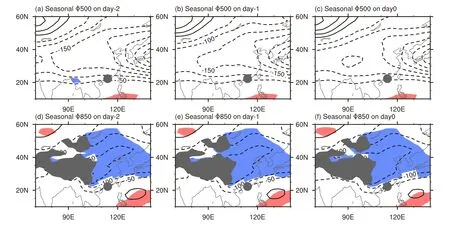
Fig.7.Similar to Fig.5 but for seasonal geopo-tential difference.
The seasonal geopo-tential differences between turbulence and nonturbu-lence cases are displayed in Fig.7.The seasonal differences are weak in the mid-troposphere.In the lower troposphere,a negative center of difference is located on the lee side of the Tibetan Plateau.This negative center contributes to the seasonal southerly wind difference and seasonal variation in the frequency of turbulence.
4.Discussion and summary
The circulation features associated with the occurrence of low-level turbulence at HKIA are documented in this study.It is noted that turbulence occurrence shows strong and weak relations with meridional wind and zonal wind,respectively,over the South China coast.This implies that the turbulence is generated by the passage of wind over the complex topography south of HKIA within the atmospheric boundary layer.It also explains the PTO values being lower along the north runway than along the south runway,because the south runway is closer to the source of turbulence generation.To support the dominant forcing of meridional wind,we also investigate the vertical profile of horizontal wind recorded in the radiosonde data(Fig.8a).Both turbulence and nonturbu-lence cases also demonstrate wind direction change from southeasterly in the lower troposphere to southwesterly in the middle to upper troposphere.However,it is worth noting that an obviously stronger southerly component is found in turbulence cases than in nonturbu-lence cases in the lower troposphere.The zonal and meridional components of horizontal wind for turbulence and nonturbu-lence cases are compared in Fig.8b.The distributions of meridional winds for turbulence and nonturbu-lence cases are well separated.Nonetheless,the distributions of zonal wind are highly overlapping.This is consistent with the result from reanalysis data that turbulence is likely to occur in conjunction with strong southerly wind.In addition,the result based on radiosonde data also suggests that the local southerly wind is possibly controlled by regional southerly wind over the South China coast.

Fig.8.(a)Composite difference in the vertical profile of horizontal wind(units:m s?1)between turbulence and nonturbu-lence cases.(b)Zonal and meridional winds(units:m s?1)for turbulence and nonturbu-lence cases.(c)Vertical profile of dew-point depression for each turbulence case(units:°C;dashed brown line)and nonturbu-lence cases(units:°C;dashed green line).Their mean values are indicated by thick brown and green lines,respectively.(d)Composite difference in dew-point temperature,temperature,and dew-point depression(units:°C).
Apart from the terrain-induced turbulence,it is noted that an increase in static stability will suppress the generation of mechanical turbulence(Romero et al.,1995;Clark et al.,1997).Therefore,we also investigate the local stability based on the records of radiosonde data(Fig.8c).By contrast,the dew-point depression in turbulence cases is generally lower than in nonturbu-lence cases.This implies the air parcel over Hong Kong in turbulence cases is more likely to become saturated in comparison with nonturbu-lence cases.As a result,the stability is weaker in turbulence cases.Since the variations in temperature and dew-point temperature also influence dew-point depression,the differences in temperature and dew-point temperature between turbulence and nonturbu-lence cases are calculated and shown in Fig.8d.It is observed that the difference in temperature for the mean of both cases is weak in contrast to the difference in dew-point temperature.The higher dew-point temperatures in turbulence cases are possibly caused by northward moisture transport from the South China Sea to Hong Kong.Accordingly,southerly wind over South China not only generates terrain-induced turbulence,but also weakens stability that is favorable for the development of strong turbulence.
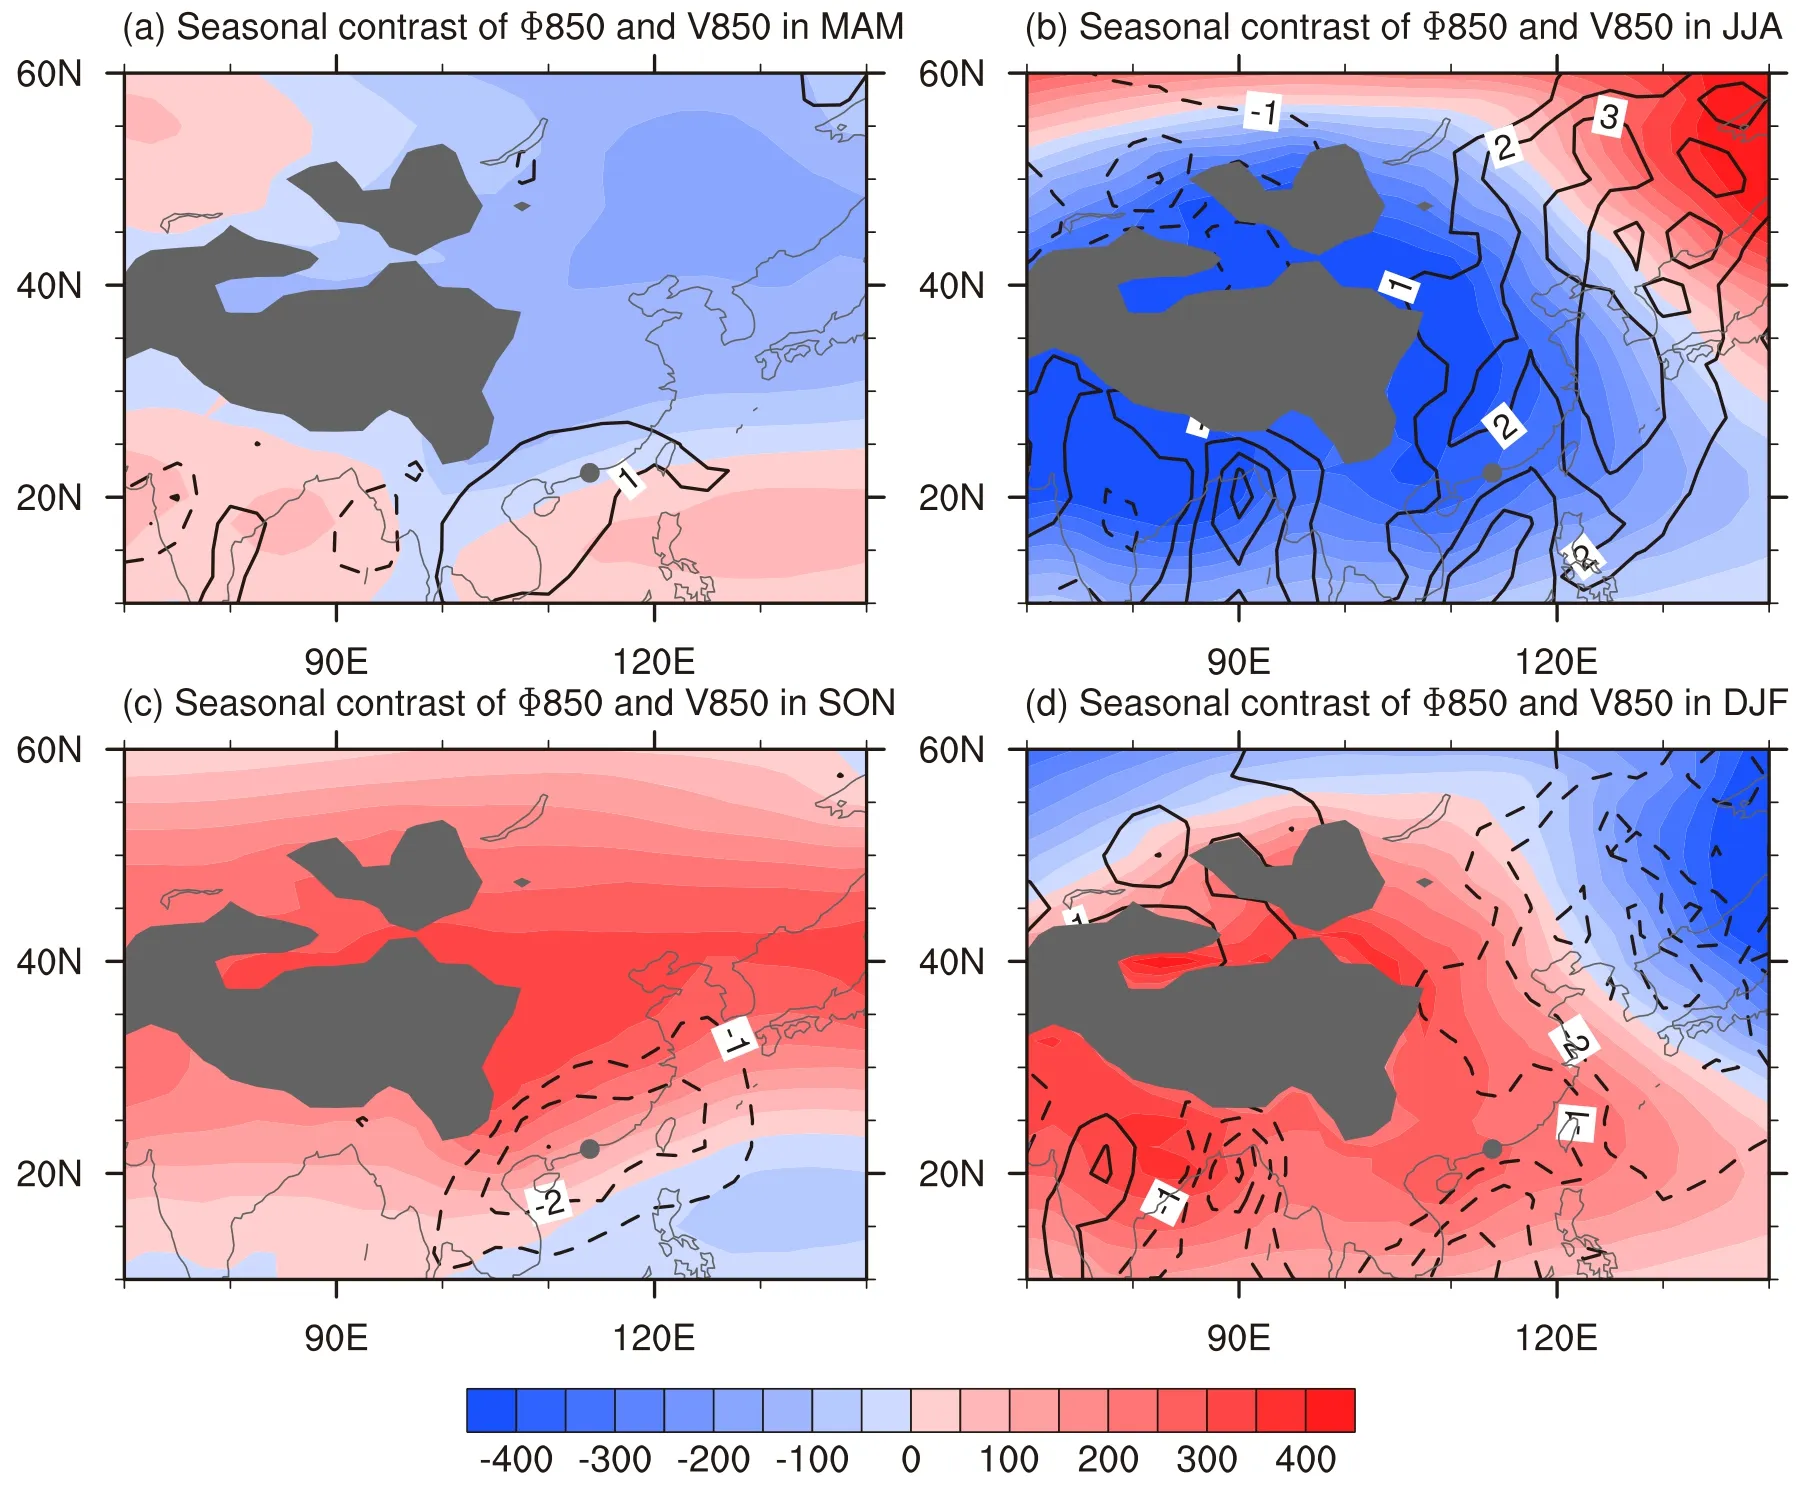
Fig.9.Climatological seasonal contrast(seasonal mean minus annual mean)of Φ850(850-hPa geopo-tential;units:m2s?2;shading)and V850(850-hPa meridional wind;units:m s?1;contours)in(a)MAM(March–May),(b)JJA(June–August),(c)SON(September–November),and(d)DJF(December–February),over the period 1985–2015.Solid(dashed)contours represent positive(negative)values in meridional wind.The units of Φ850 and V850 are m2s?2and m s?1,respectively.Values under the ground surface are shaded gray.The location of HKIA is indicated by the gray dot.
In this study, the variations in meridional wind and geopo-tential are separated into different timescales.We find that seasonal,intraseasonal,and synoptic signals also contribute to the meridional wind difference between turbulence and nonturbu-lence cases.The synoptic and seasonal geopo-tentials show negative values west of the South China coast.The intraseasonal geopo-tential,on the other hand,demonstrates positive values east of the province.As a consequence of these variations in geopo-tential,the zonal geopo-tential gradient is altered,by which geostrophic southerly wind is likely to occur over the South China coast.
We find that different systems in atmospheric circulation are responsible for the variations in geopo-tential at different timescales.For the synoptic timescale,the negative geopo-tentials west of the South China coast are concurrent with the passage of midlatitude extratropical cyclones and anticyclones.For the intraseasonal timescale,the positive geopo-tentials west of the South China coast seem to be related to the intraseasonal variation of the western North Pacific subtropical high.For the seasonal timescale,the negative values east of the Tibetan Plateau modulate southerly wind over Southeast Asia.
As mentioned above,the seasonal variation of geopo-tential east of the Tibetan Plateau is a possible cause of the seasonal variation in the frequency of turbulence.The climatological seasonal contrast in the four seasons for geopo-tential and meridional wind in the lower troposphere is illustrated in Fig.9.Remarkably lower values of geopo-tential are found east of the Tibetan Plateau in spring and summer(Figs.9a and b),and higher values in autumn and winter.Along with this seasonal variation of geopo-tential,a comparably strong southerly is noted in spring and summer and a strong northerly is noted in autumn.Accordingly,the sea-sonal variation of meridional wind is consistent with the seasonal variation of the frequency of turbulence(Fig.2).
Aside from the seasonal variation in geopotential, the seasonal change in the activity of temperate cyclones and anticyclones is another possible cause of the seasonal variation in the frequency of turbulence.According to earlier studies,cyclones and anticyclones occur with higher frequency in transitional seasons(Nakamura,1992;Wang et al.,2009).This supports the occurrence of low-level turbulence in spring and leads to seasonal variation in turbulence occurrence.These studies also noted that the frequency also delineates interan-nual and interdecadal variations.However,the interannual and interdecadal modulation of temperate cyclones and anticyclones on the occurrence of low-level turbulence at HKIA remains unknown.
Apart from the variation in frequency,the variation in the pathways of cyclones and anticyclones is also potentially linked to the occurrence of low-level turbulence.In Leung et al.(2015),major pathways of cyclones and anticyclones were investigated.It was noted that the cyclones and anticyclones along lower-latitude paths lead to stronger impacts on wind and temperature variation over Southeast Asia.This implies that the occurrence of low-level turbulence is possibly subject to the pathways of cyclones and anticyclones.Furthermore,the pathways show a tendency toward an equator ward shift,compared to its climatological location(Zhang and Ding,2012).Consequently,the occurrence of low-level turbulence will possibly enhance along with this shift in pathways in the future.
In addition to temperate cyclones and anticyclones,another possibility for low-level turbulence to occur at HKIA occurs in summertime when Hong Kong is under the influence of tropical cyclones.When a tropical cyclone is located to the west of Hong Kong,which is under the control of strong southerly winds,turbulent air fl ow may occur over the airport due to mechanical turbulence.
This paper represents a preliminary attempt to document the synoptic weather patterns that may be associated with the occurrence of low level turbulence at HKIA.Further studies are still required,e.g.,on the mesoscale features embedded within synoptic patterns,the sensitivity of the results to the choice of the EDR threshold,the use of a larger dataset(over a longer period of time)etc.,to achieve a comprehensive understanding.We expect to carry out such studies and report their results in future publications.
Acknowledgements.This study was supported by National Natural Science Foundation of China(Grant Nos.41675062 and 41375096)and the RGC General Research Fund(Grant No.11335316).
Chan,P.W.,2011:Generation of an eddy dissipation rate map at the Hong Kong International Airport based on Doppler Lidar data.J.Atmos.Oceanic Technol.,28,37–49,https://doi.org/10.10.1175/2010JTECHA1458.1.
Cheung,H.H.N.,W.Zhou,S.-M.Lee,and H.-W.Tong,2015:Interannual and interdecadal variability of the number of Cold days in Hong Kong and their relationship with large-scale circulation.Mon.Wea.Rev.,143,1438–1454,https://doi.org/10.10.1175/MWR-D-14-00335.1.
Clark,T.L.,T.Keller,J.Coen,P.Neilley,H.-M.Hsu,and W.D.Hall,1997:Terrain-induced turbulence over Lantau Island:7 June 1994 tropical storm Russ case study.J Atmos Sci,54,1795–1814,https://doi.org/10.10.1175/1520-0469(1997)054<1795:TITOLI>2.0.CO;2.
Dee,D.P.,and Coauthors,2011:The ERA-Interim reanalysis:configuration and performance of the data assimilation system.Quart.J.Roy.Meteor.Soc.,137,553–597,https://doi.org/10.10.1002/qj.828.
Duchon,C.E.,1979:Lanczos filtering in one and two dimensions.J.Appl.Meteor.,18,1016–1022,https://doi.org/10.10.1175/1520-0450(1979)018<1016:LFIOAT>2.0.CO;2.
Hon,K.K.,and P.W.Chan,2014:Application of LIDAR-derived eddy dissipation rate profiles in low-level wind shear and turbulence alerts at Hong Kong International Airport.Meteorological Applications,21,74–85,https://doi.org/10.10.1002/met.1430.
Jarvis,A.,H.I.Reuter,and E.Guevara,2008:Hole- filled SRTM for the globe Version 4.[Available from CGIAR-CSI SRTM 90m Database,http://srtm.csi.cgiar.org].
Lau,K.-M.,and M.-T.Li,1984:The monsoon of East Asia and its global associations-A survey.Bull.Amer.Meteor.Soc.,65,114–125,https://doi.org/10.10.1175/1520-0477(1984)065<0114:TMOEAA>2.0.CO;2.
Leung,M.Y.-T.,and W.Zhou,2016:Eddy contributions at multiple timescales to the evolution of persistent anomalous East Asian trough.Climate Dyn.,46,2287–2303,https://doi.org/10.10.1007/s00382-015-2702-2.
Leung,M.Y.-T.,H.H.-N.Cheung,and W.Zhou,2015:Energetics and dynamics associated with two typical mobile trough pathways over East Asia in boreal winter.Climate Dyn.,44,1611–1626,https://doi.org/10.10.1007/s00382-014-2355-6.
Leung,M.Y.-T.,H.H.-N.Cheung,and W.Zhou,2017:Meridional displacement of the East Asian trough and its response to the ENSO forcing.Climate Dyn.,48,335–352,https://doi.org/10.10.1007/s00382-016-3077-8.
Li,R.C.Y.,and W.Zhou,2015:Multiscale control of summertime persistent heavy precipitation events over South China in association with synoptic,intraseasonal,and low-frequency background.Climate Dyn.,45,1043–1057,https://doi.org/10.10.1007/s00382-014-2347-6.
Li,R.C.Y.,W.Zhou,and T.C.Lee,2015:Climatological characteristics and observed trends of tropical cyclone-induced rainfall and their influences on long-term rainfall variations in Hong Kong.Mon.Wea.Rev.,143,2192–2206,https://doi.org/10.10.1175/MWR-D-14-00332.1.
Nakamura,H.,1992:Midwinter suppression of baroclinic wave activity in the Pacific.J.Atmos.Sci.,49,1629–1642,https://doi.org/10.10.1175/1520-0469(1992)049<1629:MSOBWA>2.0.CO;2.
Romero,R.,S.Alonso,E.C.Nickerson,and C.Ramis,1995:The influence of vegetation on the development and structure of mountain waves.J.Appl.Meteor.,34,2230–2242,.
Wang,X.M.,P.M.Zhai,and C.C.Wang,2009:Variations in extratropical cyclone activity in northern East Asia.Adv.Atmos.Sci.,26,471–479,https://doi.org/10.10.1007/s00376-009-0471-8.
Webster,P.J.,V.O.Maga?a,T.N.Palmer,J.Shukla,R.A.Tomas,M.Yanai,and T.Yasunari 1998:Monsoons:Processes,predictability,and the prospects for prediction.J.Geophys.Res.,103,14 451–14 510,https://doi.org/10.10.1029/97JC02719.
Zhang,Y.X.,and Y.H.Ding,2012:Interdecadal variations of extratropical cyclone activities and storm tracks in the Northern Hemisphere.Chinese Journal of Atmospheric Sciences,36,912–928,https://doi.org/10.3878/j.issn.1006-9895.2012.11158.(in Chinese)
Zhou,W.,R.C.Y.Li,and E.C.H.Chow,2017:Intraseasonal variation of visibility in Hong Kong.Adv.Atmos.Sci.,34,26–38,https://doi.org/10.10.1007/s00376-016-6056-4.
 Advances in Atmospheric Sciences2018年4期
- Advances in Atmospheric Sciences的其它文章
- Report on IAMAS Activity since 2015 and the IAPSO-IAMAS-IAGA Scientific Assembly—Good Hope for Earth Sciences
- Asymmetric Relationship between the Meridional Displacement of the Asian Westerly Jet and the Silk Road Pattern
- Impact of SST Anomaly Events over the Kuroshio–Oyashio Extension on the “Summer Prediction Barrier”
- Idealized Experiments for Optimizing Model Parameters Using a 4D-Variational Method in an Intermediate Coupled Model of ENSO
- Variations in High-frequency Oscillations of Tropical Cyclones over the Western North Pacific
- Evaluating the Capabilities of Soil Enthalpy,Soil Moisture and Soil Temperature in Predicting Seasonal Precipitation
