
Original Research Paper Validation of kinetic modeling of progesterone release from polymeric membranes
2018-03-12 06:38:26AnaliaIrmaRomeroMercedesVillegasAliciaGracielaCidnicaLilianaParentisElioEmilioGonzoJosMarBermdez
Analia Irma Romero,Mercedes Villegas,Alicia Graciela Cid,Mónica Liliana Parentis,Elio Emilio Gonzo,José María Bermúdez,*
nstituto de Investigaciones para la Industria Química,Universidad Nacional de Salta – Consejo Nacional de Investigaciones Cientí fi cas y Técnicas,Av.Bolivia 5150,Salta Capital 4400,Argentina
cultad de Ingeniería,Universidad Nacional de Salta,Av.Bolivia 5150,Salta Capital 4400,Argentina
1. Introduction
Mathematical modeling in drug release systems,are of utmost importance in their development and optimization.Its importance lies on predict drug release rates as well as their diffusion from the polymer matrix and to elucidate the physical transport mechanisms involved.The practical benefit of an adequate mathematical model is the possibility to foresee the design parameter effects on drug release profiles.
Furthermore,the in vitro study can provide information about the polymer-drug interaction and could be useful as a preliminary stage to predict in vivo behavior[1].That is why mathematical models are steadily increasing in importance in academic and industrial fields,with huge future potential.
However,modeling of drug release is complicated because the properties change over time,as for example the shape of the device,which inf l uence on the dissolution and diffusion of the drug.Nevertheless,numerous delivery systems were characterized using partial differential equations to explain their behavior,using analytical or numerical resolution methods[2–4].
Since the pioneer work of Higuchi[5],several empirical and semi-empirical[6–14],as well as mechanistic realistic models[3,13,15–18]have been developed.The first ones are explicit equations of drug release amount as function of time,while the latter needs to be solved numerically to obtain the amount and rate of drug released.
However,usually the empirical models cannot describe the entire drug release profile,especially those derived from the power law.Furthermore,the predictive capacity of empirical/semiempirical models is often low due to the mathematical treatment is descriptive unlike mechanistic mathematical theories which consider real phenomena such as diffusion,dissolution,erosion,etc.[10,15].
Generally,drug release occurs in three phases.The initial one can be a burst period,where the dissolved drug can pass easily to the release medium,or a lag time.Then the polymer matrix controls the release mechanism.Finally,the release rate of the drug decreases as it is depleted[19].A better understanding of controlled-release mechanisms and improved development of technologies will increase the availability of pharmaceutical products[20,21].
In this work we validate a new model,recently developed and published by our research group[22],for progesterone release from PHB membranes,derived from a second order kinetic expression.This kinetic can lump together the main stages involved in release processes.This new model fits experimental data from t=0(amount of drug released,Mt=0)to t→ ∞ (amount of drug released at equilibrium,Mt→M∞).Moreover,the rate of drug released is easily found.
To validate the model,a statistical analysis was conducted to compare the fitting of our model with six different empirical or semi-empirical models.The Akaike information criterion,which considers the number of experimental data and the number of parameters in a particular model,was used to find the equation that yields the best fit.External mass transfer coefficient and equilibrium constant were determined as well.
2. Materials and methods
2.1. Materials
Powder PHB with a molecular weight around 524,000 g/mol was generously provided by BIOCYCLE?,PHB Industrial S.A.(Brazil)with a purity of 99.5%and moisture content below 0.3%.Chloroform,by Cicarelli(Argentina),was used as solvent and Prg as drug(Farmabase,Rovereto,Italy).
2.2. Membrane synthesis and characterization
Membranes were prepared by the solution-casting technique.A detailed experimental procedure for the membrane preparation was reported in a previous paper of our research group[22].Brief l y,PHB was dissolved in chloroform at 60°C for 4 h under ref l ux and the drug was introduced by direct dispersion.The solution was poured in glass Petri dishes,allowing solvent evaporation at room temperature.Drug content ranged from 23 to 41 wt%.The 41 wt%is the maximum amount of Prg that could be added to the PHB to obtain membranes with homogeneous distribution of Progesterone crystals.Membranes thicknesses(around 110μm)were taken from cross section SEM images[22].
A complete physical,morphological and chemical characterization of PHB-Prg membranes was performed and PHBPrg interactions were corroborated.Prg crystals were distributed throughout the membrane thickness,indicating that the drug incorporation in the film was effective[22].
2.3. Release experiments
The in vitro release data measurements were performed using pre-weighed pieces of 3x4 cm progesterone loaded membranes of 110μm thickness on average,placed in contact with 100 ml of release medium in 250 ml beakers(pH 6.8 phosphate buffer solution),at 32°C and with continuous horizontal stirring in a water bath shaker with controlled temperature.Samples of 3 cm3were withdrawn and the released amount of progesterone was determined using UV–visible spectroscopy(UV-Visible 2100 C)at 245 nm.The sample volume was then immediately returned to the original solution,to keep constant the total volume,not being replaced by fresh medium.This procedure fulfills batch process conditions(constant mass of drug in the system).
2.4. Mathematical analysis
In general,steps involved in drug release processes include drug dissolution,diffusion through the polymeric matrix,eventually polymer swelling or erosion,and transference to the receptor solution at the membrane-f l uid interface.A mathematical model can be proposed only when the physical aspects of the involved phenomenon have been properly established.Evidently,hypotheses and assumptions that have to be made inf l uence on the correspondence between the mathematical model and the phenomenon.
The number of models that can be associated with a specific phenomenon depends on researchers’imagination.However,there is no model able to describe all the issues of a given phenomenon,and actually,in most cases it is not necessary.Moreover,when more general the mathematical model,the calculation expressions become more difficult,complicating their practical application.
It should be also noted that not all the aspects of a particular phenomenon have always the same relative importance.In other words,while in some cases the release kinetic behavior is determined by swelling or erosion of the polymer,in other cases the diffusion and dissolution of the drug may play the major role.In fact,different mechanisms can be occurring at the same time or in stages during the release process.It is important to establish these mechanisms for the successful design and manufacture of controlled release systems and to identify potential failure modes.
Usually,as the model approaches more to reality,it becomes more complex.For this reason,simple equations are used to represent the so-called empirical models,which aim to the description of the macroscopic behavior of a phenomenon,without considering the microscopic aspects.They become useful when first studying a phenomenon,or to compare qualitatively different sets of data obtained in the laboratory.
We have proposed a mathematical mechanism that follows a lumped second-order kinetic,model that we will validate in the present contribution,so it is imperative to consider the model equations[22],which are transcribed below.The drug release rate is directly proportional to the square of the amount of drug available in the membrane at each moment(Eq.1).We found that this model satisfactorily describes processes in which there are various steps involved,and when the drug concentration in the release medium increases steadily[22–25].

where Mtand M∞are the total amount of drug released at time t,and the amount of drug feasible to be released at equilibrium,respectively.By elementary integration of this differential equation,between the initial condition(t=0,Mt=0)and any other(t=t,Mt=Mt),Eq.2 is obtained:

Since,M∞and k1are constant in each experimental run,a general model for the amount of drug released as function of time is:

where

Therefore,using Eq.4 or considering t→∞in Eq.3,results:

By simply deriving Mtversus time in Eq.3,crucial information as the drug release rate,can be obtained:

Eq.3 and Eq.6 can be applied from t=0 to t→ ∞.
2.5. Validation of the new model
Typical engineering tools,such as mathematical models,can be very useful to predict the performance of controlled release systems or to measure some important related parameters,such as the diffusion coefficient of the drug[3,13,15,16].For their application,all phenomena governing the release kinetics should be clearly understood.To validate our model,six different models were applied to assess their capacity in fitting the experimental data.The first mathematical model,based on the diffusion front approach,is that of Higuchi[5].His model,initially conceived for planar systems,was then extended to different geometries and porous systems[26].The model is based on the hypotheses that a)initial drug concentration in the matrix is much higher than drug solubility,b)drug diffusion takes place only in one dimension(edge effects must be negligible),c)solid drug particles are much smaller than system thickness,d)matrix swelling and dissolution are negligible,e)drug diffusivity is constant,and f)perfect sink conditions are always attained in the release environment[10,26].
If a drug is evenly dispersed in a non-degradable polymeric matrix,such as in the case of some membranes,it has to dissolve and then diffuse throughout the polymer to be released in the medium,since the polymer will not erode,or will do it in a long time.

The Higuchi equation,which describes the release transport when it is a diffusion-controlled process,establishes a direct relationship between the release rate and the square root of time[27]:where Mtis the amount of the released drug until time t,A is the release area,D is the drug diffusion coefficient in the polymer matrix,C0is the initial drug concentration in the matrix whereas CSis the drug solubility in the polymer matrix.Interestingly,this model shows that Mtdepends on square root of time and coincides with Fick’s solution when less than 60%of the drug is released[11].
Ritger&Peppas described an empirical and simple equation for the first 60%of the release curve[7],and according to the diffusional exponent value it can be elucidated which release mechanism took place.This model is the so called power law presented by Peppas and coworkers[6,7]:

where a is a constant and n is the diffusional exponent related to the drug release mechanism.It should be noticed that this equation is usually presented as the ratio ofMtM∞,where M∞is the amount of drug released at in fi nite time.However,to compare with our model,the value ofM∞was directly included in the equation’s parameters in Eq.8 and in the following models.
According the geometry,n value in Eq.8 is equal to 0.5 for a thin fi lm,0.45 for a cylinder,and 0.43 for a sphere,when Fickian diffusion takes place[26].If the n value is higher,non-Fickian release takes place.
When the release exponent(n)is equal to 0.5,an equivalent Higuchi equation(Eq.7)is obtained(Eq.9):

Due to its simplicity,this equation is widely used in the pharmaceutical area,however many assumptions were made to arrive to this expression.For this reason,an incorrect diffusion mechanism can be assumed if they are not considered[28].
Values of 0.5<n≤1.0 are indicative of superposition of diffusion and swelling controlled drug release,and an anomalous transport is observed.When n=1.0,it corresponds to a zeroorder release mechanism.
A model that account for the coupled effect of Fickian diffusion and polymer relaxation contribution,is that based on Peppas-Sahlin[29],equation(Eq.10):

where a and b are the kinetic constants related to the Fickian and non-Fickian diffusional contribution,respectively.Regardless of the device geometry used,the exponent for the polymer relaxation transport mechanism is twice the diffusion Fick mechanism.As can be seen,the two phenomena controlling the release can be considered as additives and n is the pure Fick diffusion exponent.
A simpler expression of Eq.10,is that where the exponent n is set in 0.5[8,29]:

When the effect of the external(interface)mass transfer resistance is significant,the model that takes into account the coupled effects of drug diffusion through the polymeric membrane and the interface transport,is represented by Eq.12[9,11–14]:

Another simple and useful semi-empirical model[9],for the amount of drug released in a slab devise is:

Note that a,b,c and n,are positive parameters,otherwise would go against mass conservation principle[11,30].
2.6. Statistical analysis
In mathematical modeling,the main problem is to discern which model is the best one among several yielding good fits.One possibility would be to use the method of the sum of the squared residuals(SSR)to find the model that best explains the experimental data(minimal value for the SSR).The release tests results were analyzed for the seven models by a nonlinear regression analysis,through the Polymath 6.0 program,and the SSR values were calculated.
However,if the model has too many parameters,a small SSR value could be obtained,so this parameter by itself does not weigh the complexity of the model.That is why it is necessary to use a discriminatory criterion.
Different approaches can be followed for this purpose,but due to its simplicity,the Akaike’s method[30,31]is the more convenient.Assuming that the random errors follow a Gaussian distribution,the Akaike number AIC(Akaike Information Criterion)is defined in Eq.14 and it was used in the discrimination analysis[30,32–34].

where N is the number of experimental data,SSR is the square residuals sum and the number of parameters in the model is represented by p.The model that best represents statistically the drug release mechanism is the one with minimum AIC.The AIC criterion considers both,the number of parameters and experimental data in the model.Therefore,the AIC criterion is better than simple comparison of the SSR values of the different models.
3. Results and discussion
3.1. Progesterone release
In a previous article of our research group,the lumped second order mathematical model was presented and used to fit the release data for 23,29 and 33 wt%Prg in PHB membranes[22].In this contribution,the maximum Prg loading(41 wt%),where the Prg crystals are still uniformly distributed across the membrane thickness,was included.
Fig.1 shows the progesterone mass release from PHB-Prg membranes,with different Prg content,as function of time.It can be seen that the amount of hormone released,is inf l uenced by the original Prg load in the membrane;i.e.higher Prg load,lower drug release.This behavior can be attributed to an excess of progesterone crystals in the membrane,and particularly at the interface.Dissolution of these crystals in the release medium is hindered by the very low Prg solubility in the polymer and receptor solution,although drug solubility in PHB is higher than in the release medium,as it will be discussed later.Thus,the surface available for drug release decreases as Prg loading increases.When the dissolved and nondissolved Prg coexist within the polymeric matrix,the dissolved drug is the only available for diffusion[22].
Fitting the experimental data with our model through the non-linear regression analysis(Polymath 6.0 program),the lines in Fig.1 were obtained,showing a good fit of the model(Eq.3)to experimental data.Thus,parameters a and b are determined from which M∞values were calculated(Eq.5).
The same non-linear regression analysis was carried out with the six models considered.The values of the parameters for each model as well as the R2,SSR and AIC values are reported in Tables 1–4,for the four Prg contents in the PHB membranes.
Tables 1–4 show that the model given by Eq.10 is the one that gives the smallest AIC values practically for all Prg loads.However,parameter b is always negative in Eq.10.Obviously,the minimum AIC value does not guarantee the model reliability,since the parameters also must assume reasonable values(in the physics sense).Therefore Eq.10 is not physically consistent,as previously indicated,and should be discarded.Comparing with the other five models,our proposed model(Eq.3)is the one with minimum AIC value,and therefore it is the one that statistically fits better the experimental data obtained for all the Prg loads tested.
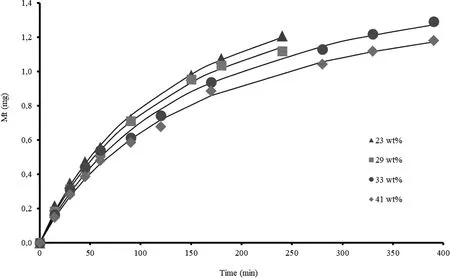
Fig.1–Fit of the proposed model to experimental Prg release data.Symbols are the mean value experimental data and their sizes represent the standard deviation.Lines represent the theoretical release predictions with nonlinear regression fit developed in this work(Eq.3).
Even though mathematical models can always be getting better,it is important to remember that a widely applicable complicated model may be accurate but not useful.In this context,the simplest model fitting properly the experimental data can be the best one when R&D purposes are pursued.Equation 3 is both simple and accurate;it only has two parameters and could be applied in the whole time range.
3.2. Normalized release rate
In a previous paper[22],we have presented a valuable parameter,the normalized release rate per unit of effective surface area(RRef,mg/cm.min),given by Eq.15

where Aefis the membrane effective surface area,calculated through Eq.16,

A is the total membrane surface area and(v/v)PHBis the volume fraction of PHB in the membranes,considering thatdue to the low Prg solubility in the PHB,the density of both PHB and Prg could be considered as pure compounds(1.300 g/cm3and 1.166 g/cm3respectively).The(v/v)PHBvalues are 0.750,0.687,0.645 and 0.563 for 23,29,33 and 41%Prg repectively.

Table 1–Estimated parameters,SSR and AIC values for the models,when membranes were loaded with 23 wt%Prg.
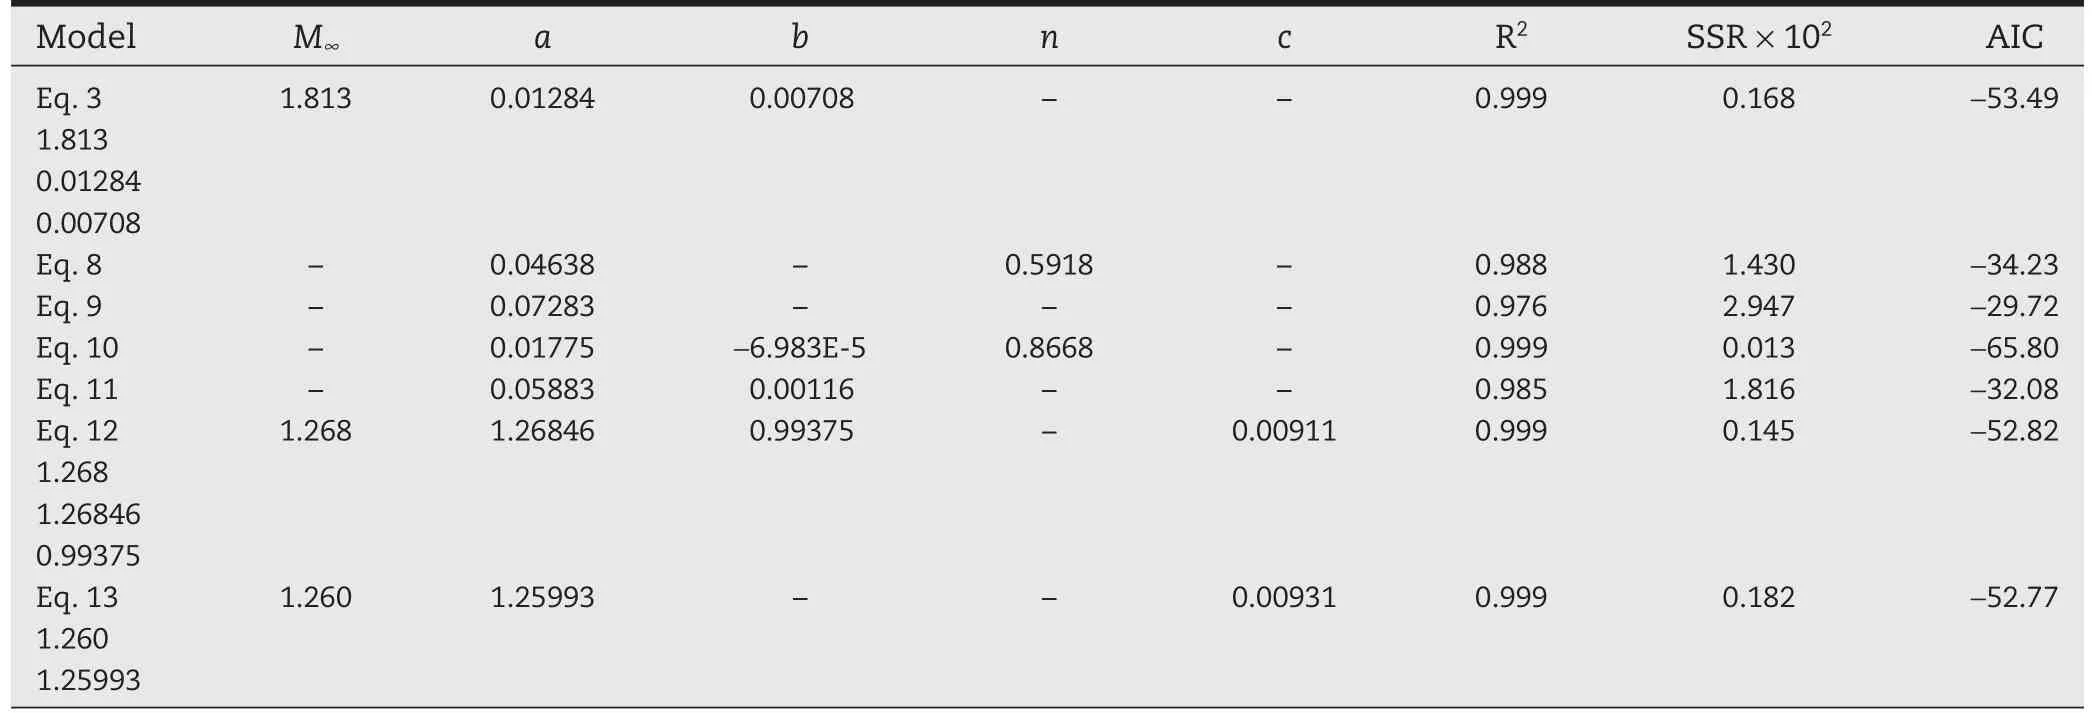
Table 2–Estimated parameters,SSR and AIC values for the models,when membranes were loaded with 29 wt%Prg.

Table 3–Estimated parameters,SSR and AIC values for the models,when membranes were loaded with 33 wt%Prg.
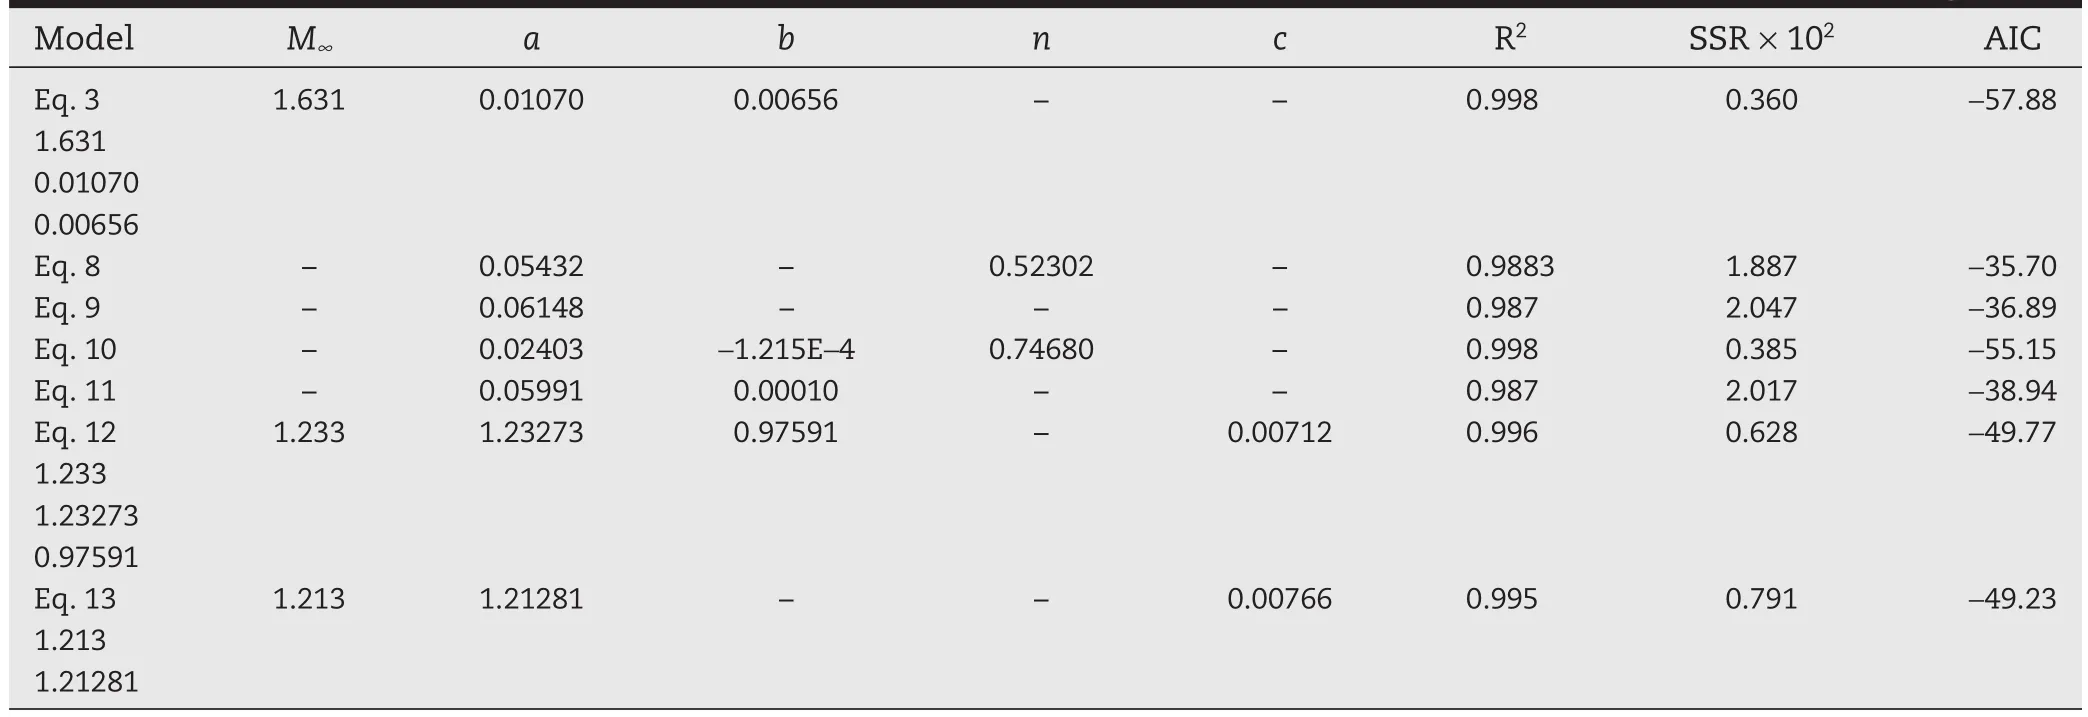
Table 4–Estimated parameters,SSR and AIC values for the models,when membranes were loaded with 41 wt%Prg.
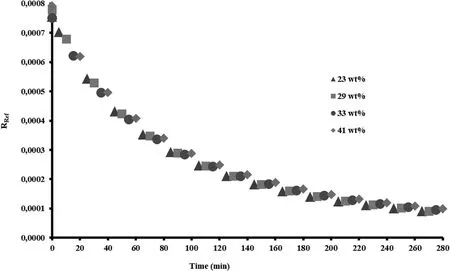
Fig.2–RRefvs.time.Symbols are the mean value experimental data and their sizes represent the standard deviation.
The RRefvalue must be the same,regardless of Prg load.Fig.2 shows that the RRefvalues calculated as function of time,for the four Prg loads used,gives a unique line that fits all the experimental data points.These explain exactly what we stood previously.
3.3. External mass transfer coefficient and equilibrium constant
Prg release rate should be equal to the rate of drug transfer through the external membrane effective surface area and the solution.This relation is given by Eq.17.

where CLsand Ctare the Prg concentration at the interface and in the bulk f l uid,respectively,and kc is the external mass transfer coefficient.
At the beginning of the process(t=0),CLs=and Ct=0.Here,is the solubility of Prg in the release medium.Then,Eq.17 gives:

Therefore,according to Eq.6:

Considering that CoL=0.021 mg/cm3[22],the mean value of kc is(6.1 ± 0.1)× 10?4cm/sec.This value agrees with kc values found in systems with low rate of mixing,characteristic of the horizontal shaker[14,35,36].
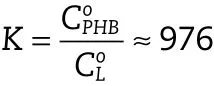
Another interesting information that can be obtained is the equilibrium distribution constant(K)(partition coefficient)of Progesterone between the PHB and the release medium.This thermodynamic quantity is estimated as the drug solubility’s ratio in the membrane material and the release medium.The approximate value of K is:
4. Conclusions
The new model,developed for drug release processes and derived from a second order kinetic expression,was validated.This model was compared with several mathematical models,for progesterone release from PHB membranes.The model is simple;it only has two parameters and can describe the entire drug release profile,even for t=0,unlike the power law expression.Via the Akaike information criterion(AIC),it was demonstrated that our model is the one that best fits experimental results.External mass transfer coefficient and equilibrium distribution constant were determined as well.
5. Declaration of interest
The authors declare that there is no conf l icts of interest.The authors alone are responsible for the content and writing of this article.
Acknowledgements
AuthorswouldliketoacknowledgetheConsejode Investigación,Universidad Nacional de Salta(CIUNSa,2176/0),the Consejo Nacional de Investigaciones Científicas yTécnicas(CONICET)and the Agencia Nacional de Promoción Científica yTecnológica(ANPCyT,PICT-MICINN 2011-2751 and PICT 2012-2643)for financial support.
[1]Chorny M,Fishbein I,Danenberg HD,et al.Study of the drug release mechanism from tyrphostin AG-1295-loaded nanospheres by in situ and external sink methods.J Control Release 2002;83:401–414.
[2]Siepmann J,G?pferich A.Mathematical modeling of bioerodible,polymeric drug delivery systems.Adv Drug Deliv Rev 2001;48:229–247.
[3]Siepmann J,Siepmann F.Modeling of diffusion controlled drug delivery.J Control Release 2012;161:351–362.
[4]Mitragotri S,Anissimov YG,Bunge AL,et al.Mathematical models of skin permeability:an overview.Int J Pharm 2011;418:115–129.
[5]Higuchi T.Rate of release of medicaments from ointment bases containing drugs in suspension.J Pharm Sci 1961;50:874–875.
[6]Korsmeyer RW,Gurny R,Doelker E,et al.Mechanisms of solute release from porous hydrophilic polymers.Int J Pharm 1983;15:25–35.
[7]Ritger PL,Peppas NA.A simple equation for description of solute release I.Fickian and non-fickian release from nonswellable devices in the form of slabs,spheres,cylinders or discs.J Control Release 1987;5:23–36.
[8]Siepmann J,Peppas NA.Modeling of drug release from delivery systems based on hydroxypropyl methylcellulose(HPMC).Adv Drug Deliv Rev 2012;64(Suppl.):163–174.
[9]Siepmann J,Siegel RA,Rathbone MJ.Diffusion controlled drug delivery systems.Fundamentals and applications of controlled release drug delivery.New York:Springer;2012[Chapter 6].
[10]Siepmann J,Siepmann F.Mathematical modeling of drug delivery.Int J Pharm 2008;364:328–343.
[11]Crank J.The mathematics of diffusion.Oxford[England]:Clarendon Press;1975.
[12]Vergnaud JM.Controlled drug release of oral dosage forms.Taylor&Francis;1993.
[13]Vergnaud J-M,Rosca I-D.Assessing bioavailablility of drug delivery systems:mathematical modeling.CRC Press;2005.
[14]Lecomte F,Siepmann J,Walther M,et al.pH-sensitive polymer blends used as coating materials to control drug release from spherical beads:elucidation of the underlying mass transport mechanisms.Pharm Res 2005;22:1129–1141.
[15]Siepmann J,Kranz H,Bodmeier R,et al.HPMC-matrices for controlled drug delivery:a new model combining diffusion,swelling,and dissolution mechanisms and predicting the release kinetics.Pharm Res 1999;16:1748–1756.
[16]Lee P.Diffusional release of a solute from a polymeric matrix–approximate analytical solutions.J Memb Sci 1980;7:255–275.
[17]Bettini R,Colombo P,Massimo G,et al.Swelling and drug release in hydrogel matrices:polymer viscosity and matrix porosity effects.Eur J Pharm Sci 1994;2:213–219.
[18]Peppas NA,Gurny R,Doelker E,et al.Modelling of drug diffusion through swellable polymeric systems.J Memb Sci 1980;7:241–253.
[19]Sackett CK,Narasimhan B.Mathematical modeling of polymer erosion:consequences for drug delivery.Int J Pharm 2011;418:104–114.
[20]Langer R.New methods of drug delivery.Science 1990;249:1527–1533.
[21]Langer R,Peppas NA.Advances in biomaterials,drug delivery,and bionanotechnology.AIChE J 2003;49:2990–3006.
[22]Romero AI,Bermudez JM,Villegas M,et al.Modeling of Progesterone Release from Poly(3-Hydroxybutyrate)(PHB)Membranes.AAPS PharmSciTech 2015;1–9.
[23]Cheung CW,Porter JF,McKay G.Sorption kinetic analysis for the removal of cadmium ions from eff l uents using bone char.Water Res 2001;35:605–612.
[24]Gonzo EE,Gonzo LF.Kinetics of phenol removal from aqueous solution by adsorption onto peanut shell acidactivated carbon.Adsorp Sci Technol 2005;23:289–302.
[25]Tseng R-L,Wu F-C,Juang R-S.Liquid-phase adsorption of dyes and phenols using pinewood-based activated carbons.Carbon 2003;41:487–495.
[26]Siepmann J,Peppas NA.Modeling of drug release from delivery systems based on hydroxypropyl methylcellulose(HPMC).Adv Drug Deliv Rev 2001;48:139–157.
[27]Higuchi T.Mechanism of sustained-action medication.Theoretical analysis of rate of release of solid drugs dispersed in solid matrices.J Pharm Sci 1963;52:1145–1149.
[28]Paul DR.Elaborations on the Higuchi model for drug delivery.Int J Pharm 2011;418:13–17.
[29]Peppas NA,Sahlin JJ.A simple equation for the description of solute release.III.Coupling of diffusion and relaxation.Int J Pharm 1989;57:169–172.
[30]Yamaoka K,Nakagawa T,Uno T.Application of Akaike’s information criterion(AIC)in the evaluation of linear pharmacokinetic equations.J Pharmacokinet Biopharm 1978;6:165–175.
[31]Burnham KP,Anderson DR.Model selection and multimodel inference:a practical information-theoretic approach.New York:Springer;2002.
[32]Costa P,Lobo JMS.Modeling and comparison of dissolution profiles.Eur J Pharm Sci 2001;13:123–133.
[33]Serra L,Doménech J,Peppas NA.Drug transport mechanisms and release kinetics from molecularly designed poly(acrylic acid-g-ethylene glycol)hydrogels.Biomaterials 2006;27:5440–5451.
[34]Burnham KP,Anderson DR.Multimodel inference:understanding AIC and BIC in model selection.Sociol Methods Res 2004;33:261–304.
[35]Muschert S,Siepmann F,Leclercq B,et al.Prediction of drug release from ethylcellulose coated pellets.J Control Release 2009;135:71–79.
[36]Xu T,Fu R.Determination of effective diffusion coefficient and interfacial mass transfer coefficient of bovine serum albumin(BSA)adsorption into porous polyethylene membrane by microscope FTIR-mapping study.Chem Eng Sci 2004;59:4569–4574.
[37]Heap R,Symons A,Watkins J.Steroids and their interactions with phospholipids:solubility,distribution coefficient and effect on potassium permeability of liposomes.Biochim Biophys Acta 1970;218:482–495.
[38]Cerep.Cerep’s Partition coefficient assay:Log D using miniaturized Shake-Flask.2013.
 Asian Journal of Pharmacentical Sciences2018年1期
- Asian Journal of Pharmacentical Sciences的其它文章
- GUIDE FOR AUTHORS
- Original Research Paper Pulmonary delivery of liposomal dry powder inhaler formulation for effective treatment of idiopathic pulmonary fibrosis
- Original Research Paper Preparation of poly(lactide-co-glycolide)microspheres and evaluation of pharmacokinetics and tissue distribution of BDMC-PLGA-MS in rats
- Original Research Paper Intranasal administration of carbamazepineloaded carboxymethyl chitosan nanoparticles for drug delivery to the brain
- Original Research Paper Association between the physical stability of flurbiprofen suspension and the interaction of HPMC/SDS
- Original Research Paper The accelerated blood clearance phenomenon of PEGylated nanoemulsion upon cross administration with nanoemulsions modified with polyglycerin