Genetic Similarity Analysis of Hunan Rice Landraces with Same or Similar Name in Household and Genebank Conservations
JIN Jian-chu, LI Xiao-xiang,*, LI Yong-chao,, PAN Xiao-wu, LIU Wen-qiang, DUAN Yong-hong, YU Ya-ying, SHENG Xin-nian, ZHAO Wen-jin, WEI Xiu-cai
1. Long-ping Branch, Graduate School of Hunan University, Changsha 410125, PRC;
2. Hunan Institute of Rice Research, Hunan Academy of Agricultural Sciences, Changsha 410125, PRC;
3. Key Laboratory of Indica Rice Genetics and Breeding in the Middle and Lower Reaches of Yangtze River Valley, Ministry of Agriculture, Changsha 410125, PRC
Abstract This study was conducted to analyze the phenotypic and genotypic similarity or diversity of rice (Oryza sativa L.) landraces in household and hypothermic genebank conservations in Hunan Province and identify the genetic distance between the rice landraces with the same or similar names. A total of 92 accessions of rice landraces were divided into seven groups according to their local names, but the morphological traits showed large variations even within the same group as well as between household and genebank conservations. The SSR marker analysis showed that, in all the groups except Group E, the allelic variations within each subgroup of the household conservation were less than those of the genebank conservation, indicating the household-conserved rice landraces’ many-generation purification from natural and artificial selections in the process of their cultivation year after year; and the similarity coefficient among the household rice landraces was the highest except for Groups C and E. Thus, the study suggested that the same-name or similar-name rice resources retained by farmers would be valuable for collection and evaluation.
Key words Rice; Rice landrace with same or similar name; SSR marker; Phenotypic trait; Genetic similarity
1. Introduction
Rice is a most important cereal grain and is widely grown and consumed in China. Statistics has suggested that more than 60% of China’s population takes rice as staple food. Hunan Province, located in the middle reaches of Yangtze River, is famous for its remarkable richness of rice resources due to complex environmental and ecological conditions[1–2].
Since the 1980s, a great number of rice landraces have disappeared from the field and the market because of various agricultural and economic reasons, such as the breeding of high-yielding dwarf cultivars, the frequent renewal of hybrid rice varieties,the popularization of new lines, the acceleration of industrialization and urbanization, the adjustment of plantation structure, and the climate change.
Some rice landraces have been very popular among farmers for specific characters and have been grown with the seeds self-retained by farmers for over 15 successive years. These rice landraces might have undergone a process of mutation due to the artificial selection of farmers and the natural selection of local ecological conditions. A general investigation and collection of these landraces is therefore very urgent.A total of 253 accessions of rice landraces seeds retained and planted by Hunan farmers for more than 15 years were collected during the Third Chinese Crop Germplasm Resources Census and Collection in 2015~2017. This collection not only included same-name rice landraces originating from different counties, but also varieties similar to the resources reserved in genebank. The determination of the genetic variations between these landraces with the same or similar names can improve the efficiency of seed Supply and resource utilization.
A number of genetic variations between rice or other crop materials with the same and similar names have been reported AHMED M Set al.[3]found that there were large differences in the phenotypic traits of rice landraces with the same name both BRONDANI Cet al.[4]and ZHU M Yet al.[5]found large genetic differences in rice landraces with the same name but from different origins. The SSR-based analysis of THOMSON M Jet al.[6]indicated large genetic differences in 40% of the rice landraces with the same name and from the same island. By molecular markers and comparative analysis of the agronomic traits, LI X Xet al.[7]observed significant mutations in Hunan rice landraces stored in Hunan genebank with same or similar names but from different origins, which therefore were worthy of preservation. WONG S Cet al.[8]reported that rice landraces with the same name but collected from different places didn’t cluster,which was in contrast to a high genetic similarity between rice landraces with different names.
Most of the reported genetic variations between the same-name materials were observed with the SSR marker or simplex phenotypic analysis. Rice landraces have formed a steady population through long-term domestication and selection. The genetic variation in rice materials with the same name could be caused by the mutation of one or more genes. In the SSR marker analysis, the amount of markers would affect the results. Specifically, if the markers are small in number, some varied landraces might be misjudged as the same variety, thus excluding the same name material with superior traits such as resistance to a certain disease; but large number of markers could increase the cost. The simplex phenotypic method may also lead to misjudgments because of environmental and genotype factors.
In this study, the phenotypic variations and SSR marker-based genetic similarities of rice landraces with the same or similar names in household and genebank conservations were observed and analyzed for the identification of genetic distance between the rice landraces, which would provide a reliable theoretical basis for further study of how to effectively reserve, supply and utilize rice landraces.
2. Materials and Methods
2.1. Materials
A total of 92 accessions of rice landraces were tested in the study, among them 63 rice resources were collected from the household conservation through“the Third Chinese Crop Germplasm Resources Census and Collection (2015~2017)” program, and 29 accessions were rice landraces with the same or similar names selected from the Hunan genebank conservation which has been practised since the first (1955), second (1981) and third germplasm resources census. All these materials presented similar phenotypic traits in field tests. In SSR marker analysis,P1 and P2 were Ribenqing (Nipponbare) and 9311 as the controls, respectively. The materials in Group R were from the household conservation. Group A, B,C, D, E, and F indicated the same or similar names of rice varieties, respectively (Table 1).
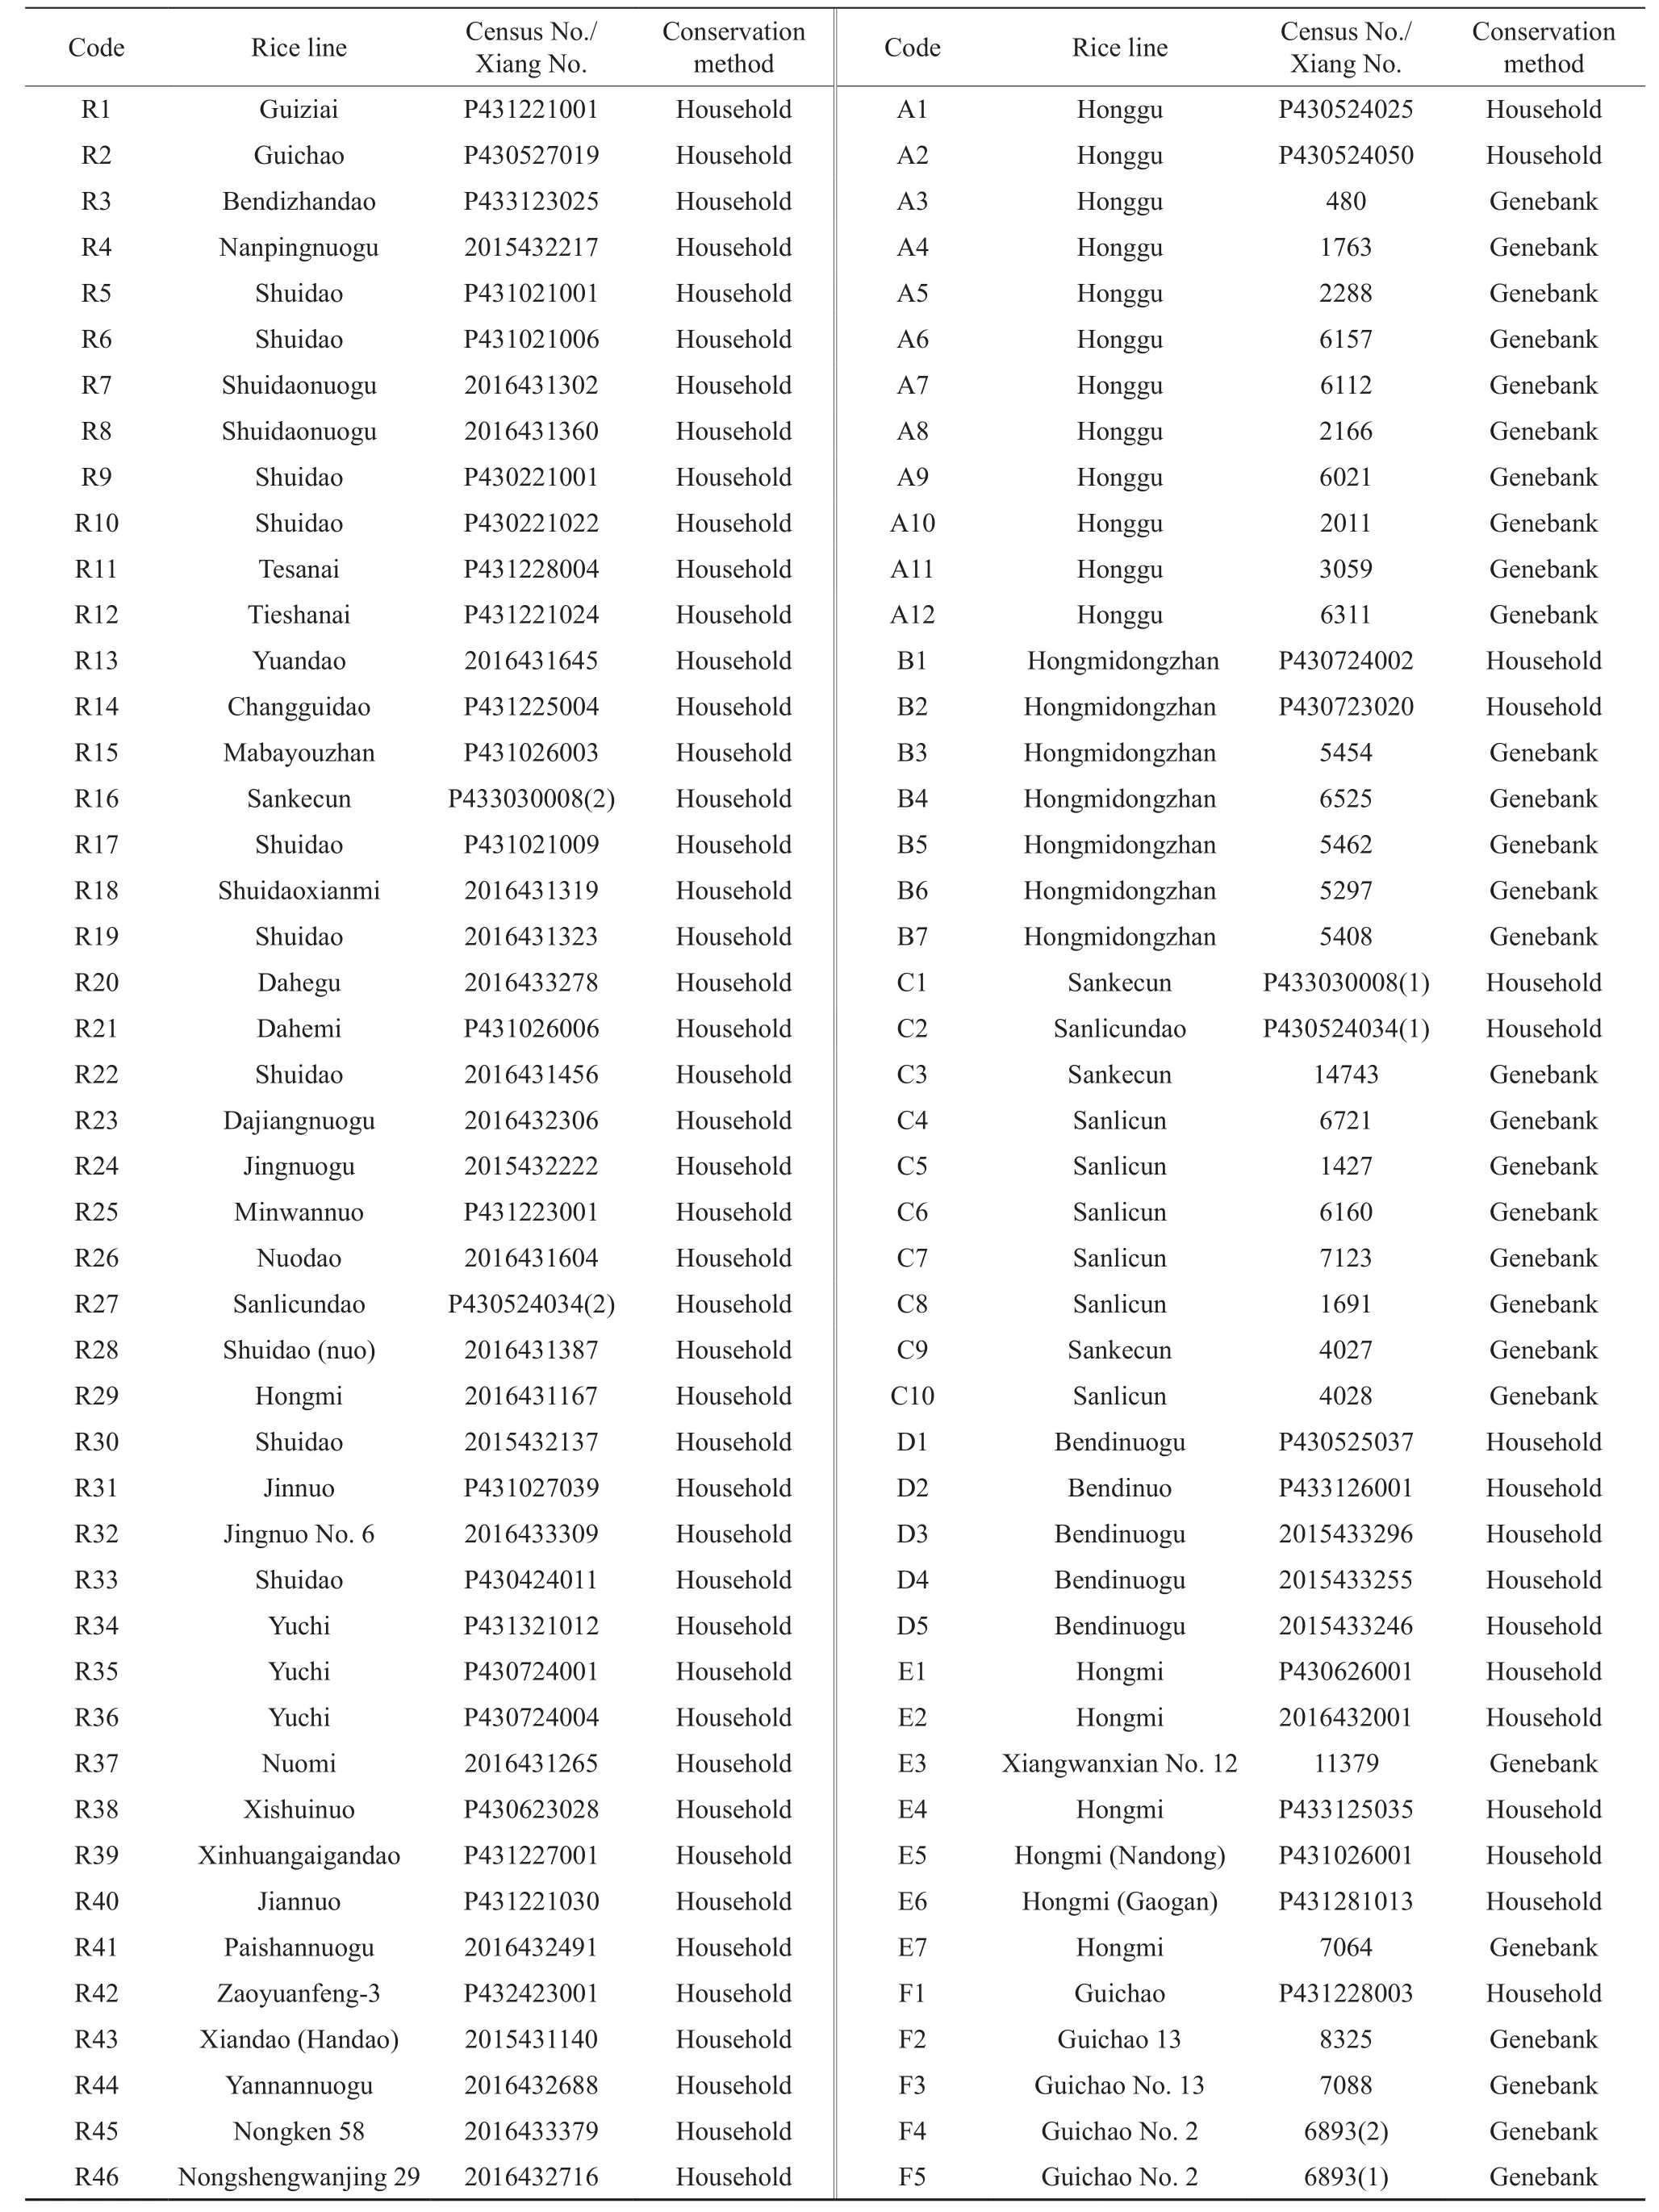
Table 1 The names and conservation method of selected rice landraces
2.2. Phenotypic traits and statistics
All the 92 accessions were sowed on May 10th,2016 and then transplanted by means of single plant on May 29thto the test field of Hunan Institute of Rice Research. The randomized block design was applied in the test, each material was planted at 3 rows×10 plants with 3 replications (each replication contained 30 plants), and the plant and row spacing was 20 cm×20 cm. The initial heading stage, full heading stage, plant height (PH), the length (LFL) and width(WFL) of flag leaves were measured in the field. Three representative plants were selected from each block during the maturity to count and measure the number of effective panicles (NEP), the panicle length (PL),seed-setting rate (SS), number of grains per panicle(NGP), number of filled grains per panicle (NFGP),grain length (GL), grain width (GW), grain diameter(GD) and thousand-grain weight (TGW). The length,width and diameter of rice grains were measured with Wanshen SC-E detector in accordance with the Descriptive Specifications and Data Standards of Rice Germplasm Resources compiled by HAN L Zet al.[9]. Totally 14 phenotypic traits were processed for the cluster analysis by DPS 9.50 software. The cluster distance coefficients were calculated with Chi-square measure, and the cluster method is based on the sum of squares of deviation from mean.
2.3. SSR marker analysis
2.3.1. Primer selection
SSR primers should be of good polymorphic properties in light of this laboratory’s selection. In general, 3~5 pairs were selected from the 12 chromosomes in the rice. Totally 49 pairs were gathered,among which 44 pairs of primers could be used for the indica-japonica identification. The primer sequence was synthesized by Shanghai Sangon Biotech.
2.3.2. DNA extraction and PCR
10 seeds in the same grain shape were selected from each group (materiel) for pre-germination at 32℃. Then, the pre-germinated seeds were cultivated at room temperature (25℃) until they grew into the threeleaf stage. Next, some leaves were collected from the three-leaf seedlings and mixed up for DNA extraction using the improved SDS method[10]. Implen NanoPhotometer (a microvolume spectrometer) was applied to detect the concentration and quality of the DNA. The DNA concentration was diluted to 150 ng/μL and stored at -20℃.
The PCR system was 10 μL in volume, including 1 μL of template DNA, 2 μL of positive premier and 2 μL of negative premier (both were at 5 μmol/L), and 5 μL of Mix. The detailed PCR procedures were listed below: the initial denaturation at 94℃ for 5 min; 30 cycles of the denaturation at 94℃ for 45 s, annealing at 55℃ for 45 s and elongation at 72℃ for 45 s; and the elongation at 72℃ for 8 min and then storage of the products at 4℃. Next, 6% non-denatured polyacry lamide gel electrophoresis was used for size separation,the rapid silver staining for detection of the silverstained PCR amplification products, and HP Scanjet G4050 for photographing the results.
2.3.3. Statistical method
According to the electrophoresis results of the amplification products and at the same migrating sites,the PCR products with bands were marked as 1, while those without bands were marked as 0; and a 0~1 matrix was built to analyze the results. The genetic similarity and UPGMA (unweighted pair-group method with arithmetic means) were analyzed with NTSYSpc 2.10e software.
3. Results and Analysis
3.1. Phenotypic genetic distance within the same group
The variations between the materials decrease with the phenotypic genetic distance. According to the cluster analysis of 14 phenotypic traits (Table 2),there were not the paired materials with a genetic distance at 0, suggesting that no phenotypes were the same in the tested materials. The phenotypic genetic distance presented great variations in the different groups. The maximal genetic distance varied from 2.11 (D1 Bendinuogu/D2 Bendinuo) to 8.50 (R1 Guiziai/R3 Bendizhandao) and the minimal genetic distance from 0.19 (R28 Shuidao (nuo)/R38 Xishuinuo) to 1.51 (D2 Bendinuo/D5 Bendinuogu).In the household conservation, D1 (Bendinuogu)and D2 (Bendinuo) had similar names but were significantly different in the PH, WFL and NEP. R1(Guiziai) and R3 (Bendizhandao) presented extreme significant differences in the PH, WFL, SS, NFGP,PL, TGW, length-width ratio of rice grain (Grain L/W Ratio), GW and GD. No significant variation was found between R28 (Shuidao (nuo)) and R38(Xishuinuo). D2 (Bendinuo) and D5 (Bendinuogu)had extreme significant difference in the NGP and NFGP. There was a difference of over 5 d in the whole growth period (WGP) between the materials within the same group, including A1 (Household Honggu)/A3 (Genebank Honggu), B2 (Household Hongmidongzhan)/B3 (Genebank Hongmidong zhan), C2 (Household Sanlicundao)/C6 (Genebank Sanlicun), and F1 (Household Guichao)/F2 (Genebank Guichao 13). The maximal difference in the WGP was found between Household B2 (Hongmidong zhan) and Genebank B3 (Hongmidongzhan),presenting a 30 d gap. These data indicated that extreme significant differences in the phenotypic traits do exist between the tested same- or similar-name materials as well as those conserved by farmers and Hunan genebank.
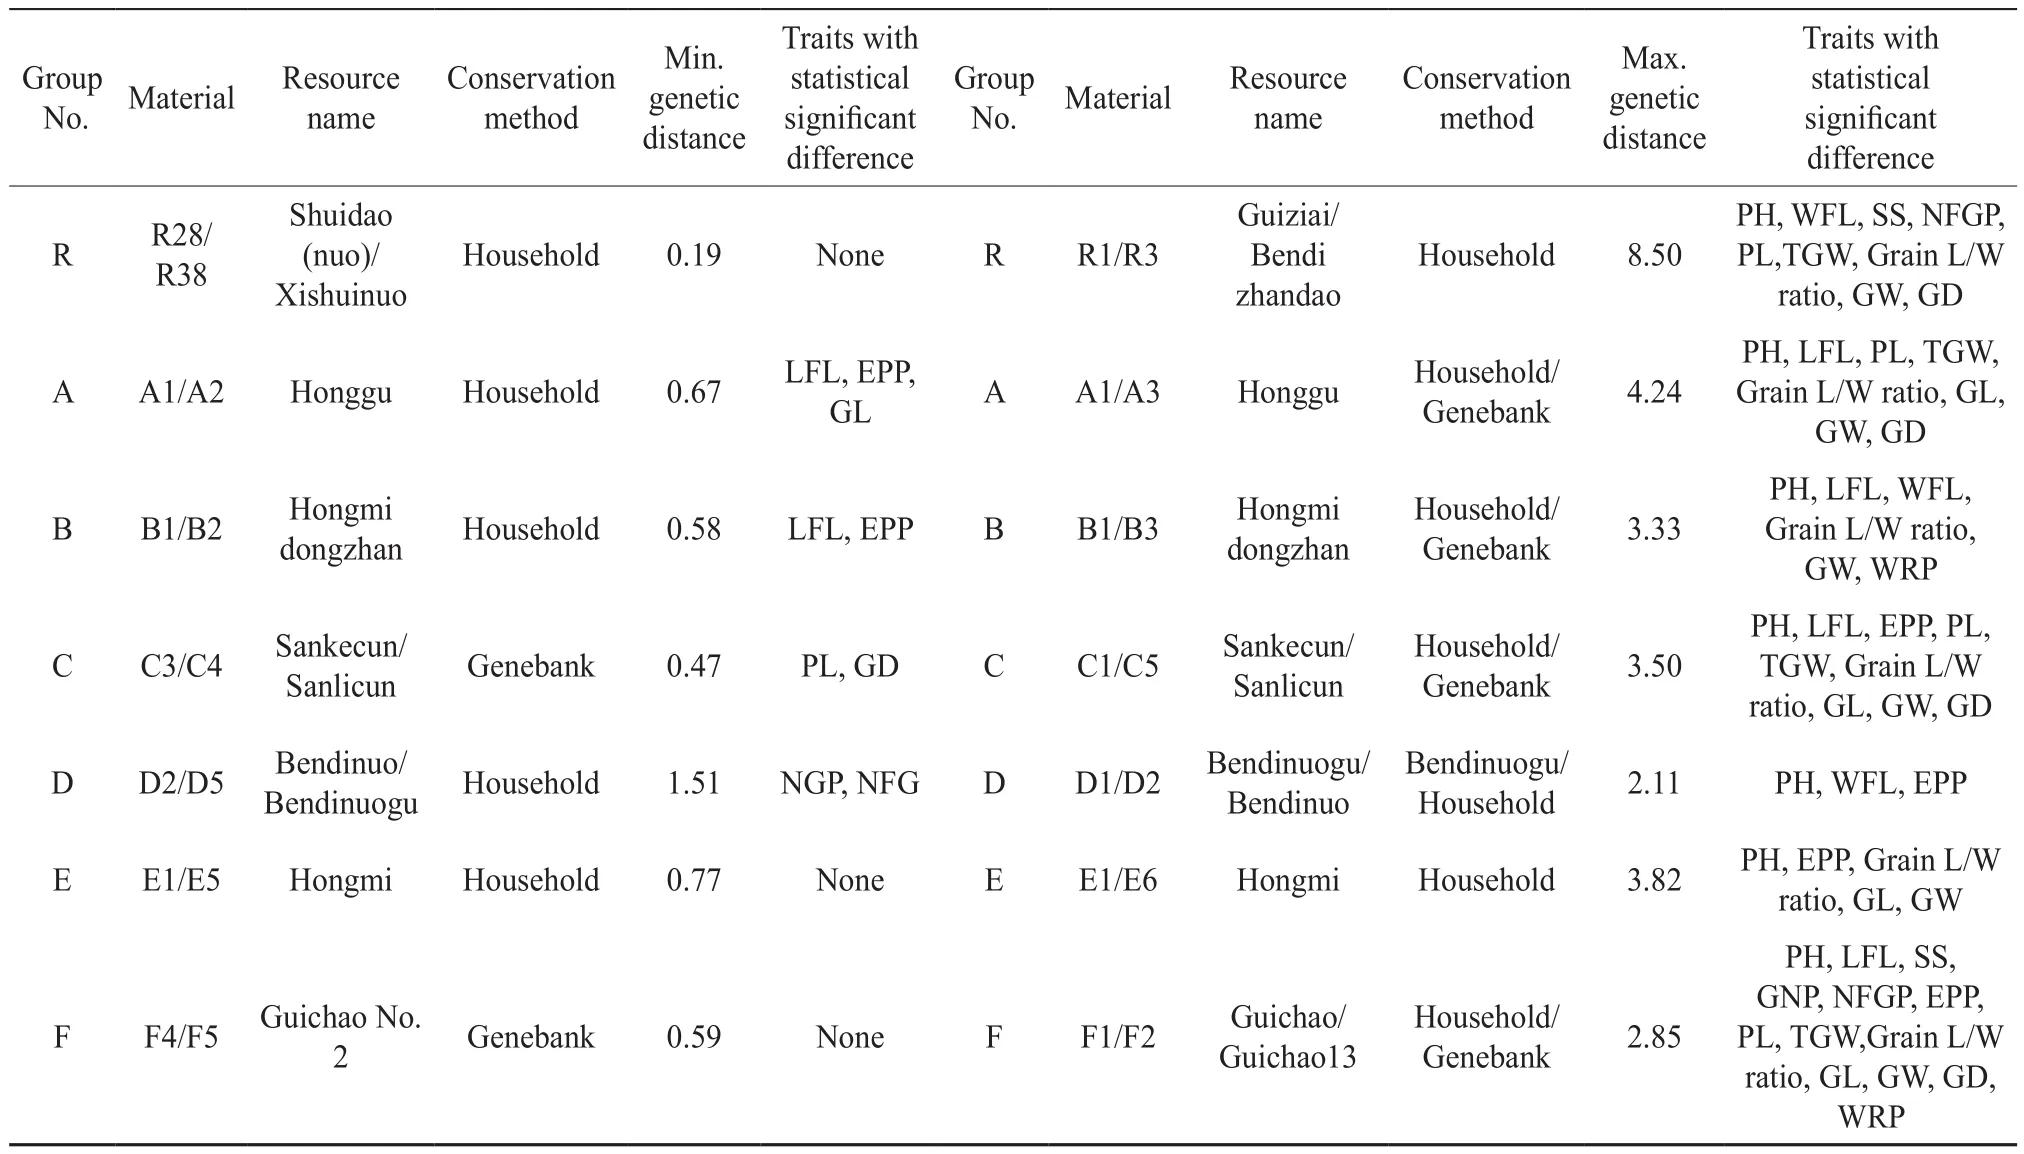
Table 2 Phenotypic differences between two rice landraces with the maximum or the minimum genetic distance in the same group
The findings of cluster analysis (Fig. 1) showed that all the 92 accessions of rice landraces were classified into 7 categories (from I to VII in topdown sequence) at a genetic distance of 3.294 4.Category I included 7 landraces featured with wide flag leaves, large panicles and low seed-setting rate.Category II consisted of 21 varieties with intermediate performance. Category III was landraces with high seed-setting rate and the shortest grain length.Category IV included 11 landraces also with high seed-setting rate and large panicles, but small grains.Category V was 14 varieties with large panicles and long-thin grains. Category VI had only 2 semidwarf varieties with short growth period, short flag leaves and small number of grains per panicle (NGP).Category VII was of 23 varieties with large panicles and the highest plants.
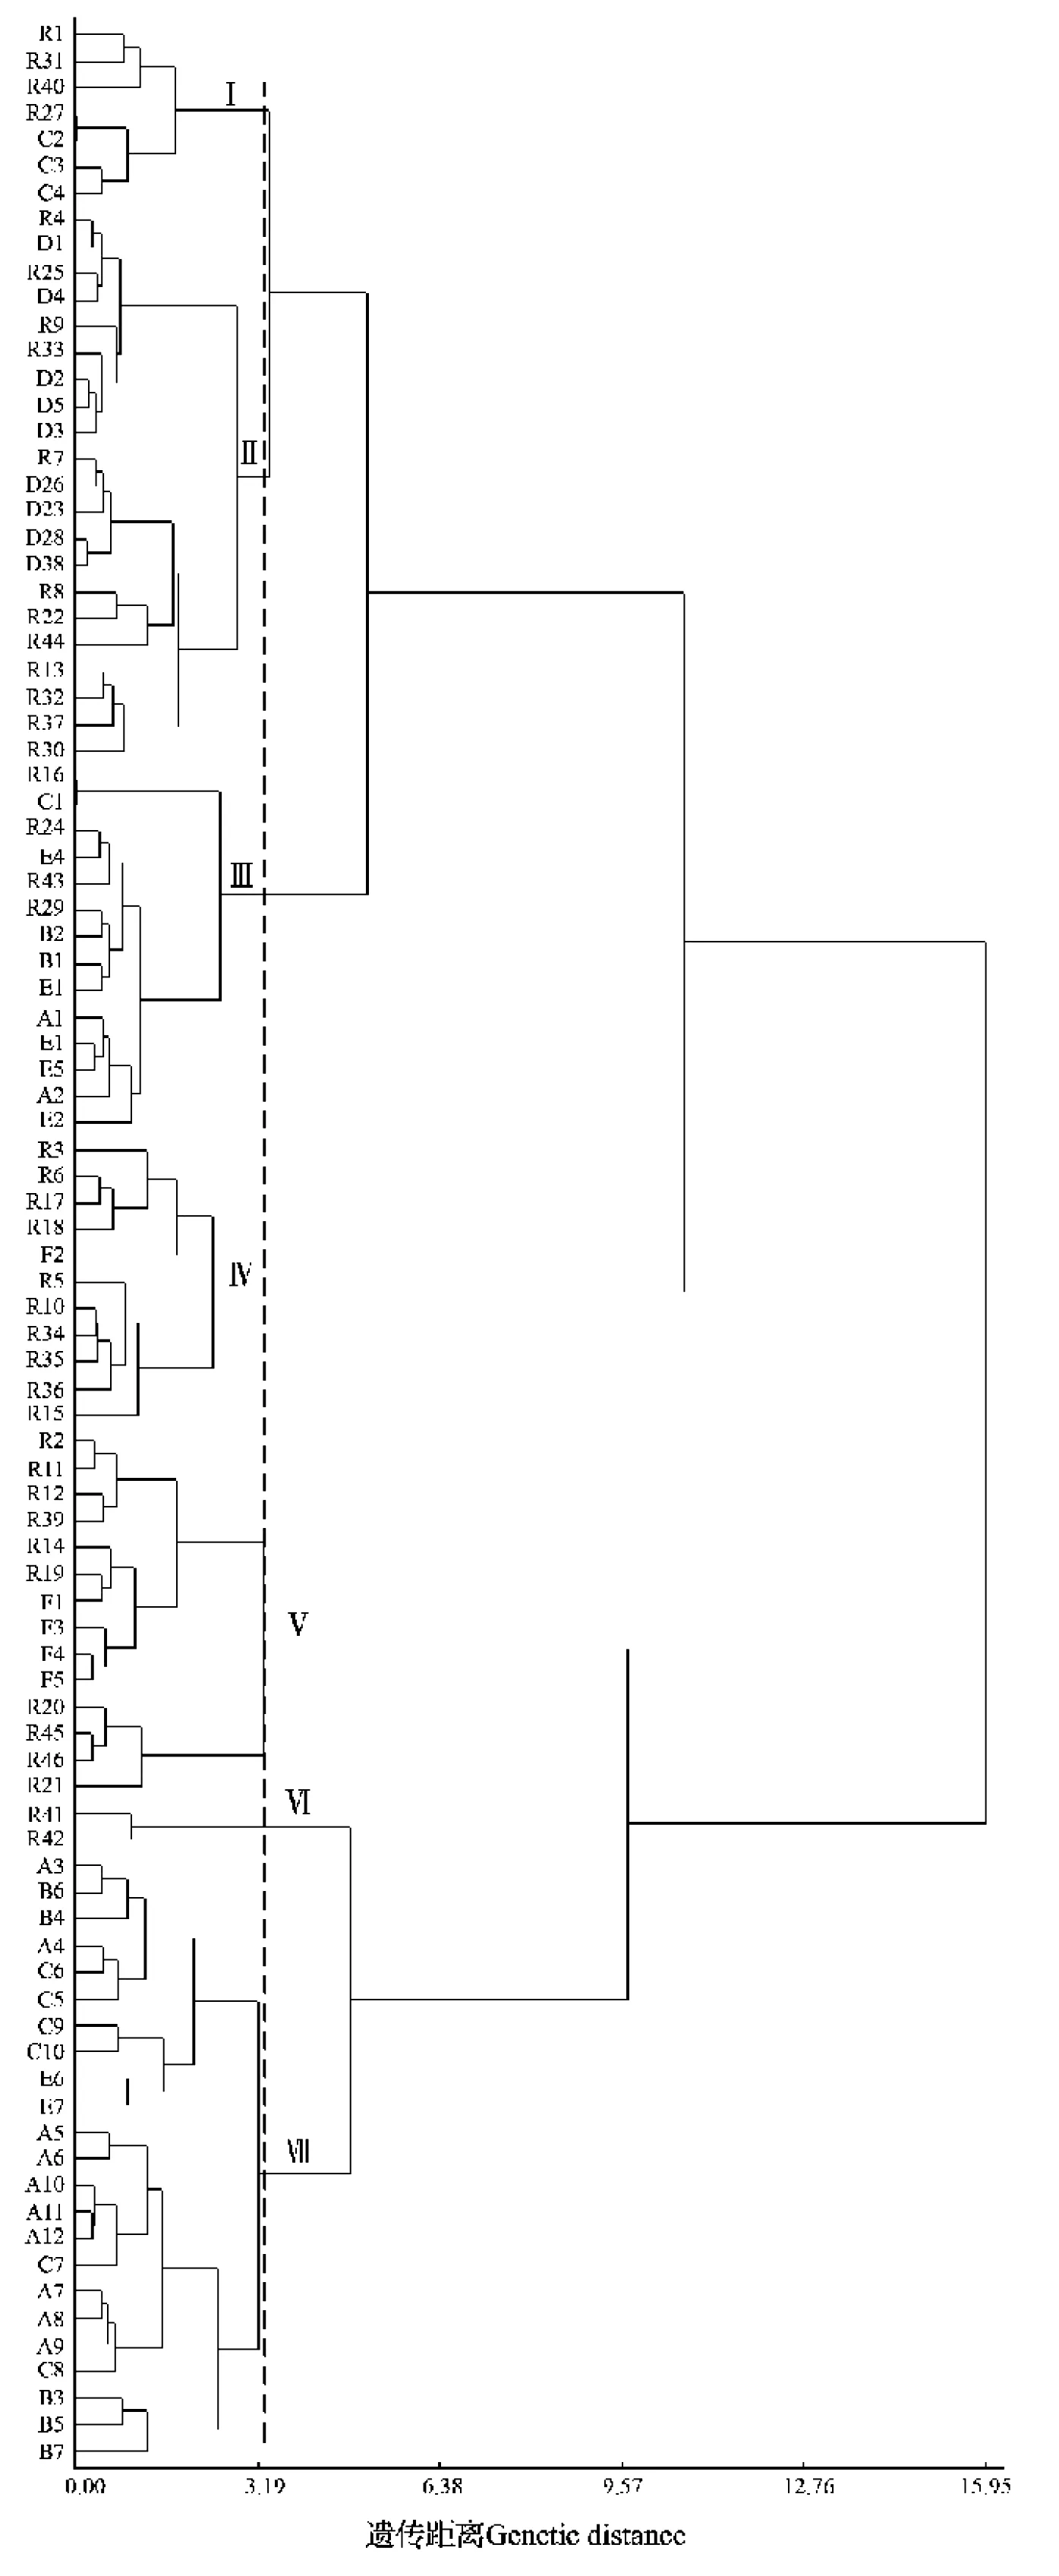
Fig. 1 Cluster diagram based on phenomental genetic distance
3.2. SSR genetic similarity within the same group
Differences could be observed in both the number of alleles and the average allele number per locus detected by 49 pairs of SSR primers, as shown in Table 3. The number of variant alleles ranged from 52 (Group D) to 145 (Group R), and the average number of variant alleles in each locus was in the range of 1.06 (Group D) to 2.96 (Group R). The primers with the most number of variant alleles varied in each group. For example, RM72, RM228, RM271 and RM16 each had 3~7 variant alleles in 2~4 groups of materials. The number of loci in groups with only 1 variant allele ranged from 0 (Group R) to 48 (Group D), indicating great difference in the number of primers with variant alleles among all the 49 pairs of SSR primers in different groups. The range was 1 pair(Group D) to 49 pairs (Group R). More than 19 pairs of primers exhibited polymorphism to the materials of each group, except Group D. The SSR marker analysis on the Hunan rice landraces showed that, in all the groups except Group E, the allelic variations within each subgroup of the household conservation were less than those of the genebank conservation within the same group, indicating the many-generation purification of the household-conserved rice landraces through natural and artificial selections in the process of their cultivation year after year.
The genetic similarity coefficients (Table 4) were obtained and a dendrogram (Fig. 2) was drawn based on the SSR marker amplification electrophoresis.According to the results, the similarity coefficients of the household rice landraces were the highest except for Groups C and E. The average genetic similarity coefficient of the 92 accessions reached 0.797, and there were large variations in different groups. The minimal coefficient ranged from 0.471 to 0.983,while the maximal coefficient varied from 0.983 to 1.000. The R1/R2, R11/R12, R23/R25/R26, R24/R28/R31, R35/R36, D1/D3/D4, E1/E2, and F3/F4/F5 exhibited close genetic similarities with a genetic similarity coefficient of 1.000. Hence, they were defined as the same variety, regardless of their names,such as the household-conserved R1 (Guiziai) and R2 (Guichao), and the genebank-conservation F3(Guichao No.13), F4 and F5 (Guichao No. 2). Some materials with the same name in the same group did not necessarily cluster together, and might crosscluster with similar-name materials. For instance,the genetic similarity coefficient was 0.983 between B1 (Hongmidongzhan; Chinese: 紅米冬粘) and B2 (Hongmidongzhan; Chinese: 紅米冬占), with similar Chinese names and close genetic similarity. In contrast, the genetic similarity between B1 and other same-name or similar-name materials was lower than 0.805. The data suggested that the genetic similarity between household-conserved similar-name B1 and B2 was closer than between the genebank-conserved same-name others in Group B. Large genetic distances(genetic similarity coefficient: 0.471~0.609) were observed between the genebank-conserved C9/C10 and the other 8 accessions in Group C, which might be caused by the wrong names of rice landraces.
5 pairs (i.e. RM11, RM408, RM471, RM6872,and RM4862) of the 49 SSR primers presented no special-type indica-japonica bands. As shown in Fig. 2,all the tested materials clustered into two categories at the genetic similarity coefficient of 0.51. One group clustered with Ribenqing (Nipponbare) and the other clustered with 9311, which therefore were defined as japonica subgroup and indica subgroup, respectively.The coefficient of genetic similarities between the materials from these two subgroups ranged from 0.431 to 0.609, indicating low genetic similarities and distinct genetic variations between the two subgroups.The japonica subgroup only contained 6 accessions:R20 (Dahegu), R21 (Dahemi), R45 (Nongken 58),R46 (Nongshengwanjing 29), C9 (Sankecun) and C10(Sanlicun); the average genetic similarity coefficient within this subgroup was 0.889, indicating small genetic difference among these 6 accessions. The other 86 accessions were classified into the indica subgroup and displayed an average genetic similarity coefficient of 0.837, representing close similarities.

Table 3 Difference in the number of variant alleles based on SSR marker analysis

Table 4 SSR marker-based genetic similarity coefficient
3.3. Comparison of phenotype and SSR marker analysis
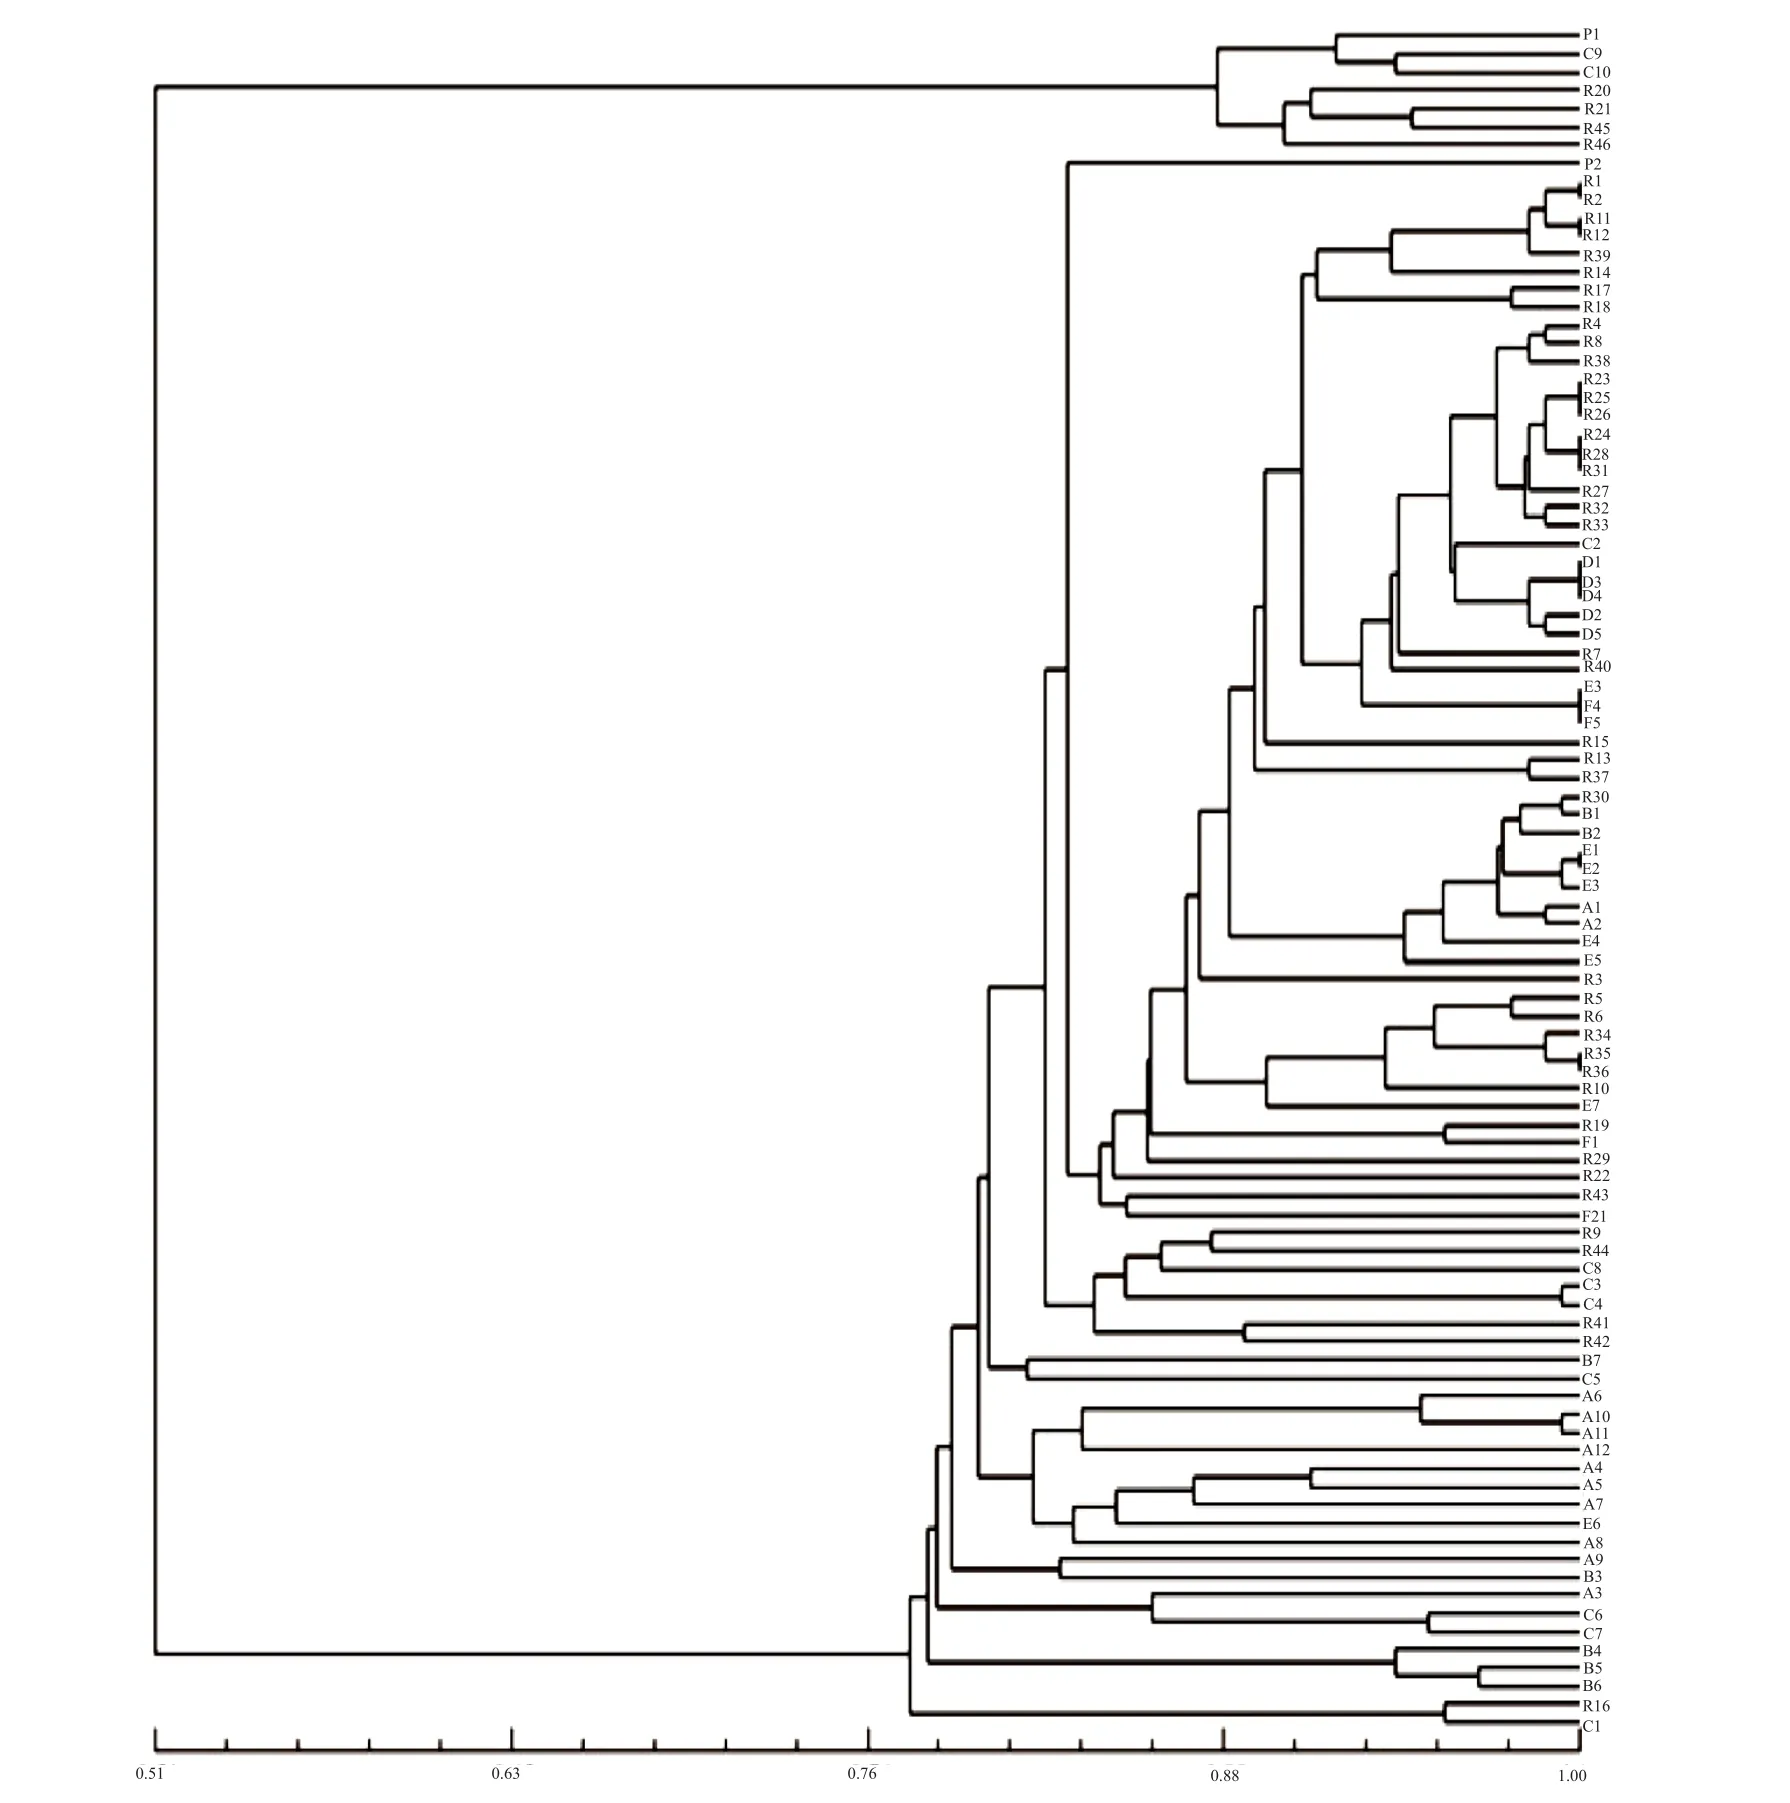
Fig. 2 SSR dendrogram of 92 Hunan landrace varieties
Some same-name materials collected from the same place could have distinct genetic difference in their phenotypic traits, such as the householdconserved D3/D4/D5 (Bendinuogu) from Yizhang, the household-conserved A1/A2 (Honggu) from Longhui,and the household-conserved E1/E2 (Hongmi)from Pingjiang. Some same-name materials from different places may also present large variations, for example, 5 same-name materials in Group D were collected from three different places. In contrary to the above findings, some materials with various names collected from different places exhibited very close genetic similarity, and thus were considered as the same variety, e.g. the household-conserved R28(Shuidao (nuo)) from Xinhuang and the householdconserved R38 (Xishuinuo) from Huarong. In general,the SSR marker-based genetic similarity coefficients(Fig. 1 and 2) were very low between the samename materials from the household and genebank conservations, representing large phenotypic genetic distance. Specifically, the SSR marker-based genetic similarity coefficient of C1 (household conservation)/C9 (genebank conservation) was 0.603 4, indicating a phenotypic genetic distance of 3.50. The phenotypic genetic distance between A1/A2 (household conservation) and other same-name varieties(genebank conservation) within the group reached up to 4.24. Likewise, the phenotypic genetic distance between B1/B2 (household conservation) and other same-name varieties (genebank conservation) in the group was 3.33.
The comparative analysis (Table 5) revealed that(1) there were no tested same-name or similar-name materials presenting an SSR marker-based genetic similarity coefficient of 1 and a phenotypic genetic distance of 0 in the same group. The F4/F5, E1/E3/E5,and R28/R38 showed an SSR marker-based genetic similarity coefficient of over 0.95 and insignificant phenotypic traits (in the germplasm resource mid- and long-term conservation, only one of the same-name materials would be chosen for further distribution and application). The household-conserved E1 and E5 actually derived from recent-year commercial seeds,and the genebank-conserved Xiangwanxian No.12(E3), a low-cadmium accumulation emergency variety in recent years, were exactly the same variety. The R28 and R38 were landraces with different names from different origins. These findings suggested that there would be short household conservation term for commercial seeds. (2) As for the genetic relations between materials in the same group, the findings of phenotypic trait genetic distance analysis were different from or consistent with the results of SSR marker-based genetic similarity coefficient analysis.For instance, the B1 (Hongmidongzhan; Chinese: 紅米冬粘)/B2 (Hongmidongzhan; Chinese: 紅米冬占),the C3 (Sankecun)/C4 (Sanlicun), and the F4/F5(Guichao No. 2) were paired materials presenting the maximal SSR marker-based genetic similarity coefficient and the minimal phenotypic genetic distance in their groups. The findings of both methods indicated their close genetic relations. The D1(Bendinuogu) and D2 (Bendinuo) had the minimal SSR marker-based genetic similarity coefficient and the maximal phenotypic genetic distance,and thus were defined as the pair with the farthest genetic relations in their group (Table 2 and 4).For the subgroups within each group, the findings of phenotypic genetic distance analysis were also consistent with those of the SSR marker-based genetic similarity analysis (Fig. 2). Some materials presenting an SSR marker-based genetic similarity coefficient of 1 were listed below: R1 (Guiziai)/R2 (Guichao),R11 (Tesanai)/R12 (Tieshanai), R23 (Dajiangnuogu) /R25 (Minwannuo)/R26(Nuodao), R24 (Jingnuogu)/R28 (Shuidao (nuo))/R31(Jinnuo), R35 (Yuchi)/R36 (Yuchi), D1/D3/D4 (Bendinuogu), E1/E2(Hongmi), and F3 (Guichao No.13)/F4 (Guichao No. 2)/F5 (Guichao No. 2). All these materials,except F4/F5 (Guichao No. 2) and E1 (Hongmi)/E3(Xiangwanxian No. 12)/E5 (Hongmi), exhibited very distinct variations in 1~7 phenotypic traits (Table 5).According to the analysis of 14 phenotypic traits,the maximal genetic distances were found between the following pairs in their groups: R1 (Guiziai)/R3 (Bendizhandao), A1/A3 (Honggu), B1/B3(Hongmidongzhan), C1 (Sankecun)/C5 (Sanlicun), D1(Bendinuogu)/D2 (Bendinuo), E1/E6 (Hongmi), and F1 (Guichao)/F2 (Guichao13). But the SSR markerbased genetic similarity coefficients of these materials(except D1/D2) were not the minimal in their group.SSR maker analysis is undoubtedly an effective method for identifying the genetic similarity of and the variety in same-name or similar-name materials,but it could not completely substitute for phenotypic analysis.
4. Discussions
Although both phenotypic trait analysis and SSR molecular marker-based analysis have been widely applied to the evaluation of the genetic similarities of crops, the latter is considered more reliable[11]. As the product of genotype and the external environment,phenotypic traits are easily influenced by natural and artificial factors. But phenotypic analysis is accepted as a very cost-effective method for determining the population genetic structure and similarity of largeamount tested materials.
The results showed that the phenotypic trait genetic distance between the materials within the same group was not in complete accord with the corresponding SSR marker-based genetic similarity coefficient. Some paired materials such as R1 (Guiziai)/R2 (Guichao), R11 (Tesanai)/R12 (Tieshanai), R23(Dajiangnuogu)/R25 (Minwannuo)/R26(Nuodao), R24(Jingnuogu)/R28 (Shuidao (nuo))/R31(Jinnuo), R35(Yuchi)/R36 (Yuchi), D1/D3/D4 (Bendinuogu), E1/E2 (Hongmi), and F3 (Guichao No. 13)/F4 (Guichao No. 2)/F5 (Guichao No. 2) presented an SSR markerbased genetic similarity coefficient of 1. But the corresponding phenotypic trait analysis indicated 1~7 traits’ very distinct variations, except for F4/F5(Guichao No. 2) and E1 (Hongmi)/E3 (Xiangwanxian No. 12)/E5 (Hongmi). According to the analysis of 14 phenotypic traits, the maximal genetic distances were found between the following materials within their groups: R1 (Guiziai)/R3 (Bendizhandao); A1/A3(Honggu); B1/B3 (Hongmidongzhan); C1 (Sankecun)/C5 (Sanlicun); D1 (Bendinuogu)/D2 (Bendinuo); E1/E6 (Hongmi); F1 (Guichao)/F2 (Guichao13). But the SSR marker-based genetic similarity coefficients of these materials (except for D1/D2) were not the minimal in their group.
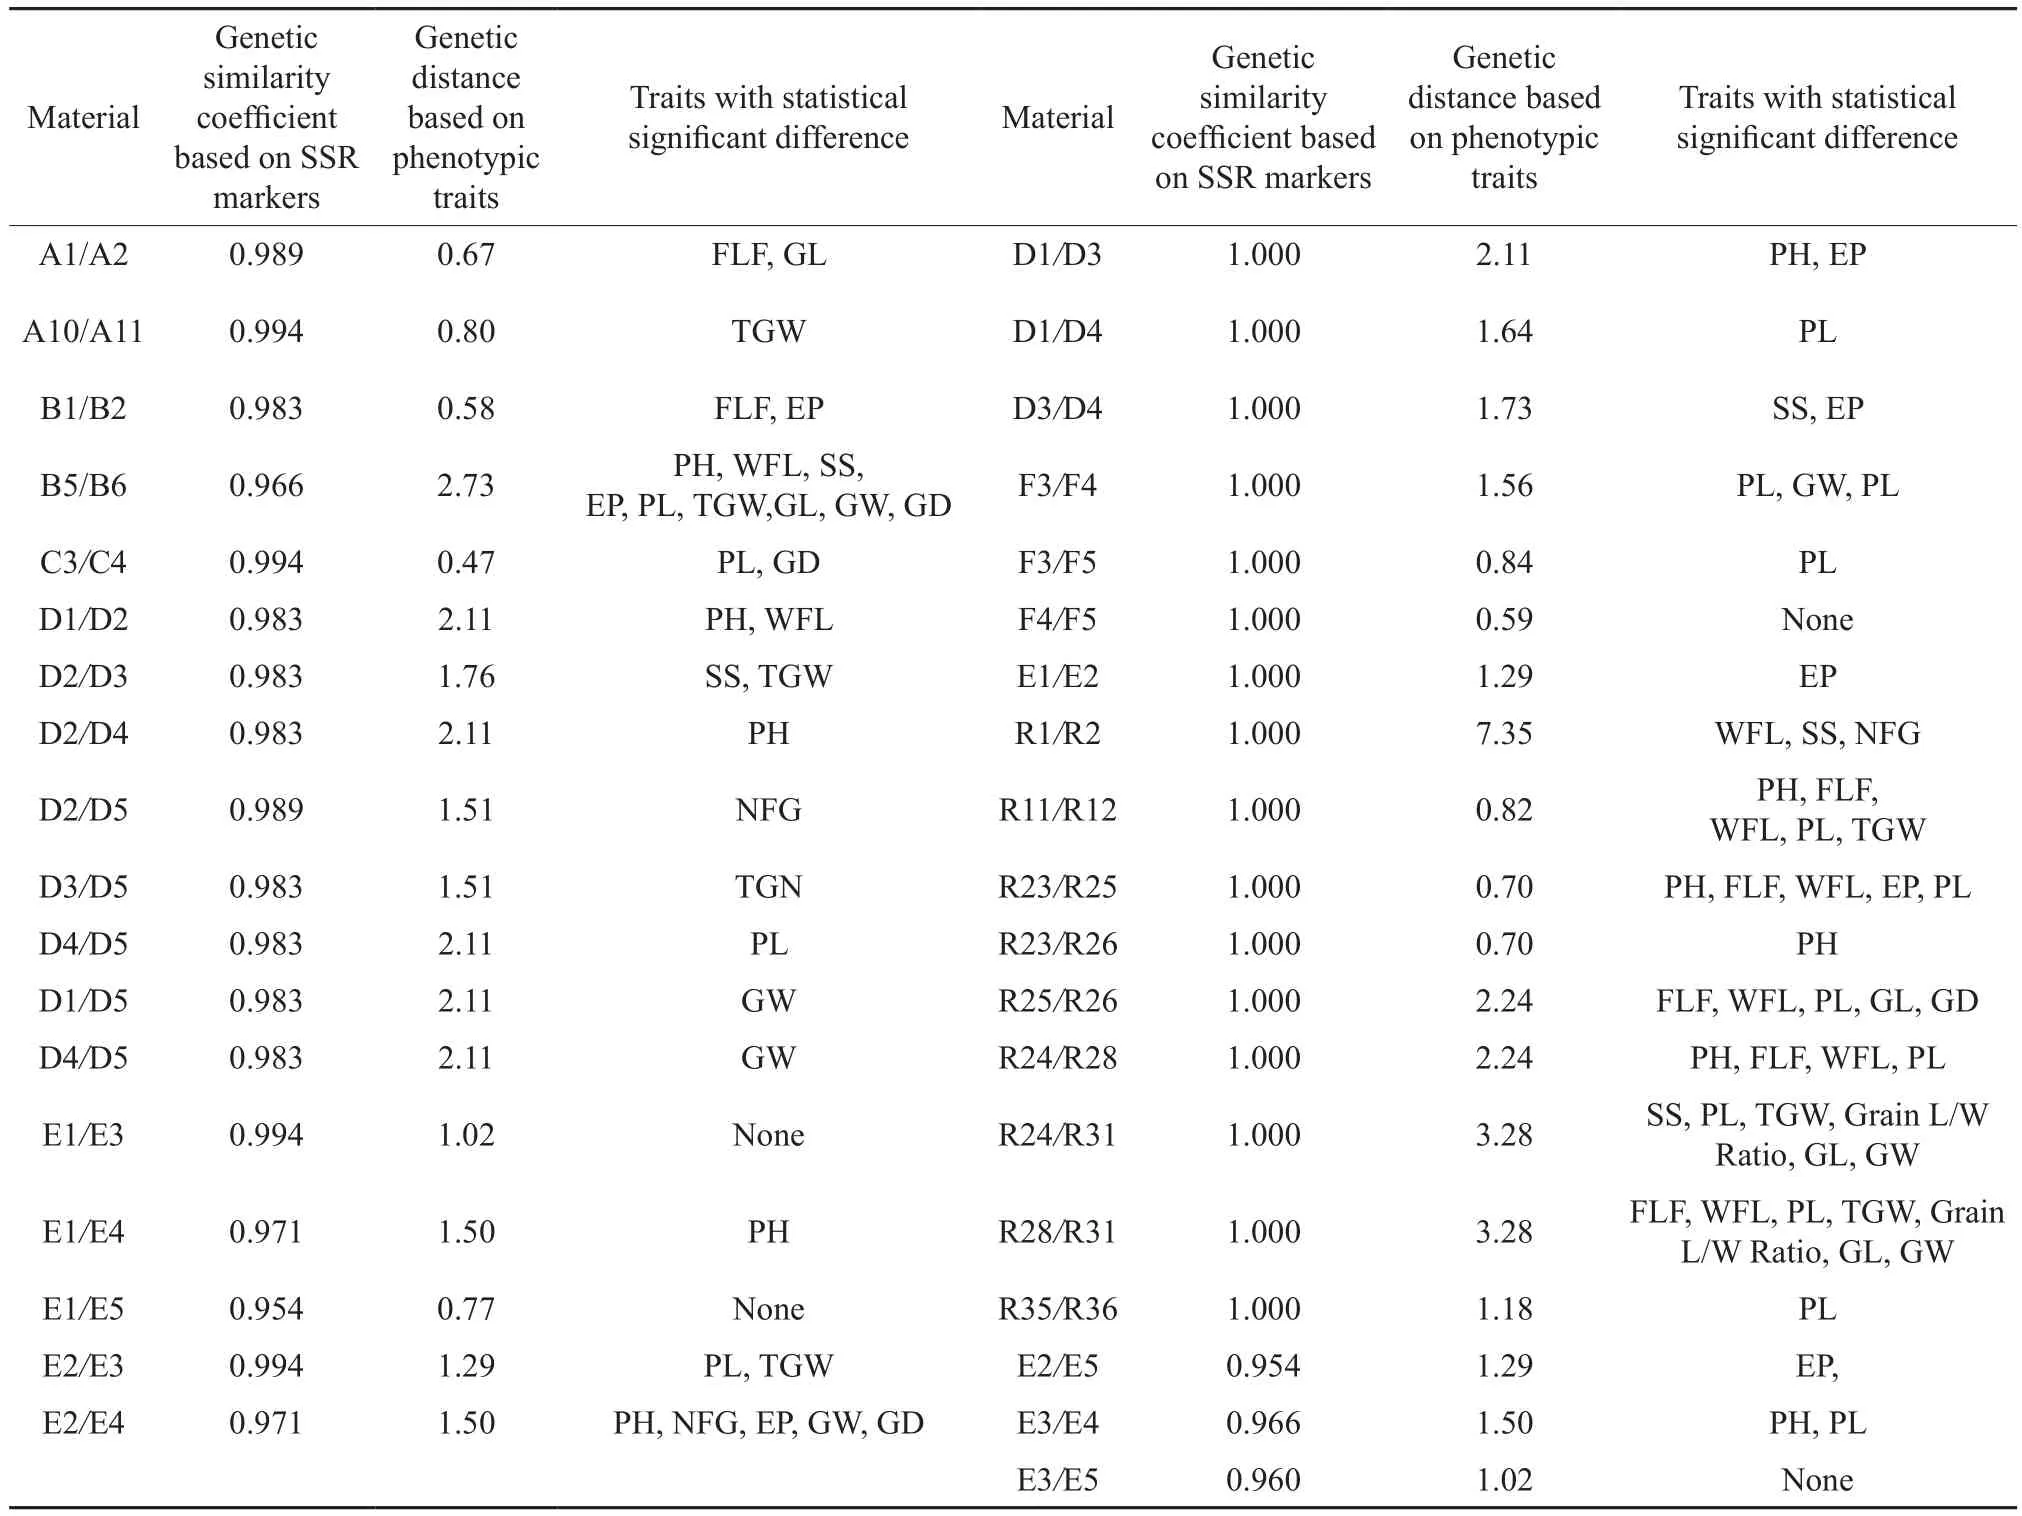
Table 5 Comparison of phenotypic traits between some materials with SSR marker-based genetic similarity coefficient of higher than 0. 95
There were three possible causes of the above phenomenon. First, the small amount of SSR markers (only 49 pairs) could not fully reflect the genetic difference in the DNA. Secondly, only 14 phenotypic traits were analyzed in this study, and they were all quantitative traits. There was a lack of assessment on the resistance and quality-related traits.These 14 quantitative traits were subject to external environment and might produce near-isogenic line materials. Thirdly, the tested materials were gathered from various ecological habitats and then grown in the same testing field. In the change of environment their phenotypic trait genetic similarity could not really reflect the DNA-level genetic similarity[13-16]. The tested household-conserved materials were collected from all around Hunan Province. Farmers have grown these varieties for many successive years in places with rich ecological diversity. But in this experiment,the materials were planted in the same testing field of Changsha, making it hard to reflect the actual DNA level with their phenotypic traits. The SSR marker analysis showed that, except for Group E (containing some commercial seeds, household-conserved for short term), the allelic variations within each subgroup of the household conservation were less than those of the genebank conservation within the same group,indicating the existence of natural and artificial selections in the process of household-conserved materials cultivation year after year. Consistently, the genetic similarity coefficient among the householdconserved rice landraces was higher than among the genebank-conserved higher than between the household-conserved and the genebank-conserved,except for Group C and E. The exception of Group C could be related to the wrong names of the materials C9 and C10.
The genetic relations between the samename or similar-name heterogeneous resources conserved up to now date were classified according to some related reports[7]. In this study, the same varieties were E1 (Hongmi)/E3 (Xiangwanxian No. 12)/E5 (Hongmi), F4/F5 (Guichao No. 2),R28 (Shuidao (nuo))/R38 (Xishuinuo), R27/C2(Sanlicundao), and R16/C1 (Sankecun). The similar varieties were A1/A2 (Honggu), A10/A11(Honggu),B1/B2 (Hongmidongzhan), C3 (Sankecun)/C4 (Sanlicun), the five accessions of Group D(Bendinuogu)/R25 (Minwannuo), (E1, E3, E5)/E2 (Hongmi), (E1, E3)/E4 (Hongmi), F3 (Guichao No. 13)/F4, F5 (Guichao No. 2), R1 (Guiziai)/R2(Guichao), R10 (Rice)/R35 (Yuchi)/R36(Yuchi), R7(Shuidaonuogu)/R26 (Nuodao), R2 (Guichao)/R11(Tesanai), R4 (Nanpingnuogu)/R25 (Minwannuo),R13 (Yuandao)/R37 (Nuomi), R12 (Tieshanai)/R39 (Xinhuangaigandao), R5/R6 (Rice), B1(Hongmidongzhan)/E3 (Xiangwanxian No. 12), A1(Honggu)/E1 (Hongmi), and R19 (Rice)/F1 (Guichao).The resistance and quality-related traits of the above germplasm resources would be further investigated to determine whether they would be worth the mid-term conservations in the genebank. The SSR marker-based genetic similarity coefficient would be recorded in the database. The SSR marker-based genetic similarity coefficient between the household-conserved F1(Guichao) and the genebank-conserved F4/F5(Guichao No. 2) was less than 0.95. Hence, the F1 and F4/F5 were defined as different varieties. They might have mutated during the household conservation, or they were not actually the same landraces with similar names. For convenience, this kind of materials would be marked with the genetic similarity coefficient of the existing genebank-conserved same-name materials. The above same-name and similar-name materials, except E3 (Xiangwanxian No. 12) and other Group E varieties (Hongmi), were selected either from the household or genebank conservations. The SSR marker-based genetic similarity coefficient between either household-conserved materials or genebankconserved materials was larger than that of the household-and genebank-conserved materials. The household-conserved E1 and E5 were commercial seeds with short storage life. This could be the reason that the E3 and other Group E varieties (Hongmi)became an exception.
In this study, the genetic similarity analysis and clustering investigation into the tested materials were conducted based on their phenotypic traits and SSR molecular markers. The findings revealed that most of the materials had relatively close genetic similarity,despite the significant genetic variations in some phenotypic traits and the polymorphic difference of the SSR markers chosen from various chromosomes,possibly becuase most of the selected materials were landraces with same or similar names and exhibited similar phenotypic trait performances in the field, and only 14 traits were measured, which was much less than the DUS evaluation traits. The resistance and other quality-related traits should be evaluated in the further study.
 Agricultural Science & Technology2018年3期
- Agricultural Science & Technology的其它文章
- Review of Factors Affecting the Yield and Quality of Corn Silage
- Effects of Biochar on Substrate Degradation and Ammonia Emission during Aerobic Composting of Chicken Manure
- Phthalate Esters Biodegradation by Fusarium Oxysporum in Vegetable Soil
- One-off Mechanized Fertilization for Maize in Semiarid Area of Jilin Province
- Multiple Shoots Propagation with Bioreactor Culture of Labisia pumila (Bl.) F. Vill.
- Tolerance to Iron-Deficiency Stress of Three Apple Rootstock Species in Hydroponic System
