Effect of a Traffic Speed Based Cruise Control on an Electric Vehicle’s Performance and an Energy Consumption Model of an Electric Vehicle
Anil K. Madhusudhanan and Xiaoxiang Na
Abstract—This paper proposes a cruise control system (CCS) to improve an electric vehicle’s range, which is a significant hurdle in market penetration of electric vehicles. A typical driver or a conventional adaptive cruise control (ACC) controls an electric vehicle (EV) such that it follows a lead vehicle or drives close to the speed limit. This driving behaviour may cause the EV to cruise significantly above the average traffic speed. It may later require the EV to slow down due to the traffic ripples, wasting a part of the EV’s kinetic energy. In addition, the EV will also waste higher speed dependent dissipative energies, which are spent to overcome the aerodynamic drag force and rolling resistance. This paper proposes a CCS to address this issue. The proposed CCS controls an EV’s speed such that it prevents the vehicle from speeding significantly above the average traffic speed. In addition, it maintains a safe inter-vehicular distance from the lead vehicle. The design and simulation analysis of the proposed CCS were in a MATLAB simulation environment. The simulation environment includes an energy consumption model of an EV, which was developed using data collected from an electric bus operation in London. In the simulation analysis, the proposed system reduced the EV’s energy consumption by approximately 36.6% in urban drive cycles and 15.4% in motorway drive cycles. Finally, the experimental analysis using a Nissan e-NV200 on two urban routes showed approximately 30.8% energy savings.
I. Introduction
SIGNIFICANT market penetration of electric vehicles can contribute to prevent global warming from reaching dangerous levels [1]–[3]. A major hurdle towards this goal is limited range, where range is the distance an electric vehicle (EV)can travel from full charge [4]. The limited range arises from the current battery technologies, which have much lower energy densities than diesel or petrol [5]. Therefore, improving an EV’s performance and range is an important research topic.Along this direction, this paper proposes a cruise controller to improve an EV’s performance.
While driving on an urban road or on a motorway, a common driver behaviour is to follow the lead vehicle, i.e.,the vehicle in front, or to drive at the speed limit. This driving style may cause the EV to travel at significantly higher speeds than the average traffic speed. It will also cause the EV to decelerate frequently, e.g., due to the lead vehicle deceleration. During, deceleration, although the EV will regenerate a part of its kinetic energy, it will also waste a part of the kinetic energy. In addition, at higher speeds, the EV will dissipate significantly more electric energy to compensate the dissipative forces such as the aerodynamic force and rolling resistance force [6]. The energy required to compensate the aerodynamic force is proportional to the cube of vehicle speed and the energy needed to compensate the rolling resistance is proportional to the vehicle speed.
Drivers often engage adaptive cruise control (ACC) [7],while driving on a motorway. ACC is a driver assistance system, which controls a vehicle’s speed such that it maintains a safe inter-vehicular distance from the lead vehicle. The inter-vehicular distance reference is usually proportional to the host vehicle speed [8]. Here, host vehicle is the vehicle following the lead vehicle. An EV with active ACC may also travel at speeds higher than the average traffic speed due to a lead vehicle travelling faster than the average traffic speed,which is quite common.
Several works on cruise control design can be found in the literature to reduce a vehicle’s energy consumption by controlling the vehicle speed based on different considerations[9]. In [10]–[16], as a vehicle approaches a traffic signal, the traffic light status signals are used to control the vehicle speed so that the vehicle can cross the signal without stopping. As this strategy reduces the loss of kinetic energy, it reduces the vehicle’s energy consumption. Traffic signal based cruise controller, when combined with a traffic demand responsive model predictive control of traffic signal [17], can be effective in reducing vehicle energy consumption. In [10], [18], [19],road slope data is used in controlling the vehicle so that the change in vehicle’s potential energy is used to reduce the vehicle’s energy consumption. In [10]–[12], [16], in addition to using the traffic light status signals, a safe inter-vehicular distance is maintained from the lead vehicle. In [13], [15],[19]–[21], the vehicle’s power train model is used to improve the vehicle’s energy efficiency. In [12], the traffic queue length between the vehicle and the upcoming traffic light is estimated and used to further improve the benefit of using traffic light status signals. In [11], [14], [15], [18], the speed limits, e.g., imposed by the road authority, are used as constraints so that the controller does not push the vehicle to illegal speed values. In [19], historic speed data over a period of 4 weeks and distance along the route are used to reduce energy consumption.
Although the cruise control designs [10]–[16], which consider the upcoming traffic signal, can reduce a vehicle’s energy consumption, it is not effective on parts of highways without traffic lights. In addition, although control systems based on data from network are becoming widespread [22], it is not straightforward to access the traffic light status signals.For example, it may require permission from the authorities and may be expensive. It further requires a system for wireless transmission and reception of these data between the vehicle and the traffic light infrastructure. An alternative option would be to estimate the traffic signal timing using deep learning methods [23]. On the other hand, accessing the average traffic speed is relatively cheaper and easier, e.g., it is available via a TomTom application programme interface (API). In addition,a cruise controller that considers the average traffic speed can be effective on parts of highways with no traffic lights.Therefore, it is worth exploring the effect of incorporating the average traffic speed in a cruise control design.
This paper investigates a cruise control system (CCS),which prevents an EV from speeding considerably above the average traffic speed and maintains a safe inter-vehicular distance from the lead vehicle. Estimation of the intervehicular distance is possible using commercial automotive radar. One version of the proposed system assumes availability of the average traffic speed via an infrastructure to vehicle communication, whereas the other version proposes a solution if the average traffic speed data is absent. As the proposed system controls the vehicle speed, it is important to ensure that the vehicle will not collide with the lead vehicle.
The main contributions of this paper are as follows:
1) An energy consumption model of an EV was developed using data collected from an electric bus operation in London.
2) A cruise controller, which prevents an electric vehicle from speeding significantly above the average traffic speed and maintains a safe inter-vehicular distance from the lead vehicle, is proposed.
3) Effect of the proposed control strategy on energy consumption of an EV was evaluated in a MATLAB simulation environment for different urban and motorway drive cycles.
4) Safety analysis, considering the worst case scenario involving the lead vehicle, was performed.
5) Effect of the proposed method was analysed using experimental data from an EV.
This paper is structured as follows. Section II describes the energy consumption model. Section III shares the proposed cruise control design. Section IV shows the analytical worstcase safety analysis. Section V shows the simulation results and Section VI shows the simulation based worst-case safety analysis. Section VII shares the experimental evaluation of the proposed method and Section VIII concludes the work.
II. EV Energy Consumption Model
As shown in Fig. 1, the energy consumption model includes a battery pack, inverter, electric machine, transmission, brake allocation, driver and a vehicle dynamics block. The model was developed in a MATLAB Simulink environment. It combines the modelling works in [24], [25]. The battery pack has a capacity of 138 kWh. It discharges to operate the electric machine as a motor when the EV accelerates and charges while the electric machine operates as a generator during regenerative braking scenarios.
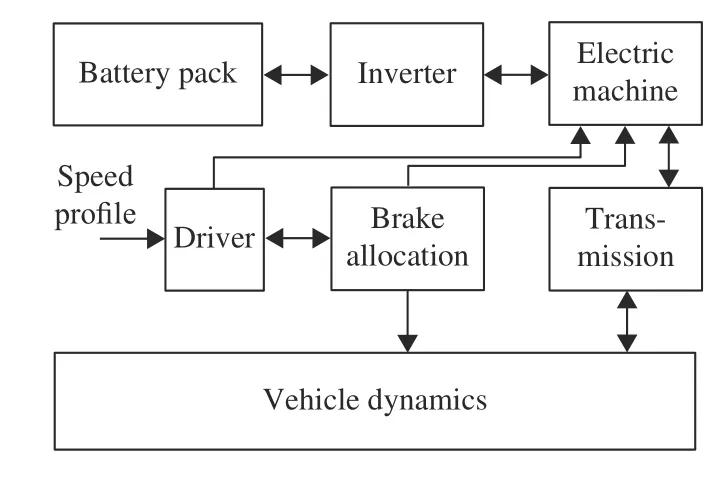
Fig. 1. Schematic diagram of the EV energy consumption model.
As shown in Fig. 2, the inverter has a two dimensional efficiency map as a function of the electric machine’s revolutions per minute (RPM) and torque. As shown in Fig. 3,the electric machine (EM) also has a two dimensional efficiency map as a function of its RPM and torque. In addition, as shown in Fig. 4, it has a one dimensional peak power map as a function of its RPM. The electric machine’s peak power is 250 kW. The inverter and electric machine characteristics in Figs. 2–4 are scaled characteristics based on [25]. The transmission has an assumed constant efficiency of 0.95.
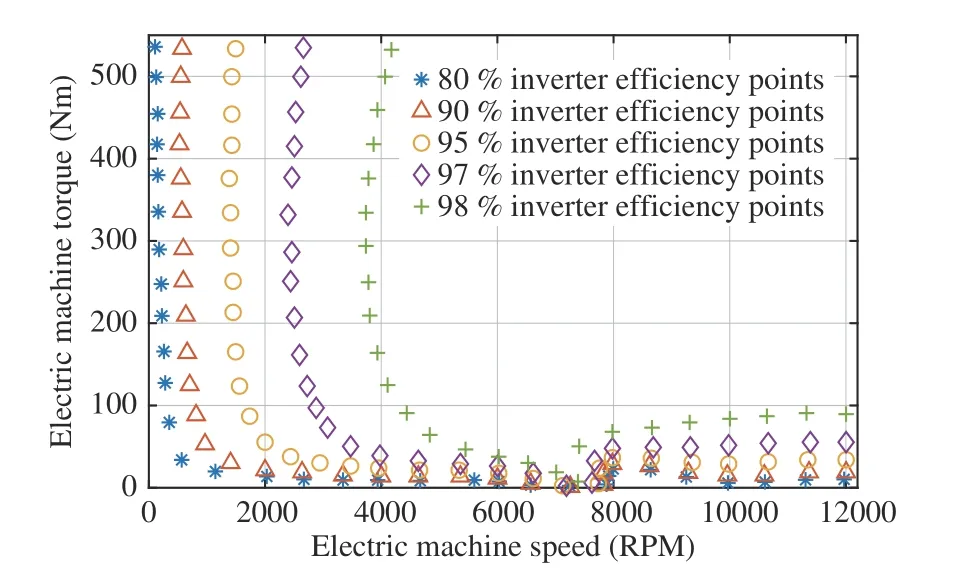
Fig. 2. The inverter’s efficiency map as a function of the electric machine’s speed and torque.
The driver block contains a proportional-integral controller,which applies required throttle and brake inputs to track the vehicle speed reference. The brake allocation block distributes the brake power demand between the traditional friction brakes and regenerative braking. The friction brakes are only used if the brake power demand is higher than the regenerative braking capacity, which depends on the electric machine’s peak power at the current electric machine speed.Otherwise, only regenerative braking is used.
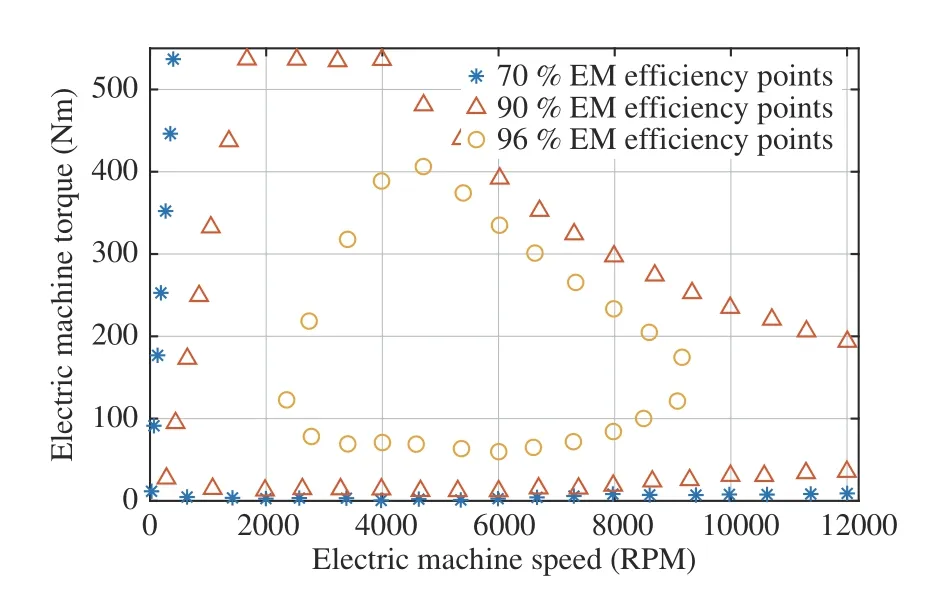
Fig. 3. The electric machine’s efficiency map as a function of its speed and torque.
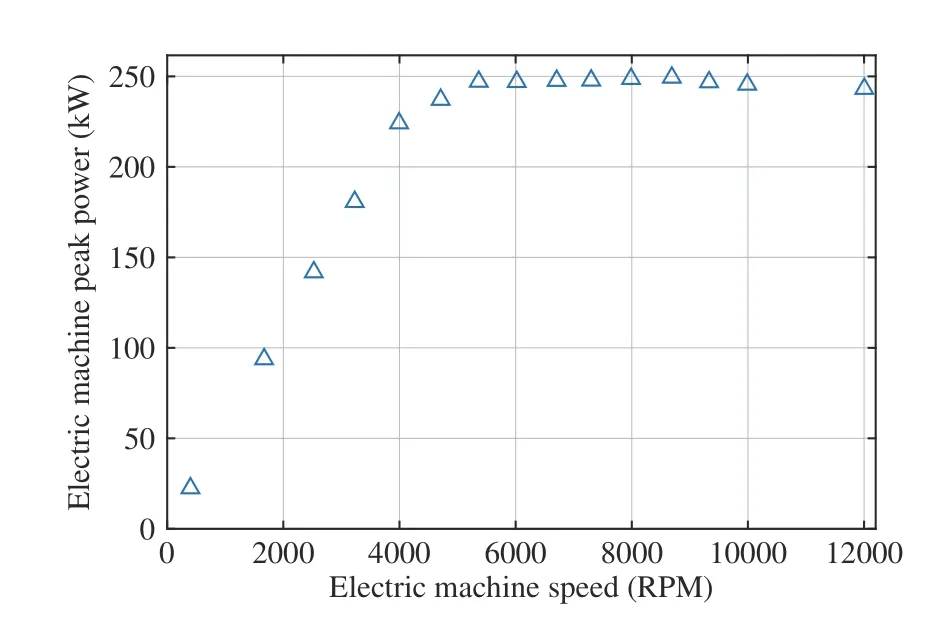
Fig. 4. The electric machine’s peak power as a function of its speed.
The vehicle dynamics block contains equations of motion governing the power required to accelerate, power required to compensate the aerodynamic drag, power required to compensate the rolling resistance and the power required to overcome the road slope. It contains the standard longitudinal equations of motion of a vehicle, (1) to (6) [6], [24].
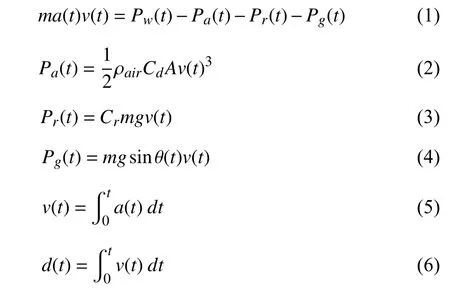
When the electric machine works as a motor, via the inverter, electric energy flows from the battery pack to the electric machine, where the electric energy is converted to mechanical energy. During this process, a part of the energy is lost in the inverter and electric machine, as shown in the efficiency maps in Figs. 2 and 3. Further, the mechanical energy is transmitted from the electric motor to the driven wheels. A part of the mechanical energy is lost during this transfer as per the transmission efficiency. The integral ofwith respect to time, when the electric machine works as a motor, is the mechanical energy that reached the drive wheels.When the electric machine works as a generator, i.e., during regenerative braking, energy flows in the reverse direction and finally reaches the battery pack after incurring losses in transmission, electric machine and the inverter. The model uses the same efficiency maps in both directions.
Fig. 5 shows the vehicle speed and the battery pack’s state of charge (SOC) during a real-life drive cycle from an electric bus operation in London. The measurements were collected using an SRF data logger, which the co-author developed at the Centre for Sustainable Road Freight (SRF), University of Cambridge. It uses a smartphone and a Bluetooth dongle. The Bluetooth dongle connects to the EV’s fleet management service (FMS) port and transmits the vehicle data using Bluetooth communication to the smartphone. Fig. 5 also shows the simulation model’s vehicle speed and SOC during the same drive cycle, which correlate well with the measurements.
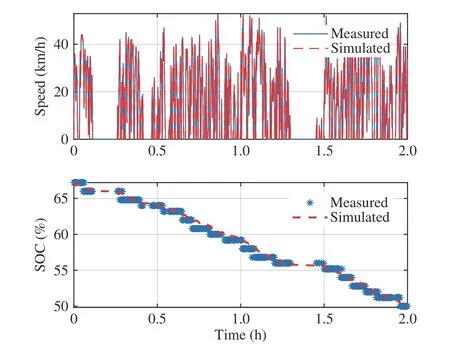
Fig. 5. Simulation of the EV energy consumption model during a real-life drive cycle.
Fig. 6 shows the simulation model’s electric power profile during a part of the drive cycle and the measured electric power profile. It also shows the simulated and measured vehicle speed profiles during this part of the drive cycle. The negative power values represent the electric machine working as a motor, whereas the positive power values represent the electric machine working as a generator for regenerative braking. The simulated and measured electric power profiles correlate well. In Fig. 5, the simulated energy consumption indicator, i.e., the SOC, has less than 1% difference from the measured value. However, this is not always the case.
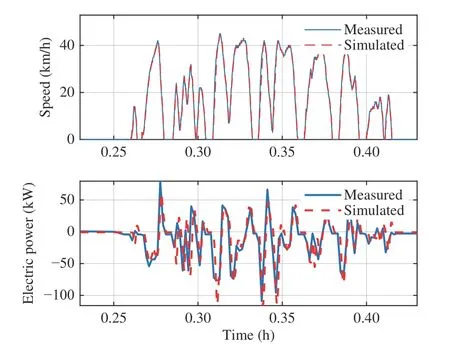
Fig. 6. Comparison of the simulation model’s electric power profile with the measurements.
Table I shows the simulation model’s energy consumption in 7 urban drive cycles (DCs), the measured energy consumption in these drive cycles and the error. In these drive cycles, the RMS error of the energy consumption model is less than 8%.
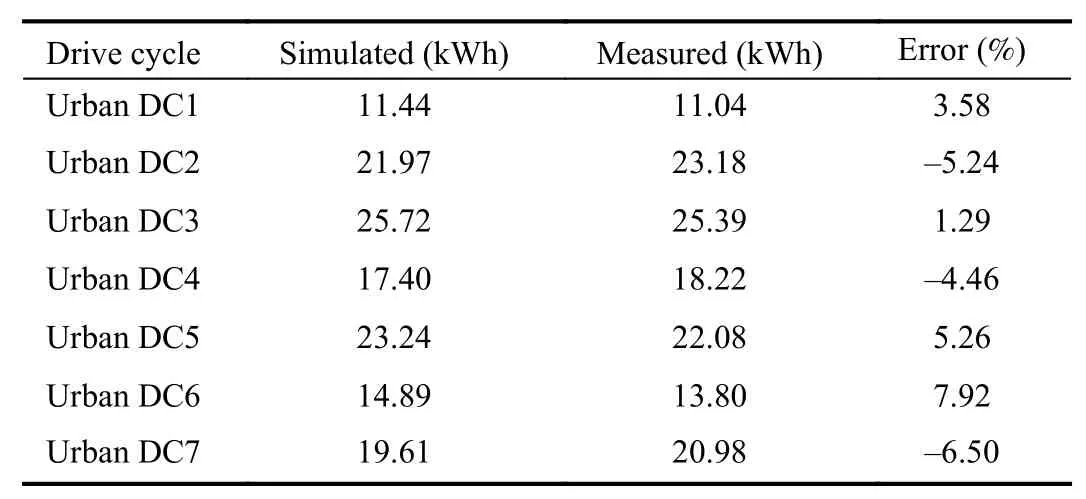
TABLE I The Measured and Simulated Energy Consumption in Different Drive Cycles
III. Cruise Control System
The CCS design uses a two dimensional kinematic model,represented by the following equations.


Discretisation of (9) with a sampling time ofs gives the following discrete-time model.


Fig. 7. The host EV in closed loop with the CCS.
As shown below, the calculation of speed reference depends on the host EV’s inter-vehicular distance from the lead vehicle and the average speed of the traffic ahead.
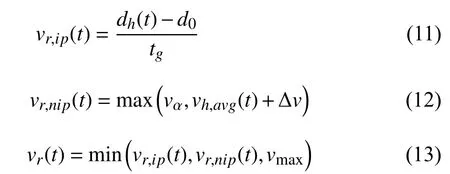
The availability of average speed of the traffic ahead was assumed, e.g., from a TomTom API. It can also be obtained from a system using traffic cameras on motorways, which are currently used to enforce traffic laws such as speed limits.When the average traffic speed was unavailable, a moving average of the host EV’s speed values in the past 5 minutes was used.
IV. Safety Analysis
The CCS design uses DLQR theory so that the closed loop eigenvalues are stable. However, a stable system is not necessarily safe. For example, in theory, an EV with the proposed CCS, which is stable in closed loop, should reach a positive inter-vehicular distance from the lead vehicle at steady state. However, if the inter-vehicular distance becomes non-positive during the transient period, an accident will occur. Therefore, it is important to perform a safety analysis to check whether the closed loop system is collision-free.
The safety analysis was performed in the worst case scenario. In the worst case scenario’s initial condition, the lead vehicle is stationary, the host EV is cruising at the maximum speed in the UK, i.e., 70 mph (112.7 km/h), and the time gap is 2 s. In this initial condition, the following equations represent the inter-vehicular distance dynamics.

Discretisation of (14) with a sampling time ofs gives

Using the DLQR gain from Section III in the control input gives the following:

whereKis the DLQR gain. Rewriting (16) gives

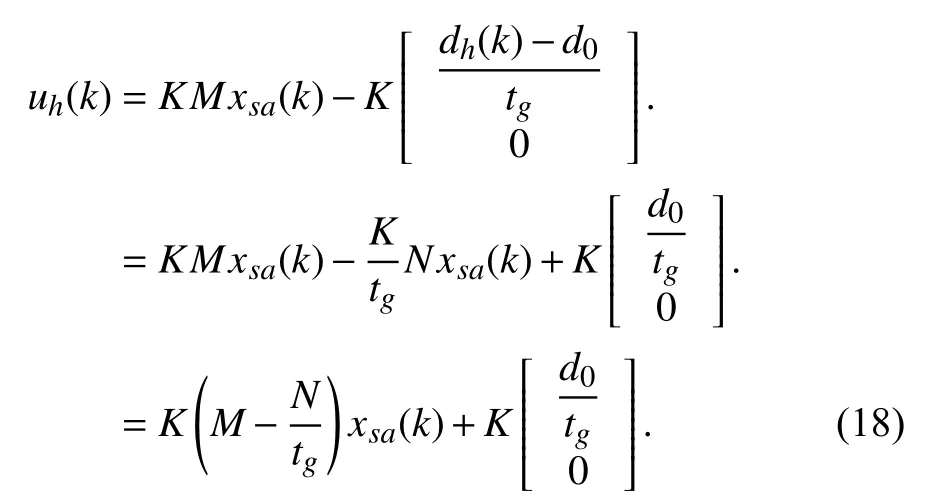


where

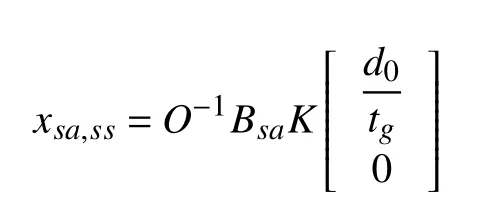
At steady state, the inter-vehicular distance,should be positive to ensure a collision-free operation, i.e.,

where

Using (22), the steady state inter-vehicular distance was found to be 5 m. Therefore, the CCS prevents collision with the lead vehicle in the worst case scenario. In addition to the steady state, it is important to ensure that the inter-vehicular distance remains positive during the transient period. This was performed using the following linear matrix inequality (LMI).

V. Simulation Results
This section describes the simulation results of the proposed CCS in closed loop with the EV energy consumption model from Section II. The simulations were performed in MATLAB and employed two EV models. One was the lead vehicle and the other was the host EV. In each simulation, the lead vehicle received a speed profile from a set. The speed profile set were collected from an electric bus operation in London in 2017 and from a CNG truck operation on UK motorways in 2018. The speed profiles collected from London have speeds less than 30 mph (48.3 km/h), representative of urban driving. On the other hand, the speed profiles collected from UK motorways have speeds higher than 50 mph(80.5 km/h), representative of highway driving.
The lead vehicle tracked the speed profile, whereas the CCS controlled the host EV’s speed. In order to analyse the effect of the CCS on the EV performance, another simulation was run, where a conventional ACC controlled the host EV. The conventional ACC controlled the host EV’s speed such that it maintained a safe inter-vehicular distance from the lead vehicle with a time gap of 2 s [7]. The ACC behaviour was assumed comparable to common driver behaviour. In numerous simulations, the host EV’s energy consumption with the proposed CCS was compared against the case with the conventional ACC. In addition, the two configurations of the CCS, i.e., with the average traffic speed available and otherwise, were evaluated. The case without the measurement of average traffic speed is discussed first.
Figs. 8–10 show the simulation results during an urban drive cycle (DC) of 2000 s. From these results, the following observations can be made.
1) With the ACC, the host EV consumed approximately 6.84 kWh of electric energy, whereas with the proposed CCS,the host EV consumed approximately 3.5 kWh of electric energy. This implies the proposed CCS reduced the host EV’s energy consumption by approximately 48%.
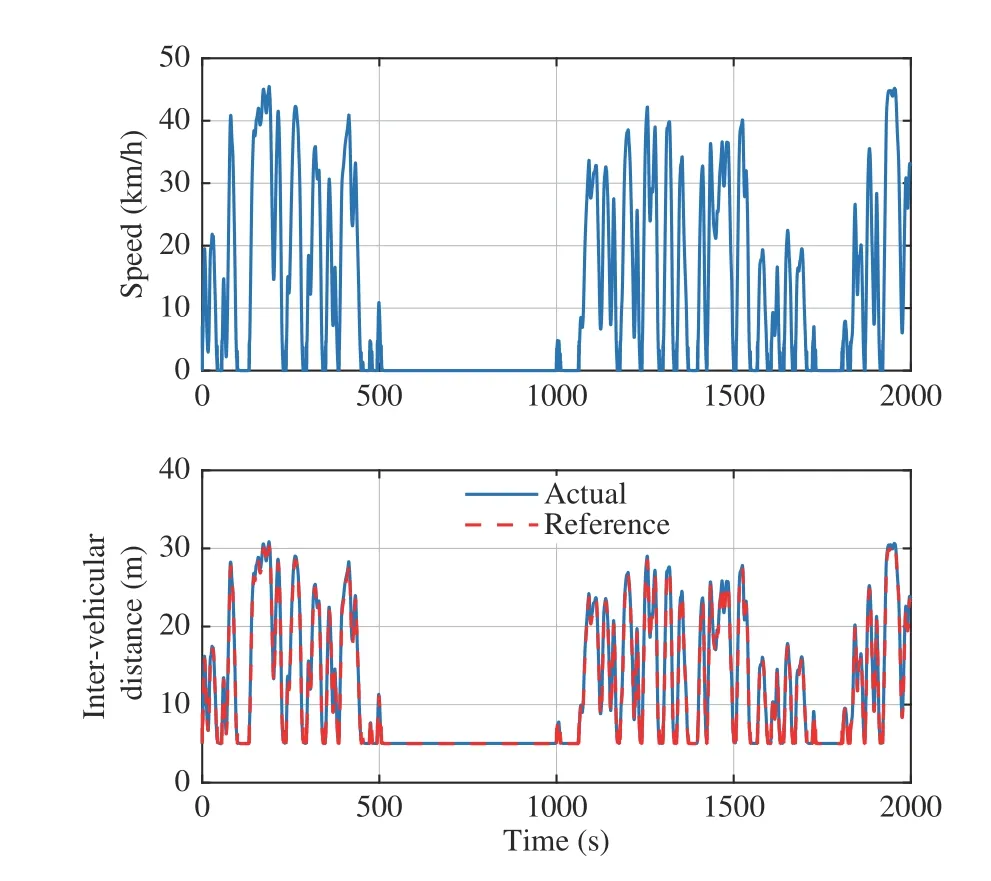
Fig. 8. The host EV’s speed and inter-vehicular distance during a simulation with the ACC. The lead vehicle follows an urban drive cycle.
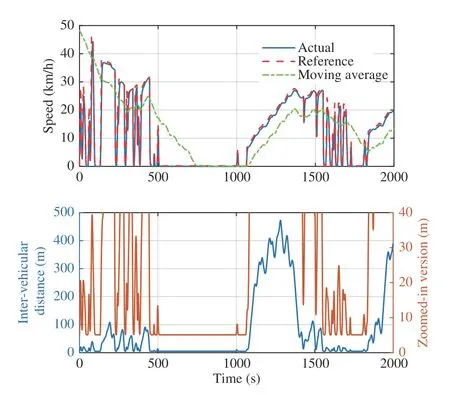
Fig. 9. The host EV’s speed and inter-vehicular distance during a simulation with the proposed CCS. The lead vehicle follows an urban drive cycle.
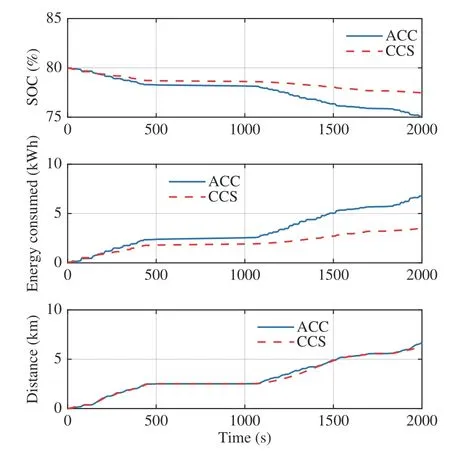
Fig. 10. Comparison of the host EV’s performance between the ACC case and the CCS case. During this simulation, the lead vehicle follows an urban drive cycle.
2) With the CCS, the host EV travelled approximately the same distance compared to the ACC case. This implies the CCS did not increase the travel time significantly.
3) Both controllers kept a safe inter-vehicular distance from the lead vehicle.
Table II shows the simulation results during eight urban drive cycles and eight motorway drive cycles, comparing the performance of the proposed CCS against the conventional ACC. From the table, the following observations can be made.
1) During all the drive cycles, the host EV consumed lesser electric energy with the proposed CCS.

TABLE II The Host EV’s Performance in Different Drive Cycles When the Average Traffic Speed WAS Unavailable
2) During the urban drive cycles, the CCS provided an average 33.93% reduction in the host EV’s energy consumption.
3) During the motorway drive cycles, the CCS provided an average 11.30% reduction in the host EV’s energy consumption.
Table III shows the simulation results, when the measurement of average traffic speed was available. From the table, the following observations can be made.

TABLE III The Host EV’s Performance During Different Drive Cycles When the Average Traffic Speed Was Available
1) During all the drive cycles, the host EV consumed lesser electric energy with the proposed CCS.
2) During the urban drive cycles, the CCS provided an average 39.29% reduction in the host EV’s energy consumption.
3) During the motorway drive cycles, the CCS provided an average 19.44% reduction in the host EV’s energy consumption.
Note that the duration of each urban drive cycle is 2000 s and that of each motorway drive cycle is 1800 s. Therefore,the sum of all urban simulation durations is around 9 hours and sum of all motorway simulation durations is 8 hours.Comparing the results in Table III against the results in Table II shows that the availability of the average traffic speed improves the EV performance.
VI. Worst Case Safety Analysis
This section describes simulation results of the worst case scenario, where the lead vehicle was stationary and the host EV had an initial speed of 70 mph (112.7 km/h) with an initial time gap of 2 s. Fig. 11 shows the host EV’s speed and intervehicular distance. Atthe host EV had a speed of 112.7 km/h and the time gap was 2 s, i.e., an inter-vehicular distance of 67.6 m. In addition, the lead vehicle was stationary, causing the host EV to brake. The inter-vehicular distance plot shows that the proposed CCS stopped the host EV with a safe inter-vehicular distance of 5.1 m from the lead vehicle. This simulation result agrees with the findings in Section Ⅳ, i.e., the proposed CCS keeps the host EV safe in the worst case scenario.
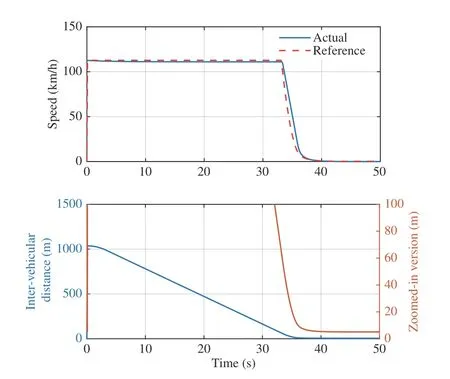
Fig. 11. The host EV’s speed and inter-vehicular distance during the worst case safety analysis.
Note that the safety analyses in this section and Section IV do not consider lateral stability. In situations where lateral stability issues may arise, integration of lateral vehicle safety systems [27]–[29] may be required to keep the host EV safe.However, this is outside the scope of this work.
VII. Experimental Analysis
This section describes the experimental analysis of the proposed method. The experiments were performed using a Nissan e-NV200 (Fig. 12(b)) from the Cambridge Green Challenge. The experiments were performed on two urban routes (Fig. 12(a)) in Cambridge. As it was not possible to modify the EV, the analysis was performed using a human driver.
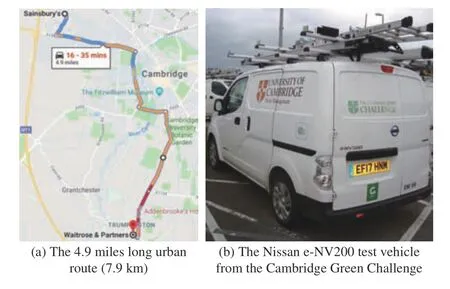
Fig. 12. The test vehicle and the urban route.
The onward journey from Sainsbury’s to Waitrose &Partners in Fig. 12(a) is called Route A and the return journey is called Route B. First, the EV was driven on Route A and Route B on a Wednesday afternoon such that an ACC or average driver behaviour was imitated. An SRF Data Logger,described in Section II, was used to measure the vehicle speed profile. The initial and final battery pack SOCs were also noted. Using the collected data, the average traffic speed was calculated. On the next working day, around the same time,the EV was again driven on the same routes. This time, the vehicle speed was limited to slightly above the average traffic speed, as proposed in the controller design in Section III.Whenever the time gap between the EV and the lead vehicle was less than approximately 2 s, the vehicle speed was controlled so that a safe time gap of approximately 2 s could be maintained. As before, the vehicle data were collected.
Fig. 13 shows the EV’s speed profiles during the tests. From the results shown in Table IV, it is clear that the proposed method reduced the EV’s energy consumption on average by 30.8% without increasing the travel time. Note that the tests were performed around the same time, on consecutive working days. On each day, the test started on Route A with the same initial battery SOC of 95%.
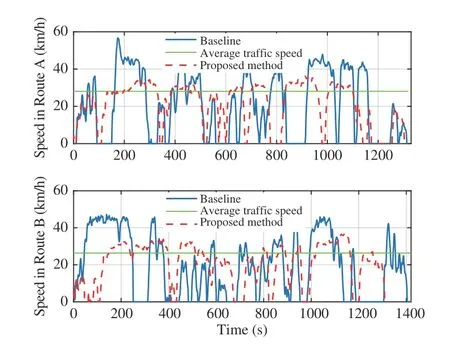
Fig. 13. The EV’s speed profiles during the experimental analysis.

TABLE IV The Experimental Results
VIII. Conclusions
A cruise control system (CCS) to improve an EV’s performance, which is a significant hurdle in market penetration of electric vehicles, is proposed in this work. The proposed CCS controls an EV’s speed such that it prevents the vehicle from speeding significantly above the average traffic speed. The system prevents an EV from wasting energy in unnecessary acceleration, deceleration and compensation of dissipative forces such as the aerodynamic drag force and rolling resistance. In addition, it maintains a safe intervehicular distance from the lead vehicle so that the EV operates safely.
An energy consumption model of an EV was also developed using data collected from an electric bus operation in London.The proposed controller was designed and simulated in a MATLAB simulation environment. A safety analysis was also performed to ensure collision free vehicle operation in the worst case scenario. In the simulations performed, on average,the proposed system reduced the EV’s energy consumption by approximately 36.6% in eight urban drive cycles and by approximately 15.4% in eight motorway drive cycles. The experimental analysis using a Nissan e-NV200 showed 30.8%electric energy savings on two urban routes.
Future work includes integration with a real-time average traffic speed measurement, e.g., from TomTom API and considering the EV power train model. The next steps also include design and testing of a traffic speed based speed limiter system, which can be implemented in an EV without autonomous driving capabilities.
Acknowledgment
The authors would like to thank the Cambridge Green Challenge and the Estate Management at University of Cambridge for their support and providing the test vehicle.The authors would also like to thank Stagecoach Group PLC for giving access to their electric bus operation in London and Optare Group Limited for their help in decoding the FMS port data from the electric bus.
 IEEE/CAA Journal of Automatica Sinica2020年2期
- IEEE/CAA Journal of Automatica Sinica的其它文章
- Artificial Intelligence Applications in the Development of Autonomous Vehicles: A Survey
- Data-Driven Based Fault Prognosis for Industrial Systems: A Concise Overview
- Review of Antiswing Control of Shipboard Cranes
- Research Progress of Parallel Control and Management
- Influence of Data Clouds Fusion From 3D Real-Time Vision System on Robotic Group Dead Reckoning in Unknown Terrain
- Proximity Based Automatic Data Annotation for Autonomous Driving
