Understanding the Role of Cu/ZnO lnteraction in CO2 Hydrogenation to Methanol
Congming Li , Kuo Chen Xiaoyue Wang Nan Xue , Hengquan Yang ,
1 Key Laboratory of Coal Science and Technology, Ministry of Education and Shanxi Province, Taiyuan University of Technology,Taiyuan 030024, China.
2 School of Chemistry and Chemical Engineering, Shanxi University, Taiyuan 030006, China.
Abstract: Using renewable green hydrogen and carbon dioxide (CO2) to produce methanol is one of the fundamental ways to reduce CO2 emissions in the future, and research and development related to catalysts for efficient and stable methanol synthesis is one of the key factors in determining the entire synthesis process. Metal nanoparticles stabilized on a support are frequently employed to catalyze the methanol synthesis reaction. Metal-support interactions (MSIs) in these supported catalysts can play a significant role in catalysis. Tuning the MSI is an effective strategy to modulate the activity,selectivity, and stability of heterogeneous catalysts. Numerous studies have been conducted on this topic; however, a systematic understanding of the role of various strengths of MSI is lacking. Herein, three Cu/ZnO-SiO2 catalysts with different strengths of MSI, namely, normal precipitation Cu/ZnO-SiO2 (Nor-CZS), co-precipitation Cu/ZnO-SiO2 (Co-CZS), and reverse precipitation Cu/ZnO-SiO2(Re-CZS), were successfully prepared to determine the role of such interactions in the hydrogenation of CO2 to methanol.The results of temperature-programmed reduction (H2-TPR) and X-ray photoelectron spectroscopy (XPS) characterization illustrated that the MSI of the catalysts was considerably affected by the precipitation sequence. Fourier transform infrared reflection spectroscopy (FT-IR) results indicated that the Cu species existed as CuO in all cases and that copper phyllosilicate was absent (except for strong Cu-SiO2 interaction). Transmission electron microscopy (TEM), X-ray diffraction (XRD), and N2O chemical titration results revealed that strong interactions between the Cu and Zn species would promote the dispersion of Cu species, thereby leading to a higher CO2 conversion rate and improved catalytic stability. As expected, the Re-CZS catalyst exhibited the highest activity with 12.4% CO2 conversion, followed by the Co-CZS catalyst(12.1%), and the Nor-CZS catalyst (9.8%). After the same reaction time, the normalized CO2 conversion of the three catalysts decreased in the following order: Re-CZS (75%) > Co-CZS (70%) > Nor-CZS (65%). Notably, the methanol selectivity of the Re-CZS catalyst was found to level off after a prolonged period, in contrast to that of Co-CZS and Nor-CZS. Investigation of the structural evolution of the catalyst with time on stream revealed that the high methanol selectivity of the catalyst was caused by the reconstruction of the catalyst, which was induced by the strong MSI between the Cu and Zn species, and the migration of ZnO onto Cu species, which caused an enlargement of the Cu/ZnO interface. This work offers an alternative strategy for the rational and optimized design of efficient catalysts.
Key Words: Cu/ZnO-SiO2 catalysts; Metal-support interaction; CO2 hydrogenation; Methanol
1 lntroduction
Methanol as an important C1building-block could be converted to various high value-added chemicals. Cu-based catalyst has attracted extensive attention in methanol synthesis because of its excellent redox property, low cost and high recyclability1,2. Among various Cu-based catalysts, Cu/ZnO based catalysts are appealing for the CO2hydrogenation to methanol process due to their unique catalytic properties3,4.
As a structure-sensitive reaction, catalytic performance of CO2hydrogenation to methanol is significantly affected by catalyst morphology, particle size, crystalline size of support and especially metal-support interaction5. Moreover, depending on the complexity of real systems, dynamic behaviors of structure as well as surface composition observed during reaction process thus affect the nature of active sites and the catalytic performance of Cu-ZnO based catalysts6. Several studies found the directly proportional relationship between methanol synthesis activity and Cu0surface areas (SACu) determined with N2O adsorption7,8. However, taken separately, Cu and ZnO have a low activity for methanol synthesis as well as nonlinearity in correlation of SACuand catalytic activity is often emerged, which indicate the existence of metal-support interaction such as Cu-Zn interaction (CuZn alloy) and Cu-ZnO interaction9. Fujitani et al. observed that Zn is present in the metallic form and proposed that the metallic Cu-Zn alloy is a catalytic active species for the methanol synthesis from CO2and H210. Sebastian et al. supported the formation of a Cu-Zn surface alloy during pretreatment and further found a strong interdependency of methanol synthesis activity and the Zn coverage11.
On the other hand, Cu-ZnO interaction already acts as a leading proposed model, which exerts a significantly impact on the catalytic performance, such as stability, activity and selectivity via a synergy of Cu and ZnO at the interface,electronic interactions and strong metal-support interactions(SMSI). It is acknowledged that the high-energy sites at the interface are generally accepted as the catalytic sites for methanol synthesis12. Recently, Chen and Rodriguez et al. found that surface Zn transforms into ZnO during CO2hydrogenation to methanol and allows the formation of active Cu-ZnO interface, accompanied with an increase in the catalytic activity for methanol synthesis13. Tsang et al. investigated that morphology effect of ZnO on its interaction with Cu. The results showed that the exposed polar (002) face in platelike ZnO had a much stronger electronic interaction at Cu-ZnO interface,leading to a higher methanol selectivity from CO2and H214. The formation of Cu-ZnO interface drive the transfer of charge from ZnO:Al metal oxide toward Cu metal particles and accumulate at the interface of the Cu-ZnO:Al, which decrease apparent activation energy and increase the reaction order of CO215.Willinger et al. reported that the formation of metastable“graphite-like” ZnO overlayer on Cu nanoparticles induced by strong metal-support interaction (SMSI) during reductive activation. The synergy between Cu and ZnO provide multiple functions in promoting active sites and stabilizing Cu phase mesostructure16. A surface enrichment of Zn in the Cu-ZnOAl2O3catalyst fabricate a unique synergistic Cu-ZnO interaction in boosting CO2hydrogenation and inhibiting RWGS reaction as well as the electronic stabilization of Cu species against reoxidation by CO2and/or H2O, leading to higher activity and methanol selectivity for CO2hydrogenation17. In addition, the dispersion of Cu species could be greatly promoted by the introduction of Zn species, and more synergetic Cu-ZnO sites,therefore, could be exposed to the feed gases leading to a higher reaction activity18. Although the Cu-ZnO interaction has been widely studied, the effect of tuning various strength of metalsupport interaction on catalyst structure and catalytic performance not yet is investigated.
In the present work, three CuZnO/SiO2catalysts with different strength of metal-support interaction (MSI) were prepared in order to clarify the impact of the interaction between Cu and Zn species on the catalytic performance. The structural evolution of catalyst under the reaction conditions was investigated to establish the relationship between the catalyst structure and catalytic performance. Experimental results suggested that stronger MSI played a critical role in the CO2hydrogenation, and could facilitate the formation of well dispersed metal species thereby affecting the catalytic performance.
2 Materials and methods
2.1 Catalyst synthesis
2.1.1 Normal precipitation method
10.0 g silica gel (Sigma-Aldrich, 99.9%) was added into a 250 mL beaker containing 200 mL deionized water, which was denoted as suspension A. 6.21 g Cu(NO3)2·3H2O (AR) and 4.12 g Zn(NO3)2·6H2O (AR) were dissolved in deionized water to obtain metal salt solution B ([M2+] = 1 mol·L-1). Initially, the solution B was dropped into the suspension A. After being stirring for 0.5 h, the mixture was heated to 70 °C. Subsequently,a proper amount of Na2CO3(AR) solution (1 mol·L-1) was added into this mixture to adjust the pH to 7. Next, the resultant mixture was further stirred for 1 h and the generated solid was recovered by hot flirtation and washed with deionized water five times. The obtained solid was dried at 60 °C in air overnight and calcined at 350 °C for 4 h, eventually obtaining the catalyst that was denoted as Nor-CZS.
2.1.2 Co-precipitation method
10.0 g silica gel (Sigma-Aldrich, 99.9%) was suspended in 200 mL deionized water. After this suspension was heated to 70 °C. A mixture of nitrate solution (mentioned above) and Na2CO3(AR) solution (1 mol·L-1) was dropwise added into the above suspension. The suspension was stirred by a magnetic stirrer and its pH was always maintained at 7 during the preparation process. The following steps were similar with Section 2.1.1. The final sample was denoted as Co-CZS.
2.1.3 Reverse precipitation method
A given amount of Na2CO3(AR) solution (1 mol·L-1) was poured into a silica gel suspension (10.0 g silica gel (Sigma-Aldrich, 99.9%)) was suspended in 200 mL deionized water).The resultant mixture was heated to 70 °C. The mixed nitrite solution (mentioned in Section 2.1.1) was then dropped into this mixture. Afterwards, Na2CO3(1 mol·L-1) solution was added to the suspension quickly to adjust the pH to 7. The following steps were similar with Section 2.1.1 and the achieved sample was denoted as Re-CZS.
2.2 Catalyst characterization
N2physical adsorption/desorption was carried out on a 3H-2000PS2 instrument. Briefly, after being degassed for 4 h at 150 °C, the sample was characterized at liquid nitrogen temperature. The specific surface area, average pore size and total pore volume were obtained by the B.E.T method and Barrett-Joyner-Halenda (BJH) model, respectively.
Wide range X-ray diffraction (XRD) pattern was collected from a Rigaku D/Max2500 V diffractometer equipped with Kαradiation of Cu source (λ = 0.154056 nm). All the XRD patterns were scanned from 10° to 80° at a speed of 8 (°)·min-1.
Temperature-programming desorption (TPD) was performed on a Micromeritics AutoChem 2920 system. For example, 40 mg sample was reduced by 10% H2/Ar gas flow at 250 °C (heating rate 10 °C·min-1) for 2 h. After cooling down to 50 °C under Ar flow, the sample was treated with 10% H2/Ar (10% CO/He or 10% CO2/He) for 30 min. Then the sample was flushed with Ar again to sweep off the physically adsorbed H2(CO or CO2).Finally, the system was heated to 800 °C and the H2(CO or CO2)desorption signal was monitored using a TCD detector. The operation of CO-TPD and CO2-TPD was similar with H2-TPD.
Temperature-programming reduction (TPR) was also carried out on Micromeritics AutoChem 2920 system. The sample(about 40 mg) was placed in a U-shape quartz reactor.Subsequently, the system was heated to 400 °C and kept for 0.5 h under Ar stream to remove adsorbed impurities. After cooling down to 50 °C, 10% H2/Ar (flow rate of 30 mL·min-1) was introduced into the system. Then, the sample was heated to 500 °C (10 °C·min-1) and H2consumption was calculated by TCD detector.
The dispersion of Cu species was estimated by using the N2O chemisorption method as stated in our previous work19.
X-ray photoelectron spectroscopy (XPS) and X-ray excited Auger spectra (XAES) were recorded on an ESCALab220i-XL photoelectron spectrometer with monochromatic Al KαX-ray source (300 W). The C 1s spectral line (284.8 eV) was selected as the reference to correct the static charge accumulation.
Fourier Transform Infrared Reflection spectroscopy (FT-IR)were recorded on a BRUKER TENSORII spectrometer,equipped with an electromagnetic source in the mid-IR region(4000-400 cm-1). The samples were diluted with 1% (w) KBr and then measured at room temperature.
Transmission electron microscopy (TEM) was conducted by utilizing JEOL JEM-2100FMII microscope and operated at an accelerating voltage of 200 kV. Especially, at least 80 Cu particles were selected to estimate the average particle size and the surface average particle size was calculated by Eq. (1):

dis the average particle size andDiis the diameter of the particle.
2.3 Catalyst evaluation
Catalytic reactions were tested on a fixed-bed stainless steel reactor (φ9 mm × l450 mm). Before reaction, about 0.5 g sample granules (20 to 40 mesh) was loaded into the middle of the tube reactor and reduced at 250 °C by 10% H2in N2for 4 h.Subsequently, the premixed reaction gas (consisted of 24% CO2,72% H2and 4% Ar where Ar was acted as internal standard) was flushed into reactor for 45 min and then the system pressure was raised to 3 MPa under 50 °C. Finally, the system was heated to 250 °C to evaluate its catalytic performance. The products were analyzed by an on-line gas chromatograph (Panna A91)equipped with a thermal conductivity detector (TCD) and a flame ionized detector (FID).
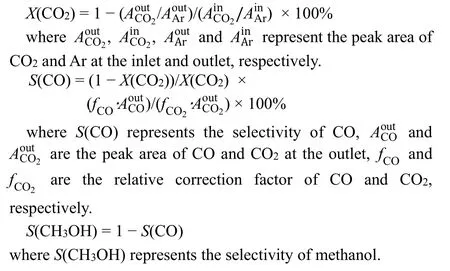
The CO2conversion (denoted asX(CO2)) was calculated according to an internal standard method (4% Ar as an internal standard), assuming that the amount of Ar remained constant in the reaction process. The equation as follow:
3 Results and discussion
3.1 Metal-support interaction
TPR analysis were employed to check the metal-support interaction and reducibility of Cu species on the three catalysts(Fig. 1). The main reduction peaks appeared between 240-280 °C illustrating well dispersed Cu species on all the samples20.It is generally considered that higher reduction temperature of CuO might originate from the stronger metal-support interaction and/or lager particle size (poor dispersion of Cu species).
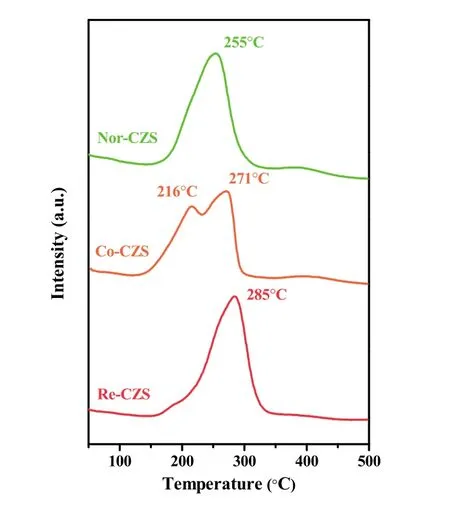
Fig. 1 TPR profiles of the CuZn/SiO2 catalysts prepared with different methods.
As listed in Table 1, the H2consumption of Re-CZS, Co-CZS and Nor-CZS catalysts was 1.64, 1.57 and 1.46 mmol·g-1,respectively. The higher hydrogen consumption was related with the more reducible Cu species existing on the catalyst due to the higher dispersion of Cu species. On the other hand, higher reduction temperature was reasonably attributed to the stronger metal-support interaction rather than lager CuO particles. It is thus believed that the Re-CZS catalyst possessed the strongest metal-support interaction while Nor-CZS catalyst might possess the weakest metal-support interaction. Furthermore, the Co-CZS sample showed two reduction peaks suggesting higher heterogeneity of Cu species (various particles size) which would be testified later (Section 3.2).
The XPS spectrum of Cu 2p(Fig. S1, in Supporting Information, the same below) revealed the distinct chemical environments of the Cu species. The emergence of shake-up satellite peaks at 941.6-944.9 eV unveiled that the Cu species in the fresh samples mainly existed in the form of CuO21. All the Cu 2p3/2signals consisted of two overlapped peaks and their core level signals were deconvoluted into two individual peaks (Fig.2 and Table 2). The peak at 935.1-935.6 eV is usually attributed to the Cu species with stronger interaction with support matrix,and the latter peak (from 933.3 to 933.7 eV) might be ascribed to Cu species with the weaker metal-support interaction22. The characterization results convincingly validated that the metalsupport interaction was successfully altered by the precipitation sequence.
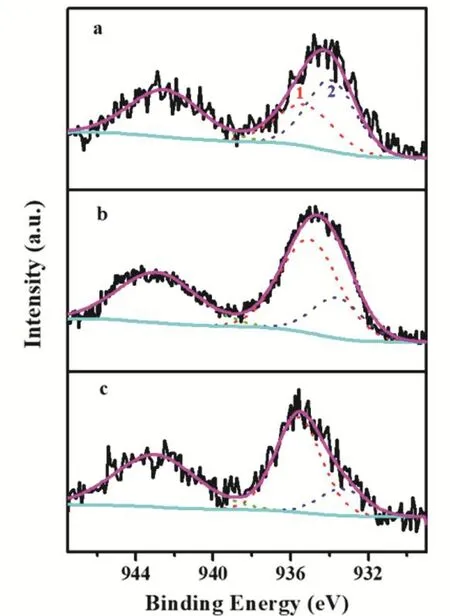
Fig. 2 XPS spectra of Cu 2p3/2 region of various fresh CuZnO/SiO2catalysts.
As listed in Table 2, Cu species in the form of both strong metal-support interaction and weaker metal-support interaction were also observed in three catalysts. However, the Re-CZS catalyst possessed the most Cu species (~78%) with strong metal-support interaction, closely followed by Co-CZS (~73%).In contrast, the Nor-CZS contained the most Cu species (~60%)with weaker metal-support interaction. The significant difference in the fraction of Cu species with a strong metalsupport interaction indicated that three catalysts possessed different strength of metal-support interaction. By combining theH2-TPR and XPS results, it could be proposed that the Re-CZS catalyst provided more Cu species with strong metal-support interaction than Nor-CZS catalyst.

Table 1 Chemical properties of various CuZnO/SiO2 catalysts.
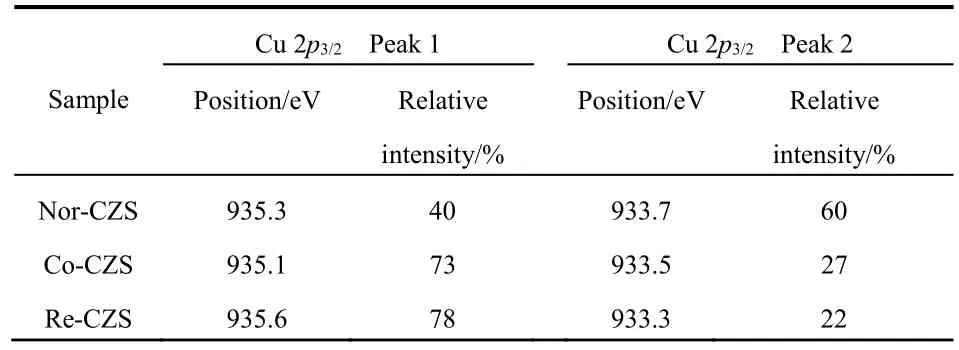
Table 2 XPS results of Cu 2p3/2 region of various fresh CuZnO/SiO2 catalysts.
3.2 Textural properties
The N2-physisorption isotherms for all the catalysts are shown in Fig. 3, in which isotherm of silica gel was also included for comparison. Obviously, the isotherm was of type IV and exhibited a H1 hysteresis loop for silica gel support illustrating that the existence of abundant cylindrical channels on the support. Meanwhile, the high similarity of all isotherms for four samples (including silica gel) indicated that the textures of support were almost preserved after the loading of Cu species23.
As listed in Table 3, after loading metal, the BET surface area and pore volume of all catalysts decreased in the following order:Nor-CZS > Co-CZS > Re-CZS. It was noted that the micropore of Co-CZS and Re-CZS samples was not detected, indicating the metal species were mainly distributed on the external-surface of SiO2support and then the micropore was blocked by metal particles. Interestingly, the Nor-CZS catalyst displayed the lowest BET surface area and the minimum pore volume and average pore size.
XRD patterns are shown in Fig. 4. The presence of weak and broaden diffraction peaks at 35.6° and 38.9° implied that most of the Cu species on all the calcined samples were in the form of well dispersed CuO. The crystallite sizes of CuO in the three catalysts displayed in a descending order: Co-CZS (9.1 nm) >Nor-CZS (7.8 nm) > Re-CZS (n.d.) (n.d. meaning diffraction peaks on Re-CZS were too weak to calculate the CuO crystallite sizes according to the Scherrer formula). As a complementary characterization for XRD, N2O chemisorption results are also listed in Table 1. The dispersion of Cu was 18.5% (Re-CZS),16.1% (Co-CZS) and 12.2% (Nor-CZS), respectively. However,the dispersion of Cu particles determined from the N2O chemisorption result was not in full accord with the XRD results.This phenomenon might be attributed to the existence of trace amount of lager CuO (monitored by XRD) on the Co-CZS catalyst19,23, while the less dispersion of Cu determined by N2O chemisorptions on Nor-CZS might also originate from its relatively weak metal-support interaction.
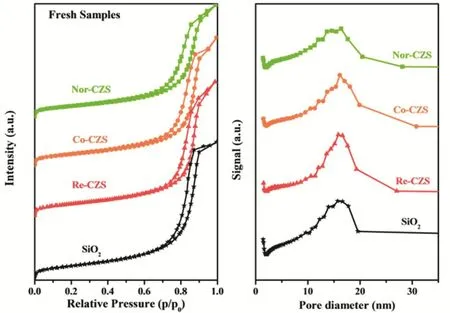
Fig. 3 N2-physisorption isotherms and pore size distribution of various CuZn/SiO2 catalysts.
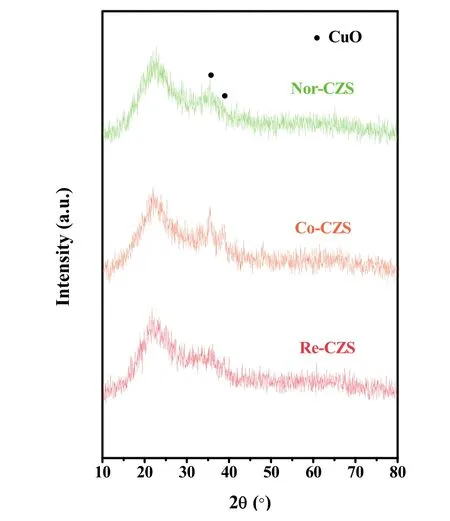
Fig. 4 XRD patterns of various CuZn/SiO2 catalysts.

Table 3 Textural properties of silica gel and as-calcined catalysts prepared by different methods
To further illustrate the above conjectures, the representative TEM micrographs and size distribution for three different samples are shown in Fig. 5 and Table 1. The crystallite sizes of CuO in these three catalysts displayed in a descending order: Co-CZS (10.5 nm) > Nor-CZS (9.8 nm) > Re-CZS (8.5 nm).Obviously, partial agglomeration of Cu particles occurred on the support surface for the Co-CZScatalyst. Taking XRD along with N2O chemisorption results into consideration, it could be concluded that the CuZnO/SiO2catalysts with different metalsupport interaction could be modulated through varying the precipitation subsequence24.
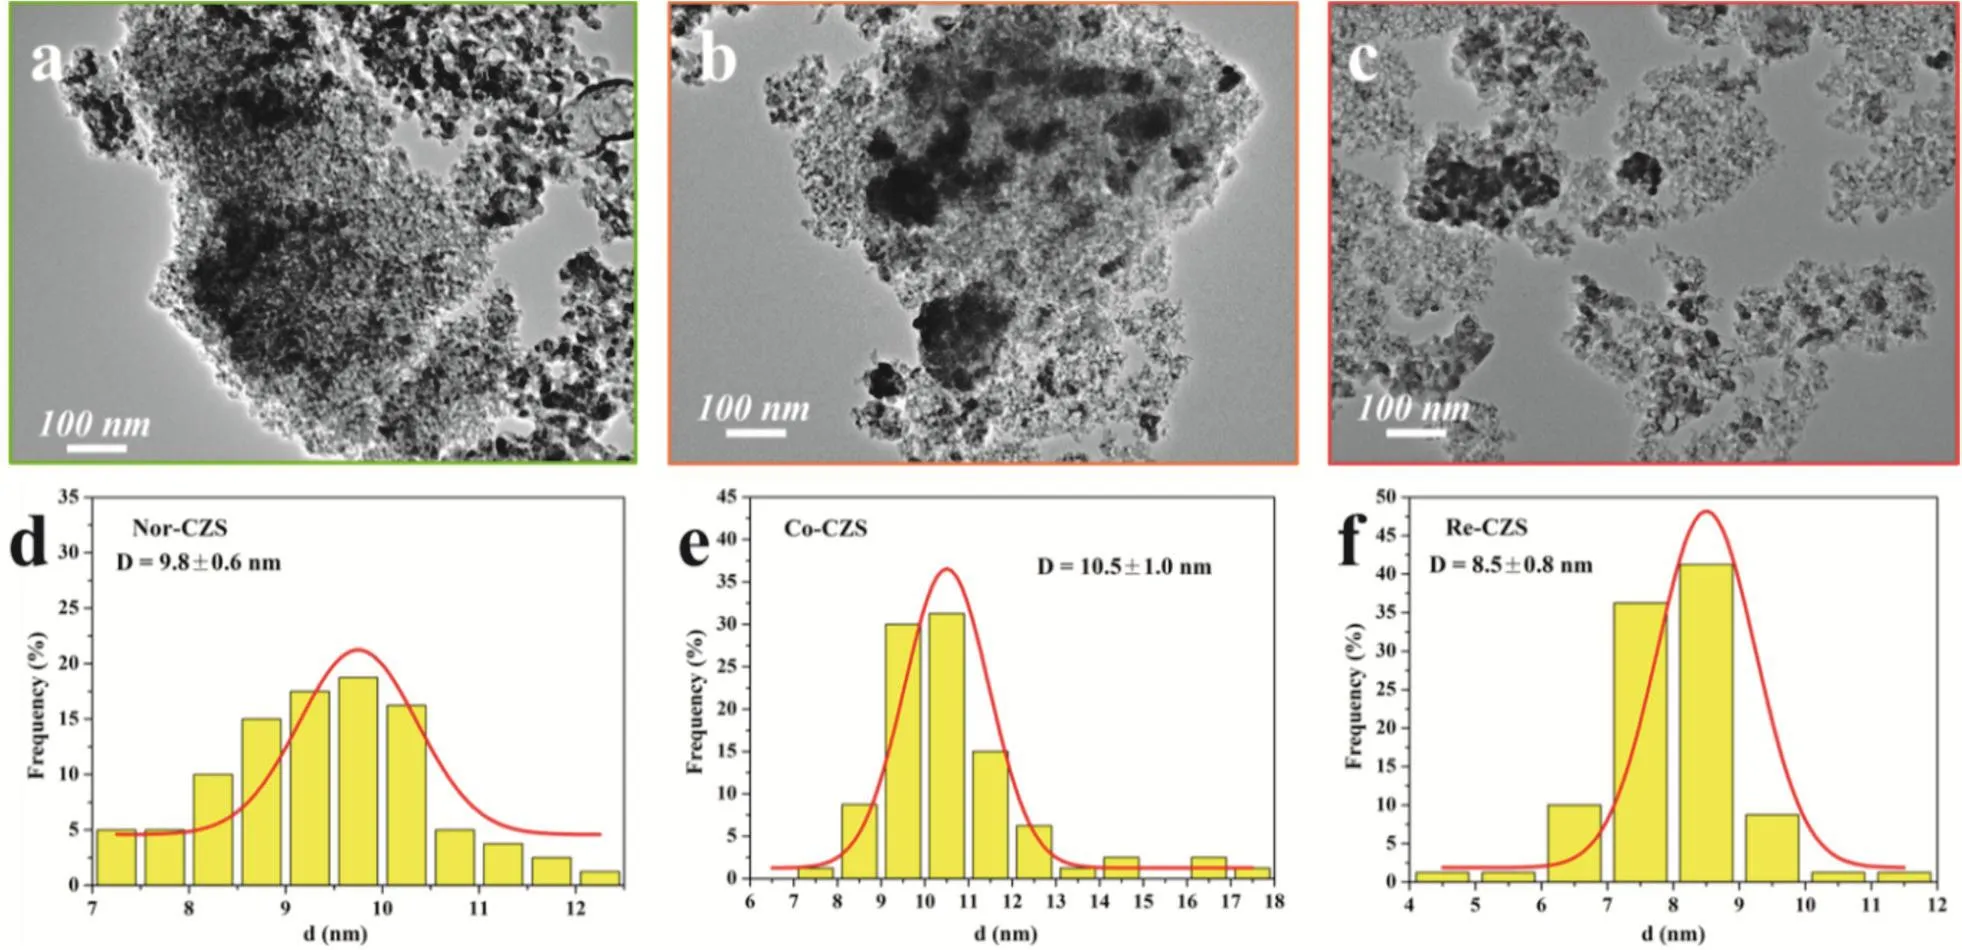
Fig. 5 TEM micrographs and size distribution for fresh (a, d) Nor-CZS catalyst, (b, e) Co-CZS catalyst, (c, f) Re-CZS catalyst.
To further exclude the formation of Cu phyllosilicate, FT-IR analysis was carried out (Fig. 6). The characteristic bands at 800 cm-1and 1118 cm-1are ascribed to υSiOof different vibration modes of SiO223,25-27. Complete decomposition of carbonates was confirmed by the absence of 1430-1450 cm-1bands in all calcined samples28,29. Particularly, the characteristic δOHband at 670 cm-1was not detected, indicating the absence of Cu phyllosilicate in all the samples27,30.
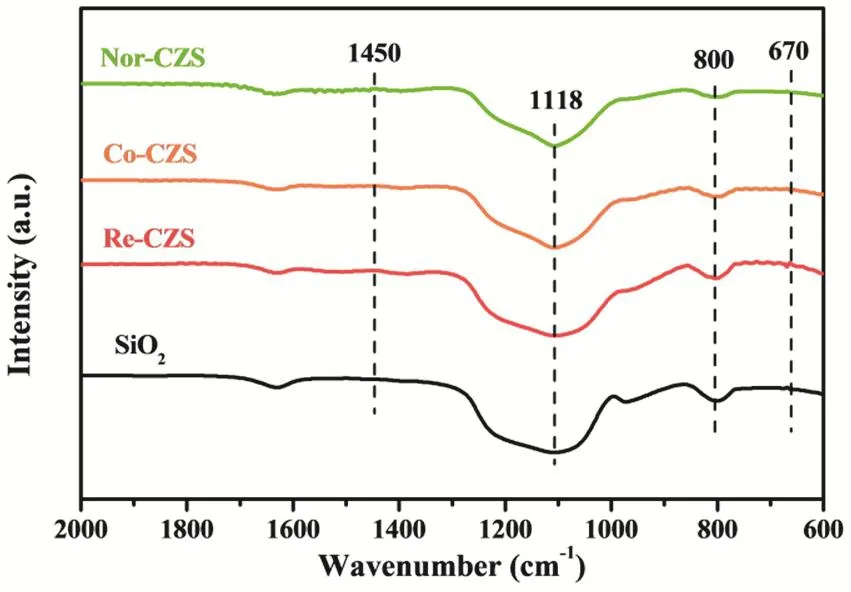
Fig. 6 FT-IR spectra of various CuZn/SiO2 catalysts.
Taken together, the Cu species were well dispersed on all fresh catalysts in the form of CuO regardless of the preparation method. The absence of copper phyllosilicate in all the catalysts elucidated that their notable difference in the metal-support interaction possibly originated from the distinction of the interaction between Cu and ZnO, instead of Cu and SiO2, which was significantly impacted by metal loading process. The stronger metal-support interaction between Cu and ZnO might lead to a higher dispersion of Cu species31,32.
3.3 Catalysis
3.3.1 Catalytic performance
The steady-state activities of the catalysts were measured in a fixed-bed reactor to investigate the relationship between metalsupport interaction and activity of CO2hydrogenation to methanol. It is generally considered that catalytic activity of CO2hydrogenation to methanol is related to the dispersion of Cu species. As described above, the Re-CZS catalyst was supposed to have the best catalytic activity while the Co-CZS catalyst might possess secondary catalytic activity and the Nor-CZS catalyst ought to exhibit the poorest catalytic activity. As expected, the Re-CZS catalyst exhibited the highest activity with 12.4% CO2conversion, followed by the Co-CZS catalyst(12.1%) and then the Nor-CZS catalyst (9.8%) (Fig. S2A and Table 4). The turnover frequency (TOF) values were also calculated with the assumption that each surface Cu atom was an active site (Table 4). An opposite tendency between CO2conversion rate and TOF values was observed due to the small size of Cu particles33,34. The Nor-CZS catalyst exhibited slightly higher TOF value than the Co-CZS sample, demonstrating that the existence of small amount of large bulk CuO had negligible impact on the Cu intrinsic activity. Since, under the current synthesis condition, CO2was mainly involved in two parallel reactions as follows35-37:

Table 4 The initial CO2 conversion rate, methanol selectivity and methanol productivity (PMeOH).

The reaction conditions for methanol synthesis were then assessed. As shown in Fig. 7, the Co-CZS catalyst displayed thebest reaction activity under low reaction pressure, while the best reaction activity was obtained over the Re-CZS catalyst with increasing the pressure. However, the former possessed the better methanol selectivity compared with later consistently.
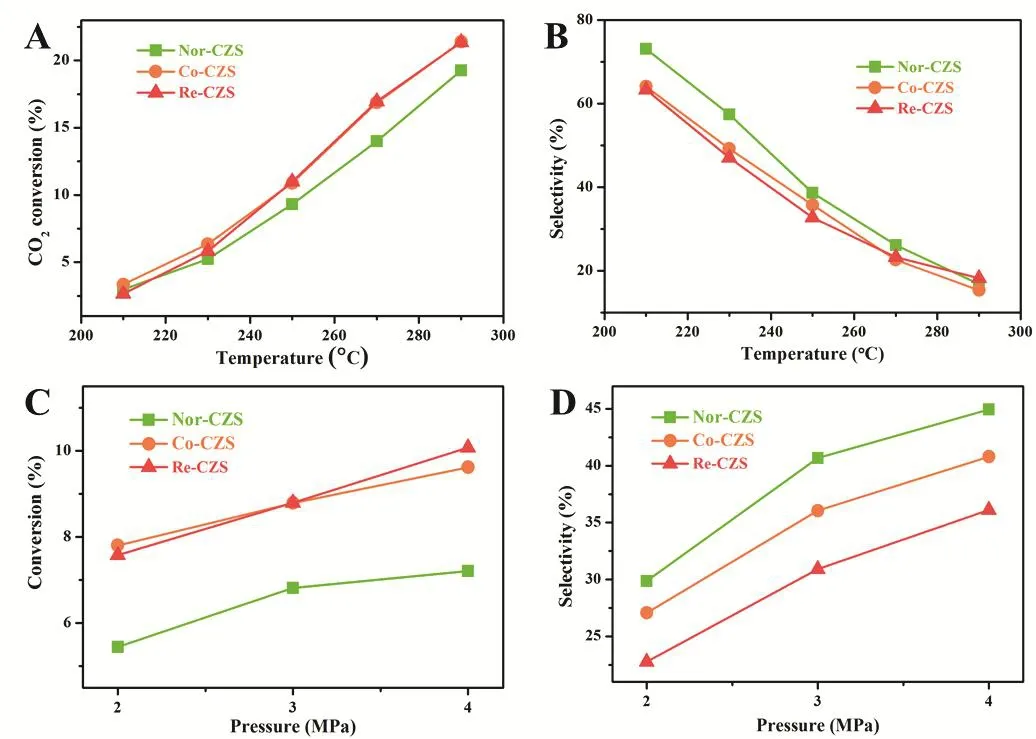
Fig. 7 Effect of reaction temperature on CO2 conversion (A) and MeOH selectivity (B) and effect of reaction pressure on CO2 conversion (C) and MeOH selectivity (D).
On the other hand, methanol synthesis was always accompanied by intense exothermic process and accordingly restrained when increasing temperature, while RWGS reaction would be facilitated due to its endothermic process. For this reason, the enhancement of CO2conversion rate accompanied with a decline of methanol selectivity was observed throughout the temperature-rising process. Similar with the former results,the Nor-CZS catalyst also exhibited the highest methanol selectivity and the Re-CZS catalyst possessed the poorest methanol selectivity when the reaction temperature was lower than 270 °C. However, an interesting phenomenon was found when the reaction temperature increased to 290 °C, where the highest methanol selectivity over the Re-CZS catalyst, Nor-CZS and Co-CZS catalysts displayed similar methanol selectivity.These experimental results illustrated that reaction temperature showed great effect on catalytic behavior in comparison to the effect of the reaction pressure. Namely, strong metal-support interaction would improve the dispersion of Cu species and further promote catalytic activity, however, it led to a negative influence on methanol synthesis.
3.3.2 Catalytic stability
It was recognized that the catalytic deactivation could be significantly suppressed by the enhancement of metal-support interaction. To compare the relative rate of deactivation, catalytic stability for CO2hydrogenation are evaluated (Fig. 8). Clearly,catalytic activity dropped rapidly during the initial stage of reaction for all catalysts. Especially for the Nor-CZS and Co-CZS catalysts, they suffered from the most severe catalytic deactivation and the reduction of CO2conversion rate(normalized) was more than 20% (22.3%) in the initial 400 min.In contrast, the Re-CZS catalyst displayed better catalytic stability in the initial 400 min and its CO2conversion(normalized) reduced by 15.0%. The stability of three catalysts decreased in the following sequence: Re-CZS > Co-CZS > Nor-CZS. As mentioned above, CO2was involved in two parallel reactions under the methanol synthesis conditions. Therefore,hot spots might be formed on the catalyst due to the high methanol synthesis rate. The higher methanol selectivity would give rise to the severe sintering of Cu species through particle migration and coalescence leading to a dramatic particle growth and significant decrease of Cu surface area, although the reaction temperature was far below the Tammann temperature of Cu species38. Moreover, as mentioned in our previous work19, the existence of large CuO particles could also accelerate particles growth through Ostwald ripening process, in which the growth of larger particles was at the expense of smaller particles. It was reasonable to propose that the similar catalytic stability of Nor-CZS and Co-CZS catalyst at the initial reaction period resulted from higher methanol synthesis rate and the existence of bulk CuO particles for Co-CZS catalyst. With time on stream, the Ostwald ripening was restrained by the vanishing Cu particles meanwhile particle migration and coalescence was also retarded by the decline of methanol yield and relatively stronger metalsupport interaction. Accordingly, the Co-CZS catalyst exhibited the similar deactivation rate with Nor-CZS catalyst at the initial stage and the higher catalytic stability at the medium-late reaction period.
3.3.3 Structural evolution of catalyst
As shown in Fig. 8D, the decline trend of CO2conversion was not exactly in line with the decrease process of methanol yield.Especially for the Re-CZS catalyst, in contrast to the maintenance of CO2conversion, the maintenance of the methanol yield was better. After 40 h, the CO2conversion rate decreased by 27.1% (normalized) while its reduction of methanol yield was only about 18.2% (normalized). Obviously,according to Fig. 8C, the enhancement of methanol selectivity over the Re-CZS catalyst during the reaction process was responsible for this phenomenon, while methanol selectivity for the other catalysts exhibited little variation. The Re-CZS catalyst was selected to investigate the cause for this phenomenon. The samples that were calcined, reduced, reacted for 8 h and 40 h,marked as Re-CZS-C, Re-CZS-0, Re-CZS-8 and Re-CZS-40,were characterized with XPS, H2-TPD, CO-TPD and CO2-TPD in detail.
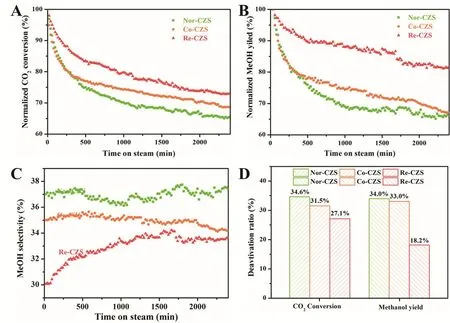
Fig. 8 Catalytic performance for all catalysts, (A) normalized CO2 conversion, (B) normalized methanol yield, (C) methanol selectivity,(D) deactivation ratio of CO2 conversion and methanol yield.
As revealed by the XPS results (Fig. S3 and Table S1), the reduction process led to a dramatic decline of Cu content and Cu/(Cu + Zn) ratio (Table S1) on the catalyst’s surface,meanwhile the Zn content on its surface increased slightly. This finding was in good accordance with the results reported by other groups: a part of Zn species migrated from catalyst’s bulk phase to Cu species’ surface owing to strong metal-support interaction32. As a result, partial Cu species on catalyst surface was overlapped by ZnO leading to sample structural restruction after activation process39.
On the other hand, the H2-TPD results are shown in Fig. S4C and Table S2, reminding that twice reduction process generated insignificant impact on H2adsorption property. Generally, the peak 1, locating at lower temperature, was assigned to desorption of hydrogen adsorbing on Cu surface40, while the broader signal(peak 2), ranging from 300 °C to 650 °C, corresponded to the desorption of strongly adsorbing hydrogen from the surface of ZnO sites deriving from Cu surface through hydrogen spillover41,42. At the initial reaction stage (500 min), the H2desorption originating from Cu surface sharply decreased suggesting the decline of approachable Cu sites on the catalyst surface. Meanwhile, the amounts of H2desorbing from ZnO sites dramatically enhanced which strongly indicated the increase of ZnO surface area due to the further migration of Zn species from mixed bulk phase as reaction proceeds16. Particularly, the decline of Zn/(Cu + Zn + Si) ratio on the catalyst surface (Table S1) manifested that the excessive Zn species would coalesce on the surface of catalyst forming larger ZnO particles. As reaction time prolonged, the H2-TPD results indicated that the desorbing H2from the ZnO surface significantly decreased with the slight enhancement of desorbing H2quantity from Cu sites (still lower than fresh reduced catalyst). This finding further confirmed that leaching and growth of Zn species coexisted on the catalyst although the former process might be limited with time on stream and the slight increase of desorbing H2quantity from Cu surface might be attributed to migration of Zn species on the surface. Moreover, the Cu/(Cu + Zn) ratio on catalyst’s surface showed limited variation while both of the Cu and Zn content on the surface of Re-CZS catalyst declined indicating particle growth for both of zinc and copper species. Herein, the structure evolution of catalyst was proposed and displayed in Scheme 1.
Obviously, during the sample activation process, restructure of catalyst occurred due to the strong metal-support interaction.At the initial reaction stage, the instability of the catalyst structure led to the growth of Cu particles and the dramatic decline of catalytic activity was accordingly observed. However,the Zn species migrating from bulk phase due to the strong metal-support interaction prevented this process to some extent16,43. With the reaction proceeding, the growth of Cu species was further suppressed and hence the deactivation of catalyst was retarded. Remarkably, leaching and coalescence of Zn species occurred throughout the whole reaction process,which exerted a crucial impact on the methanol synthesis process. From these reaction results (Fig. S2 and Fig. 8C), it was convincible to propose that the catalytic activity (CO2conversion) was principally determined by the exposing Cu species, while the methanol selectivity and productivity was significantly influenced by the leaching of Zn species.
It was widely acknowledged that there was an intimate synergy between Cu and Zn species, where ZnO acted as direct promoter for C―O bond activation and hydrogen reservoir. In consequence, similar variation trend between the CO2and H2chemisorption results was expected44. The CO2-TPD profiles were shown in Fig. S4A, with their details summarized in Table S2. As expected, similar to the H2-TPR result, the twice reduction process also generated the slight impact on CO2adsorption property and its variation trend further confirmed our hypothesis as proposed in Scheme 1.
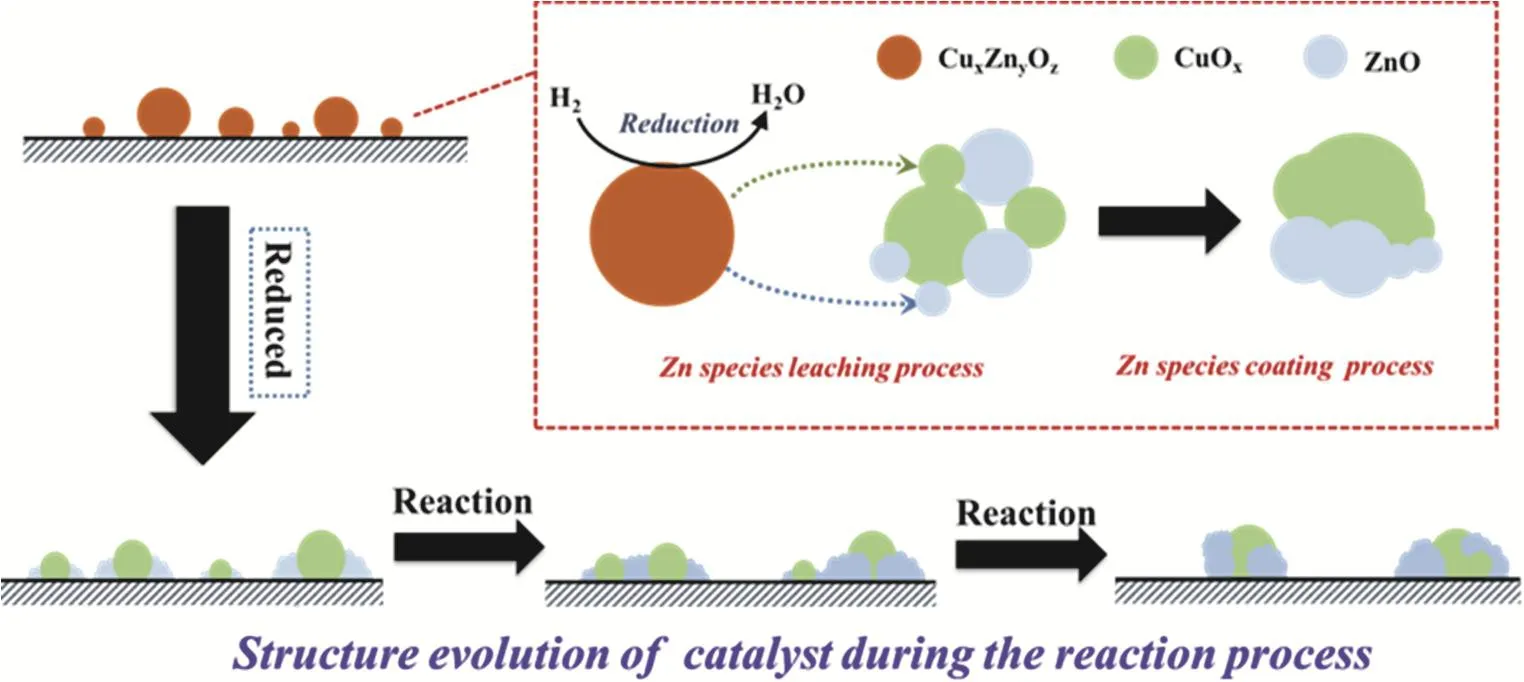
Scheme 1 Catalyst structure evolution process.
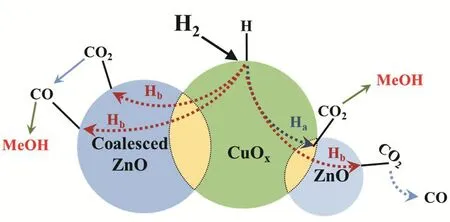
Scheme 2 The reaction mechanism of methanol synthesis process.
To further investigate the relationship between structure evolution of the catalyst and formation of methanol, CO2-TPD results (ranging from 230 °C to 700 °C) at various reaction times were deconvoluted into three Gaussian peaks, as shown in Fig.9, and the relative content and the number of each basic sites were listed in Table 5. Notably, because of relatively high reaction temperature (250 °C), the CO2desorption peak at the lower temperature (about 100 °C) was considered to have a limited contribution to the CO2activation and therefore it was convincible to consider that the catalytic performance corresponded to later peak. Generally, different desorption temperature of the three peaks indicated the existence of different CO2adsorbing species on the catalyst. In other words,it’s logical to deduce that there should be three different CO2adsorption sites existed on the catalyst surface.

Fig. 9 CO2-TPD results for Re-CZS catalyst with different reaction time.

Table 5 Relative contents of deconvoluted peaks from CO2-TPD.
The results illustrated that migration of ZnO could not only improve the adsorption capacity of H2but also alter the number and property of CO2adsorption sites which played a crucial role in the CO2hydrogenation. As reported45, the weakly and medially basic sites (peak 2) were corresponded to metal-oxygen pairs (such as isolated ZnO) with different adsorption manners in which the RWGS reaction mainly occurred, while the strongly basic sites (peak 3) were assigned to the low coordination oxygen atoms which greatly facilitated formation of methanol.The results indicated that the relative content and the number of weakly and medially basic site decreased with time on stream,while strongly basic sites displayed a contrary tendency indicating the transformation of basic sites during the reaction process. As a result, the improvement of methanol selectivity was obtained with time on stream. It was also noted that the enhancement of strongly basic sties owing to the migration of Zn species suggested that more Cu/ZnO interface could facilitate formation of low coordination oxygen atoms.
Eventually, CO-TPD has also been carried out to further clarify the impact of ZnO migration process. Different from the H2-TPD and CO2-TPD results, the CO-TPD results (Fig. S4B)clearly manifested that the capacity for the CO adsorption in the temperature range of 200 to 700 °C was significantly enhanced as the reaction progress. Therefore, it was plausible to propose that the adsorption sites for CO2and CO was definitely different and the CO conversion (deriving from RWGS) to methanol might be further facilitated owing to the improvement of CO adsorption capacity.
Conclusively, the migration of ZnO from the bulk catalyst owing to the strong-metal support interaction could not only improve the adsorption capacity of H2which could facilitate methanol synthesis process, but alter the property of CO2adsorption sites which was considered to greatly influence the CO2hydrogenation performance of catalyst46. However, the excessive Zn species would accelerate the formation of slightly lager ZnO particles resulting in a negative impact on CO2hydrogenation process and a positive impact on CO hydrogenation process. Therefore, it’s rational to infer that there should exist a balance between leaching and migration of Zn species, which was greatly affected by the metal-support interaction.
Based on the above investigation, a reaction mechanism was proposed (Scheme 2). Initially, the H2dissociates on the Cuδ+site and then spillovers to the Cu/ZnO interface and the ZnO surface through route Haand Hb, respectively. Then, the H* (generated by spillover from Cuδ+site) would react with the different adsorbed CO2. Subsequently, methanol and CO were produced on different active sites. Particularly, the majority of CO generated from RWGS reaction would desorb from catalyst surface while the others might furtherreact with the H* to form methanol.
4 Conclusions
In summary, three Cu/ZnO-SiO2catalysts with different metal-support interaction could be modulated through varying the precipitation sequence. The role of Cu-ZnO interaction on the catalytic activity of CO2hydrogenation to methanol was investigated by a combination of characterization and reaction.It is revealed that intimate interaction between the Cu and Zn species promotes the dispersion of Cu species, which was beneficial to the CO2activation. Stronger metal-support interaction (MSI) was conducive to improve the activity and stability of the catalyst. The migration of ZnO from bulk catalyst induced by the strong metal-support interaction (MSI) not only promoted the adsorption and activation of H2and CO2, thereby facilitating the activation efficiency of the reactants, but also changed the reaction pathway of the CO2hydrogenation to some extent. We believe that this work is helpful for understanding of the metal-support interaction in Cu-based catalysts, and also provide guidance for the rational and optimized design of efficient catalysts.
Supporting information: available free of charge via the internet at http://www.whxb.pku.edu.cn.

