
Search for the Metal-weak Thick Disk from the LAMOST DR5
2022-05-23 08:42:18TaiShengYanJianRongShiHaoTianWeiZhangandBoZhang
Tai-Sheng Yan ,Jian-Rong Shi ,Hao Tian ,Wei Zhang ,and Bo Zhang
1 Key Laboratory of Optical Astronomy,National Astronomical Observatories,Chinese Academy of Sciences,Beijing 100012,China;sjr@bao.ac.cn
2 School of Astronomy and Space Science,University of Chinese Academy of Sciences,Beijing 100049,China
3 Key Laboratory of Space Astronomy and Technology,National Astronomical Observatories,Chinese Academy of Sciences,Beijing 100101,China
tianhao@nao.cas.cn
4 Department of Astronomy,Beijing Normal University,Beijing 100875,China
Received 2021 September 19;revised 2021 November 17;accepted 2021 November 18;published 2022 February 2
Abstract Based on the data release of the Large Sky Area Multi-Object Fiber Spectroscopic Telescope survey(LAMOST DR5)and the Gaia Early Data Release 3(Gaia EDR3),we construct a sample containing 46,109 giant(log g≤3.5 dex)stars with heliocentric distance d≤4 kpc,and the sample is further divided into two groups of the inner(R GC<8.34 kpc)and outer region(R GC>8.34 kpc).The L Z distributions of our program stars in the panels with different[Fe/H]and[α/Fe]suggest that the thick-disk consists of two distinct components with different chemical compositions and kinematic properties.For the inner region,the metal-weak thick disk(MWTD)signi ficantly contributes when[α/Fe]>+0.2 dex and[Fe/H]<-0.8 dex,while the canonical thick-disk(TD)dominates when[Fe/H]>-0.8 dex.However,MWTD clearly appears only when[α/Fe]>+0.2 dex and[Fe/H]<-1.2 dex for the outer region,and its proportion is lower than that of the inner region within the same metallicity.Similar results can be obtained from the Vφdistribution.The higher fraction of MWTD in the inner region than that in the outer region implies that MWTD may form in the inner disk,and is observational evidence about the inside-out disk formation scenario.
Key words:stars:abundances–stars:atmospheres–Galaxy:structure–Galaxy:kinematics and dynamics–methods:data analysis
1.Introduction
It is well known that the Milky Way is composed of multiple components,such as the thin-disk,the thick-disk and the halo(Chiappini et al.1997;van der Kruit&Freeman 2011;An&Beers 2020),and it provides a unique chance for studying the formation and evolution of galaxies in detail by analyzing the full location,kinematics characteristic and chemical compositions of these stellar components.
As an important component of our Galaxy,the thick-disk has been studied by numerous works since its discovery(Gilmore&Reid 1983;Girard et al.2006;Di Matteo et al.2011;Ruchti et al.2011;Recio-Blanco et al.2014;Helmi et al.2018;Di Matteo et al.2019;Beraldo e Silva et al.2021;Franchini et al.2021).The thick-disk is primarily composed of older stars,resulting in different chemical composition from the young thin-disk stars.In the metallicity distribution,the thick-disk exhibits a peak aound[Fe/H]=-0.6 dex,and most of the thick-disk stars fall within the interval of[Fe/H]from-1.0 dex to-0.3 dex(Reddy&Lambert 2008).At the moment,there is no uniform conclusion on the upper and lower bounds of the metallicity distribution for the thick-disk stars(Reddy&Lambert 2008),and some disk-like kinematics stars with very low metallicity(down to[Fe/H]=-1.7 dex,or even lower)have been found(Norris et al.1985;Chiba&Beers 2000;Carollo et al.2010,2019).These metal-poor tail stars are commonly considered to belong to the metal-weak thick-disk(MWTD,Morrison et al.1990;Ivezi?et al.2008;Reddy&Lambert 2008;Carollo et al.2010;Ruchti et al.2011;Beers et al.2014;Carollo et al.2019;Carollo&Chiba 2021),while the remaining component after removing MWTD from the thick-disk is called as the canonical thick-disk(TD,Carollo et al.2010).
Due to lack of large-scale sample stars of high-precision parameters,the existence of MWTD remains controversial(Ruchti et al.2010).Norris et al.(1985)suggested that these stars with[Fe/H]≤-1.0 dex and e≤0.4 should belong to a population,and Morrison et al.(1990)referred to these stars of-1.6 dex<[Fe/H]<-1.0 dex with kinematical and spatial properties similar to the thick-disk ones as MWTD stars.It need to be pointed out that the metallicity derived by Norris et al.(1985)and Morrison et al.(1990)is based on the information from the David Dunlap Observatory(DDO)photometry,and Twarog&Anthony-Twarog(1994)found that the photometric metallicity used by Norris et al.(1985)has an~0.5 dex offset from the spectral ones for giants near[Fe/H]~-1.2 dex.In addition,by comparing the metallicity obtained from the high-resolution spectra with these from the DDO photometry for giants of Norris et al.(1985)and Morrison et al.(1990);Ryan&Lambert(1995)concluded that most stars with the DDO photometric metallicity of[Fe/H]<-1.0 dex have spectral metallicities of[Fe/H]>-1.0 dex.As a result,these stars identi fied as belonging to MWTD by Norris et al.(1985)and Morrison et al.(1990),therefore should belong to TD.Although the conclusions from Twarog&Anthony-Twarog(1994)and Ryan&Lambert(1995)cannot rule out the existence of MWTD,the evidence of MWTD suggested by Norris et al.(1985)and Morrison et al.(1990)becomes weaker.
Fortunately,the advent of large-scale surveys,such as the Large Sky Area Multi-Object Fiber Spectroscopic Telescope(LAMOST)survey(Cui et al.2012),the Sloan Digital Sky Survey (SDSS,York et al.2000),the Radial Velocity Experiment spectroscopic survey(RAVE,Steinmetz et al.2020a,2020b),and the Gaia mission(Gaia Collaboration et al.2021),make it possible to perform accurate chemodynamical studies on the stellar populations in our Galaxy(Carollo et al.2019).The spectra from LAMOST,SDSS and RAVE provide estimation of the stellar atmospheric parameters(effective temperature,surface gravity and metallicity)and radial velocities(RV),and the Gaia satellite delivers high-precision astrometric data(position,trigonometric parallax,and proper motions).The combination of parameters obtained from spectrum and astrometry is a powerful tool for studying the properties of stellar component related to the Milky Way by investigating the perspectives of stellar spatial distribution,chemical composition and kinematics.
In this paper,based on a sample combining spectral information from LAMOST and astrometric data from Gaia,we examine MWTD.The paper is organized as follows.In Section 2,we describe the selection of our sample stars.Section 3 presents the search for MWTD in the kinematic space,and the discussion and conclusions are given in Section 4.
2.Sample
2.1.Selection of the Sample Stars
The sample stars are selected from LAMOST DR5 with a range of the effective temperature from 4500 to 7000 K,and only the giants(logg≤3.5 dex)with signal-to-noise ratio(S/N)of their spectra higher than 50 have been considered.This removes all the dwarf stars.The stellar atmosphere parameters and[α/Fe]ratios are taken from the recommended values of Xiang et al.(2019)with internal uncertainties of[Fe/H]and[α/Fe]less than 0.07 and 0.05 dex,respectively,while the RVs are adopted from LAMOST DR5(Luo et al.2015),and only the objects with an RV uncertainty less than 10 km s-1have been selected.Moreover,to further ensure the accuracy of the metallicity,only the objects with a difference of metallicity between LAMOST DR5 and that of Xiang et al.(2019)less than 0.1 dex are selected.
The stellar proper motions(PMs)are obtained from Gaia EDR3(Gaia Collaboration et al.2021)with errors both in R.A.and in decl.direction less than 0.2 mas yr-1,while the geometric distances(rmed)from Bailer-Jones et al.(2021)have been adopted.Our sample stars are con fined to d≤4 kpc with an uncertainty of(rhi-rlo)/(2×rmed)smaller than 20%.Here,rloandrhiare the 16th and 84th percentiles of the posterior(see Bailer-Jones et al.2021,for details).
After these considerations included,the number of stars is reduced to 211,046,and the distribution of these stars in the[α/Fe]–[Fe/H]plane is shown in Figure 1.Obviously,most of them are belong to the thin-disk,and these thin-disk stars are not important for this study.Therefore,according to the criteria of Hayden et al.(2014)(see the black yellow polyline in Figure 1)we remove them from our sample.Finally,there are 46,109 stars in our sample.

Figure 1.Distribution of giant stars in the[α/Fe]–[Fe/H]plane.The black yellow polyline is the criteria for dividing the thin-and thick-disk stars from Hayden et al.(2014).
To avoid the systematic offset of LAMOST RVs(Anguiano et al.2018;Tian et al.2020),we compare the LAMOST RVs with those from Gaia EDR3 for the common stars,only stars with Gaia RV errors less than 1 km s-1have been selected.The offset of LAMOST RV is around-4.85 km s-1(Figure 2),which is very close to those of the previous works(~-5 km s-1,Anguiano et al.2018;Tian et al.2020).Therefore,a value of 4.85 km s-1is added to the LAMOST RV to compensate for the offset.
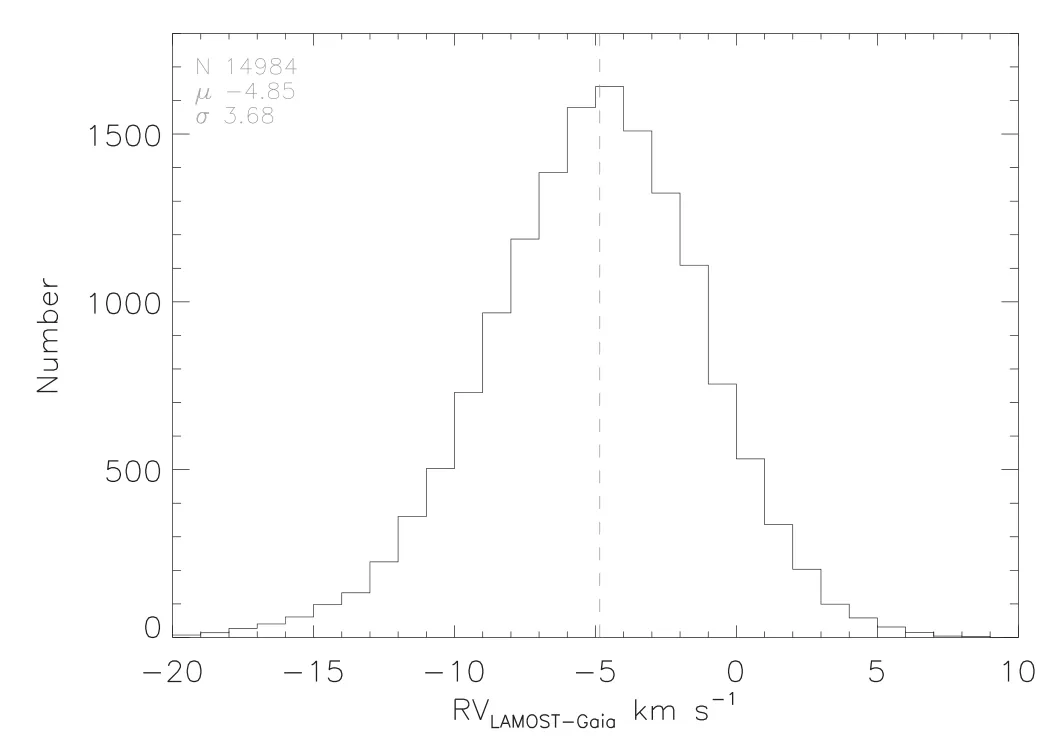
Figure 2.Comparison of the LAMOST RVs with those from Gaia EDR3,only stars with Gaia RV errors less than 1 km s-1 have been used.
2.2.Stellar Kinematic Parameters
The full phase-space information,positions(includingα,δand l,b),PMs and distances,combined with RVs,provide the parameters required to calculate the kinematics.Following Kordopatis et al.(2011),the Galactic-centerd Cartesian coordinates(XGC,YGC,ZGC)of stars are obtained through their distances and Galactic coordinates(l,b),andrepresentes the distance to the Galactic center in planar radial coordinate.In our calculation,the solar position of(X⊙,Y⊙,Z⊙)=(8.34 kpc,0,0)is adopted(Reid et al.2014).The galactocentric velocitiesVRandVφare also calculated,andVRandVφare de fined as positive with increasingRGCandφ,respectively.The Galactic rotation velocity of the local standard of rest(LSR)is adopted asVc=240 km s-1(Reid et al.2014),and the solar motion with respected to LSR of(U⊙,V⊙,W⊙)=(11.1,12.24,7.25)km s-1,is taken from Sch?nrich et al.(2010).TheZ-axis angular momentum is derived using the relationship ofLZ=RGC×Vφ.
3.Results
Although MWTD overlaps TD and the halo in parameter space,it is still possible to trace the footprint of MWTD with the help of their distribution in the metallicities,kinematics and dynamics(Carollo et al.2010;Kordopatis et al.2013;Carollo et al.2019;An&Beers 2020,2021;Carollo&Chiba 2021;Cordoni et al.2021).
It is noted that the fraction of metal-poor stars is lower(see Figure 8 of Miranda et al.2016),and Carollo et al.(2010)pointed out that the signi ficant contribution of MWTD is within-1.8 dex<[Fe/H]<-0.8 dex,and possibly up to~-0.7 dex.Therefore,we divide our sample stars into four metallicity intervals of[Fe/H]<-1.2 dex,-1.2 dex<[Fe/H]<-0.8 dex,-0.8 dex<[Fe/H]<-0.4 dex and[Fe/H]>-0.4 dex.Moreover,Carollo et al.(2019)suggested that the MWTD stars tend to have higher[α/Fe]ratios than those of TD,which means it will improve the search ef ficiency of MWTD when the sample is decomposed in[α/Fe]space.In Figure 3 we plot the[α/Fe]distribution of our sample stars of[Fe/H]<-0.8 dex,and the distribution can be well fitted with two Gaussian functions.According to their[α/Fe]distribution,the sample is further divided into high([α/Fe]>+0.2 dex)and low α ([α/Fe]<+0.2 dex)intervals.
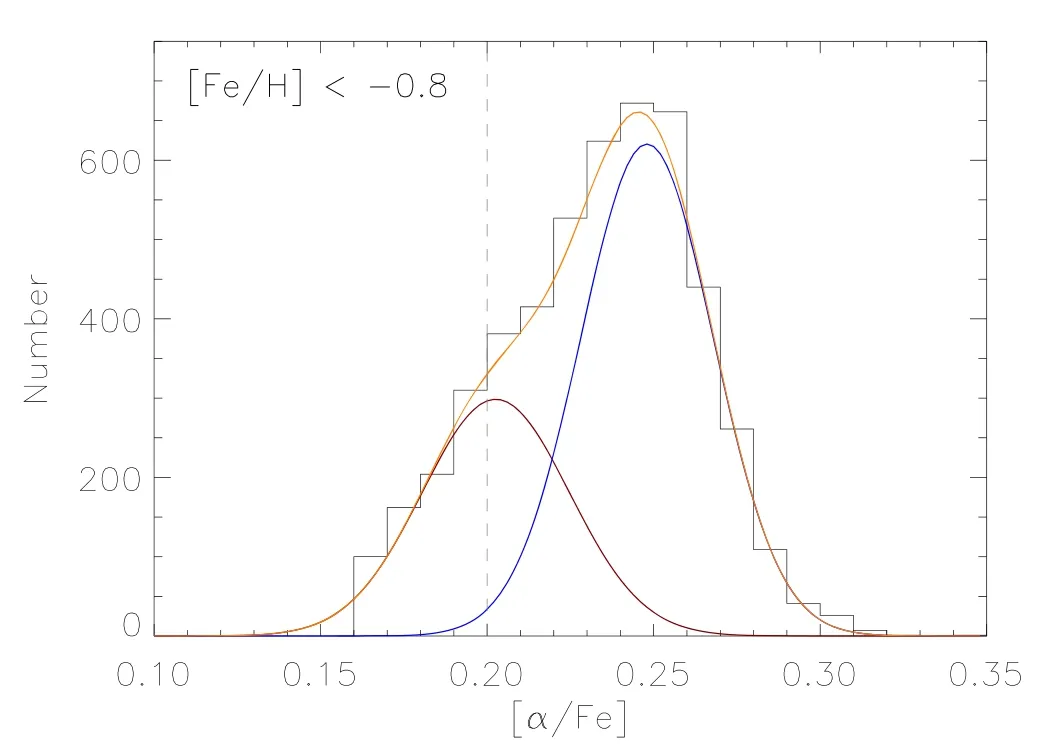
Figure 3.[α/Fe]distribution of the sample stars with[Fe/H]<-0.8 dex.The distribution can be well fitted with two Gaussian components.The vertical dotted line is labeled as[α/Fe]=+0.2 dex.
In order to compare the differences due to differentRGC(e.g.,An&Beers 2021),we present our discussions on our program stars with the inner(RGC<8.34,23,664 stars)and outer(RGC>8.34 kpc,22,445 stars)regions.
3.1.The L Z Distributions
Following Carollo et al.(2019),we focus on theLZdistribution.In Figure 4,we plot theLZdistribution for the inner region stars(RGC<8.34)in slices of[Fe/H]and[α/Fe].We apply multi-Gaussians to fit theLZdistribution in each panel,and the fitting parameters of each component including the fraction,LZand scatter(σLZ)are derived according to the Bayesian method,which can effectively avoid the contamination between different components(Tian et al.2019).To perform this fitting,we applyemcee(Foreman-Mackey et al.2013)to run a Markov Chain Monte Carlo(MCMC)simulation.We use 100 walkers for 2000 iterations with 1000 burn-in have been used.The median value for each parameter is adopted,and the difference between the median value and the 16%and 84%values are used as the upper and lower uncertainties,respectively.Figure 5 shows the MCMC result of panel(b)in Figure 4.
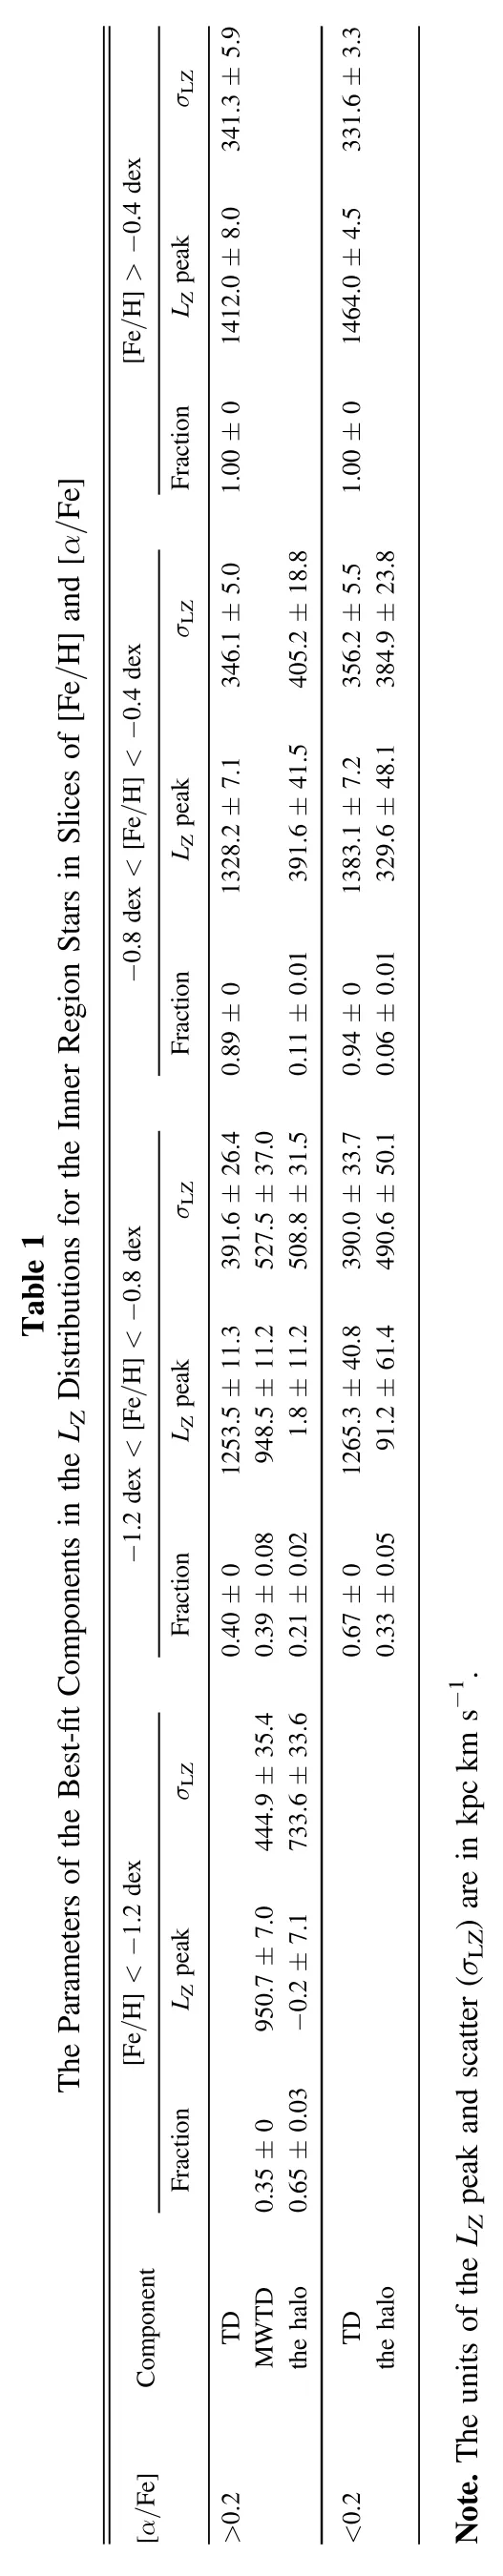
The best-fit parameters and uncertainties of the MCMC simulations for all the subsamples are listed in Table 1.When the fraction is not a free parameter during the MCMC simulation(one in each panel),its uncertainty is marked as 0(Table 1).The fitted distributions are represented with brown,red,green and blue lines for the halo,MWTD,TD and total,respectively,in Figure 4.
It can be seen from Figure 4 that the three lowα([α/Fe]<+0.20 dex)panels((f),(g)and(h))are dominated by the TD stars,and theirLZpeaks gradually decrease with decreasing metallicity.When[Fe/H]<-0.4 dex,the halo exists(panels(f)and(g)),and it accounts for about one third when-1.2 dex<[Fe/H]<-0.8 dex(panel(f)).
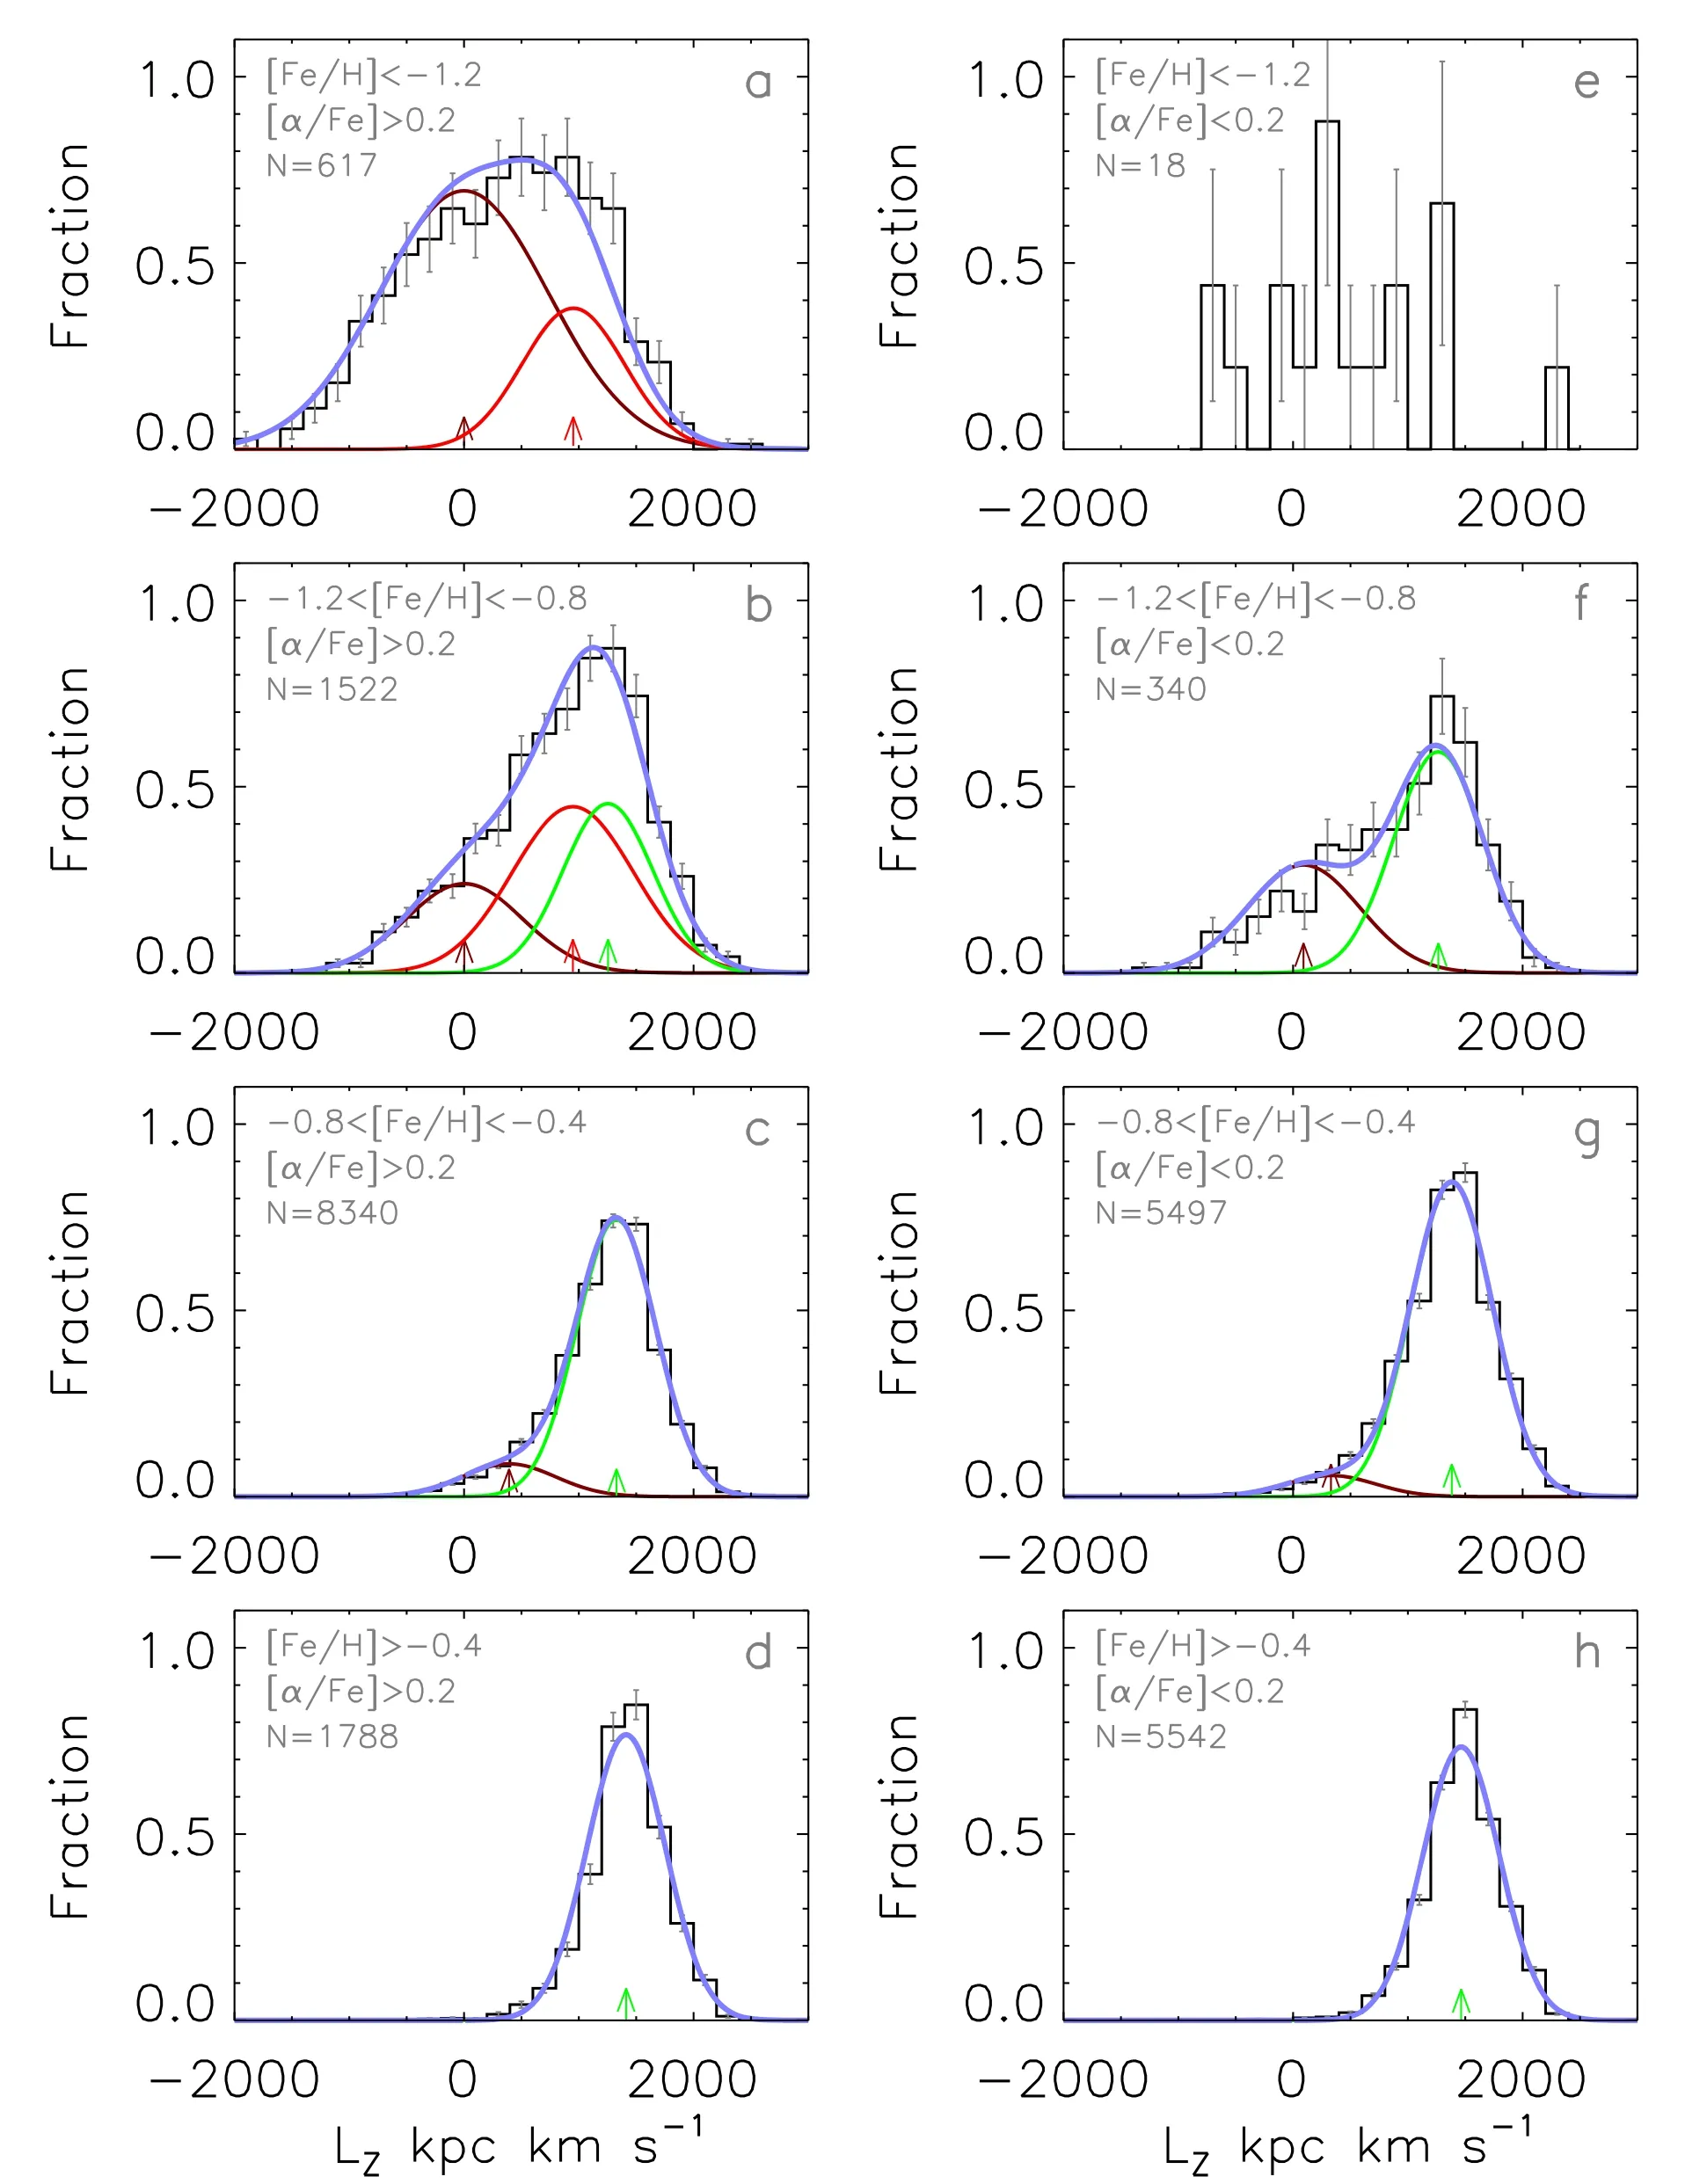
Figure 4.The L Z distributions of the inner region stars in slices of[Fe/H]and[α/Fe].The distribution can be best-fitted by one to three Gaussian(s),and each represents one component:the halo(brown),MWTD(red)and TD(green).The black histogram is the sum of all stars,while the light blue solid line represents the sum of the fit components.
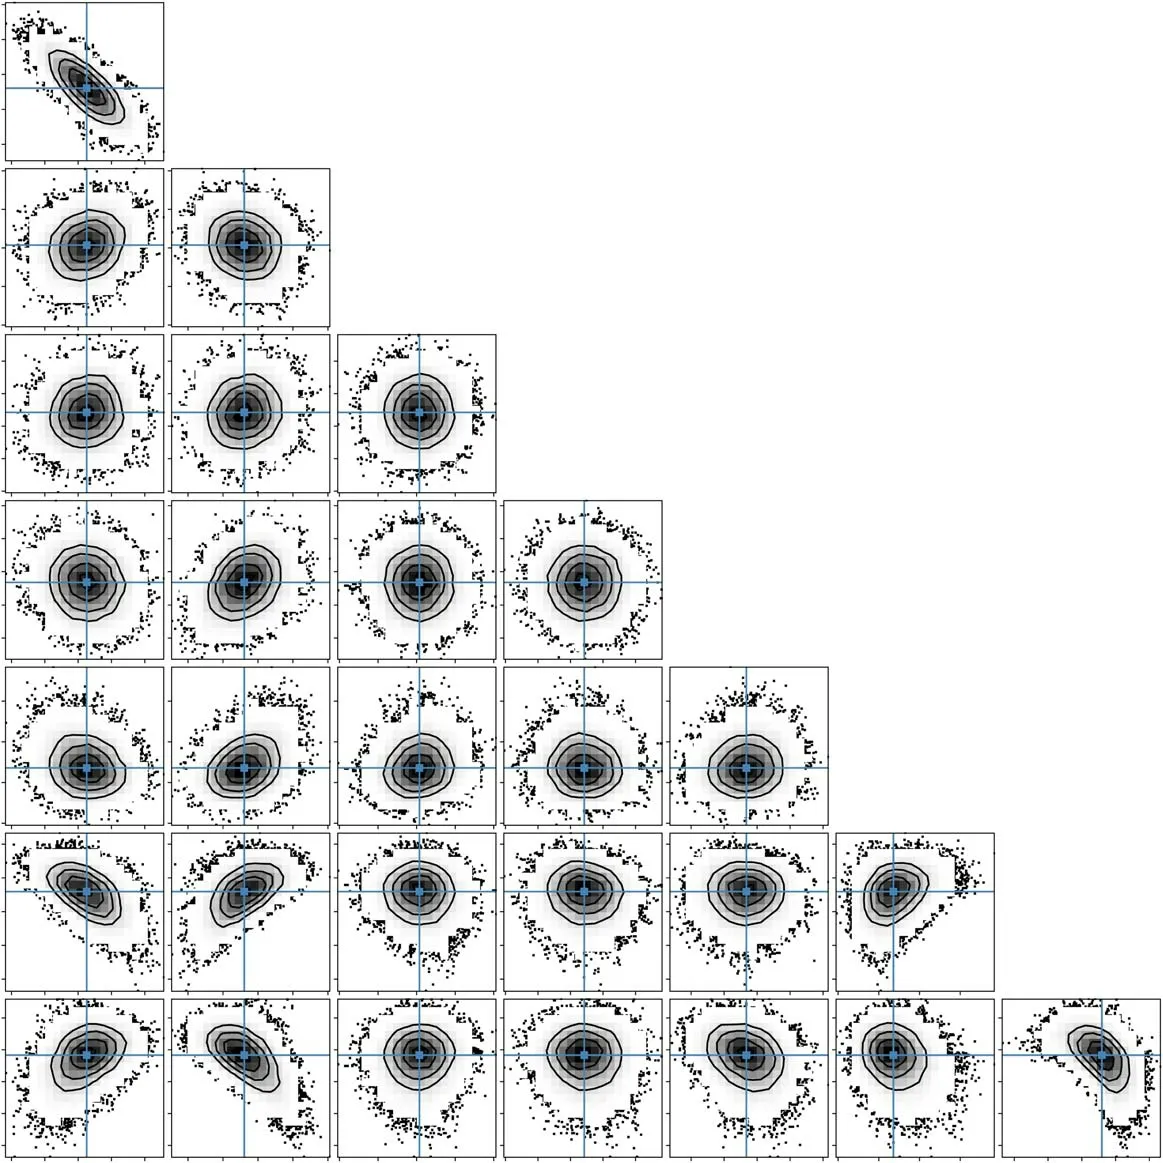
Figure 5.The MCMC simulation results of panel(b)of Figure 4.The adopted median values of the parameters are represented by the solid blue lines.
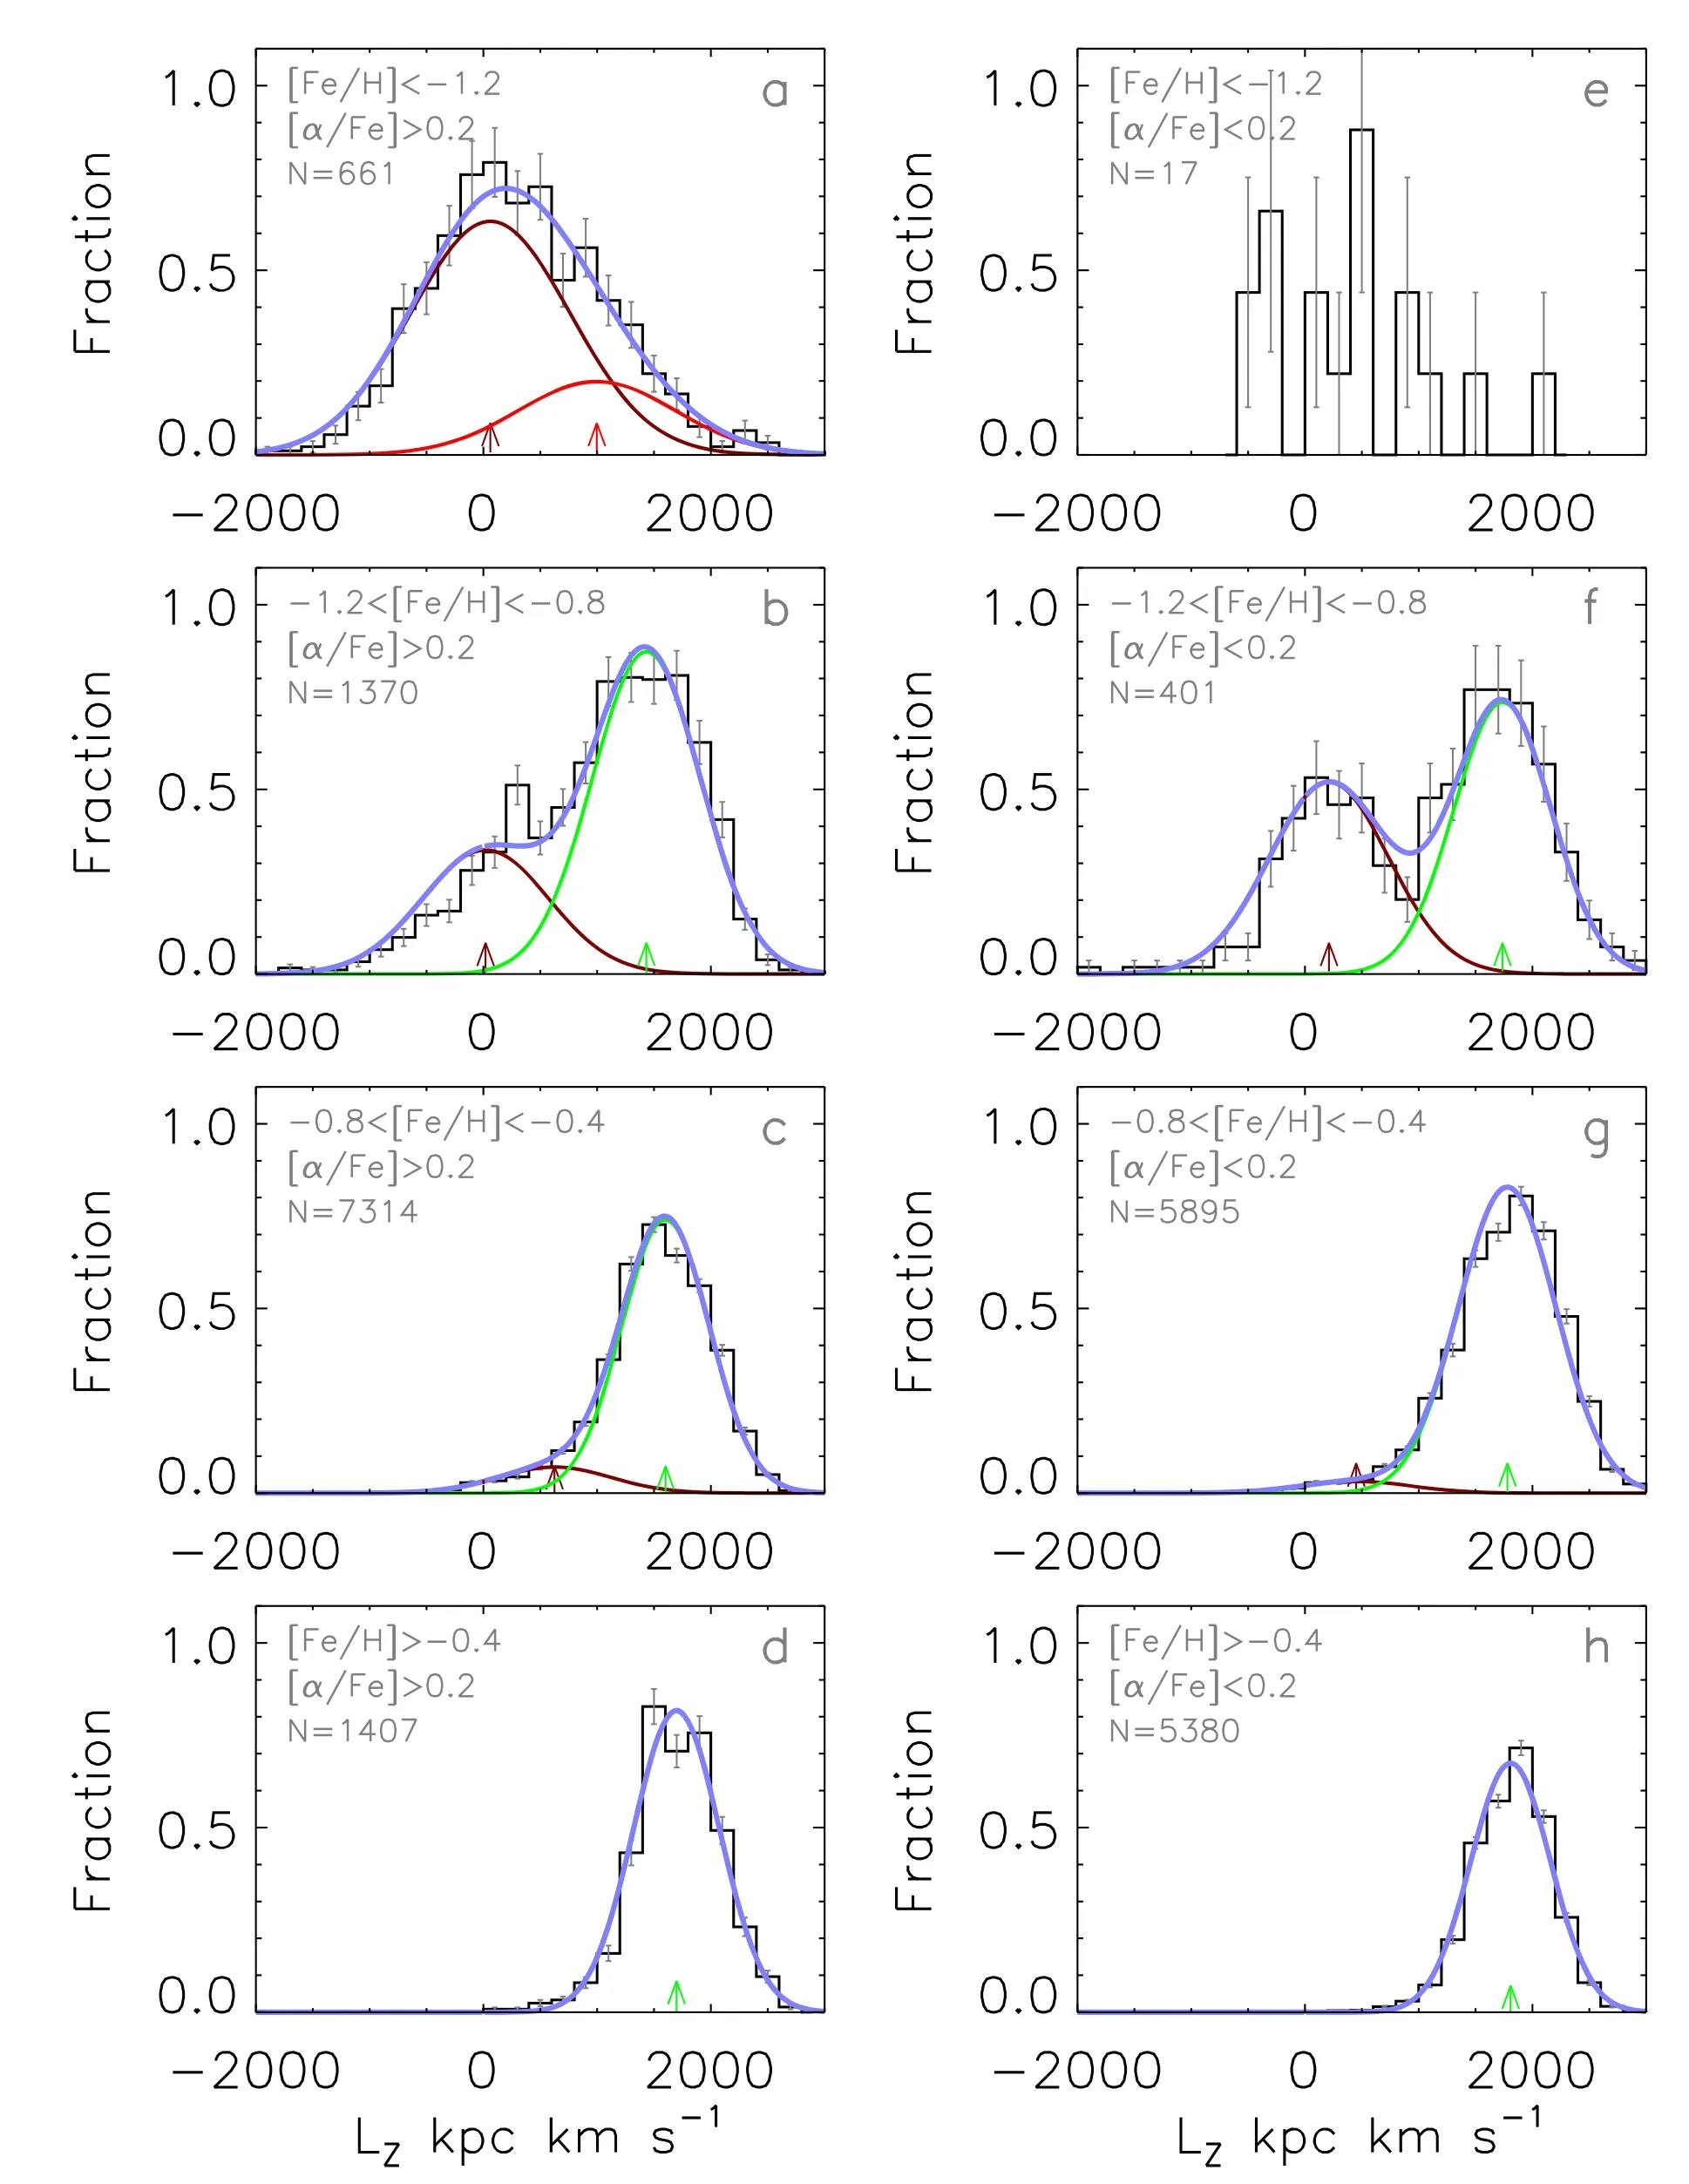
Figure 6.Similar to Figure 4 but for the L Z distribution of outer region stars.
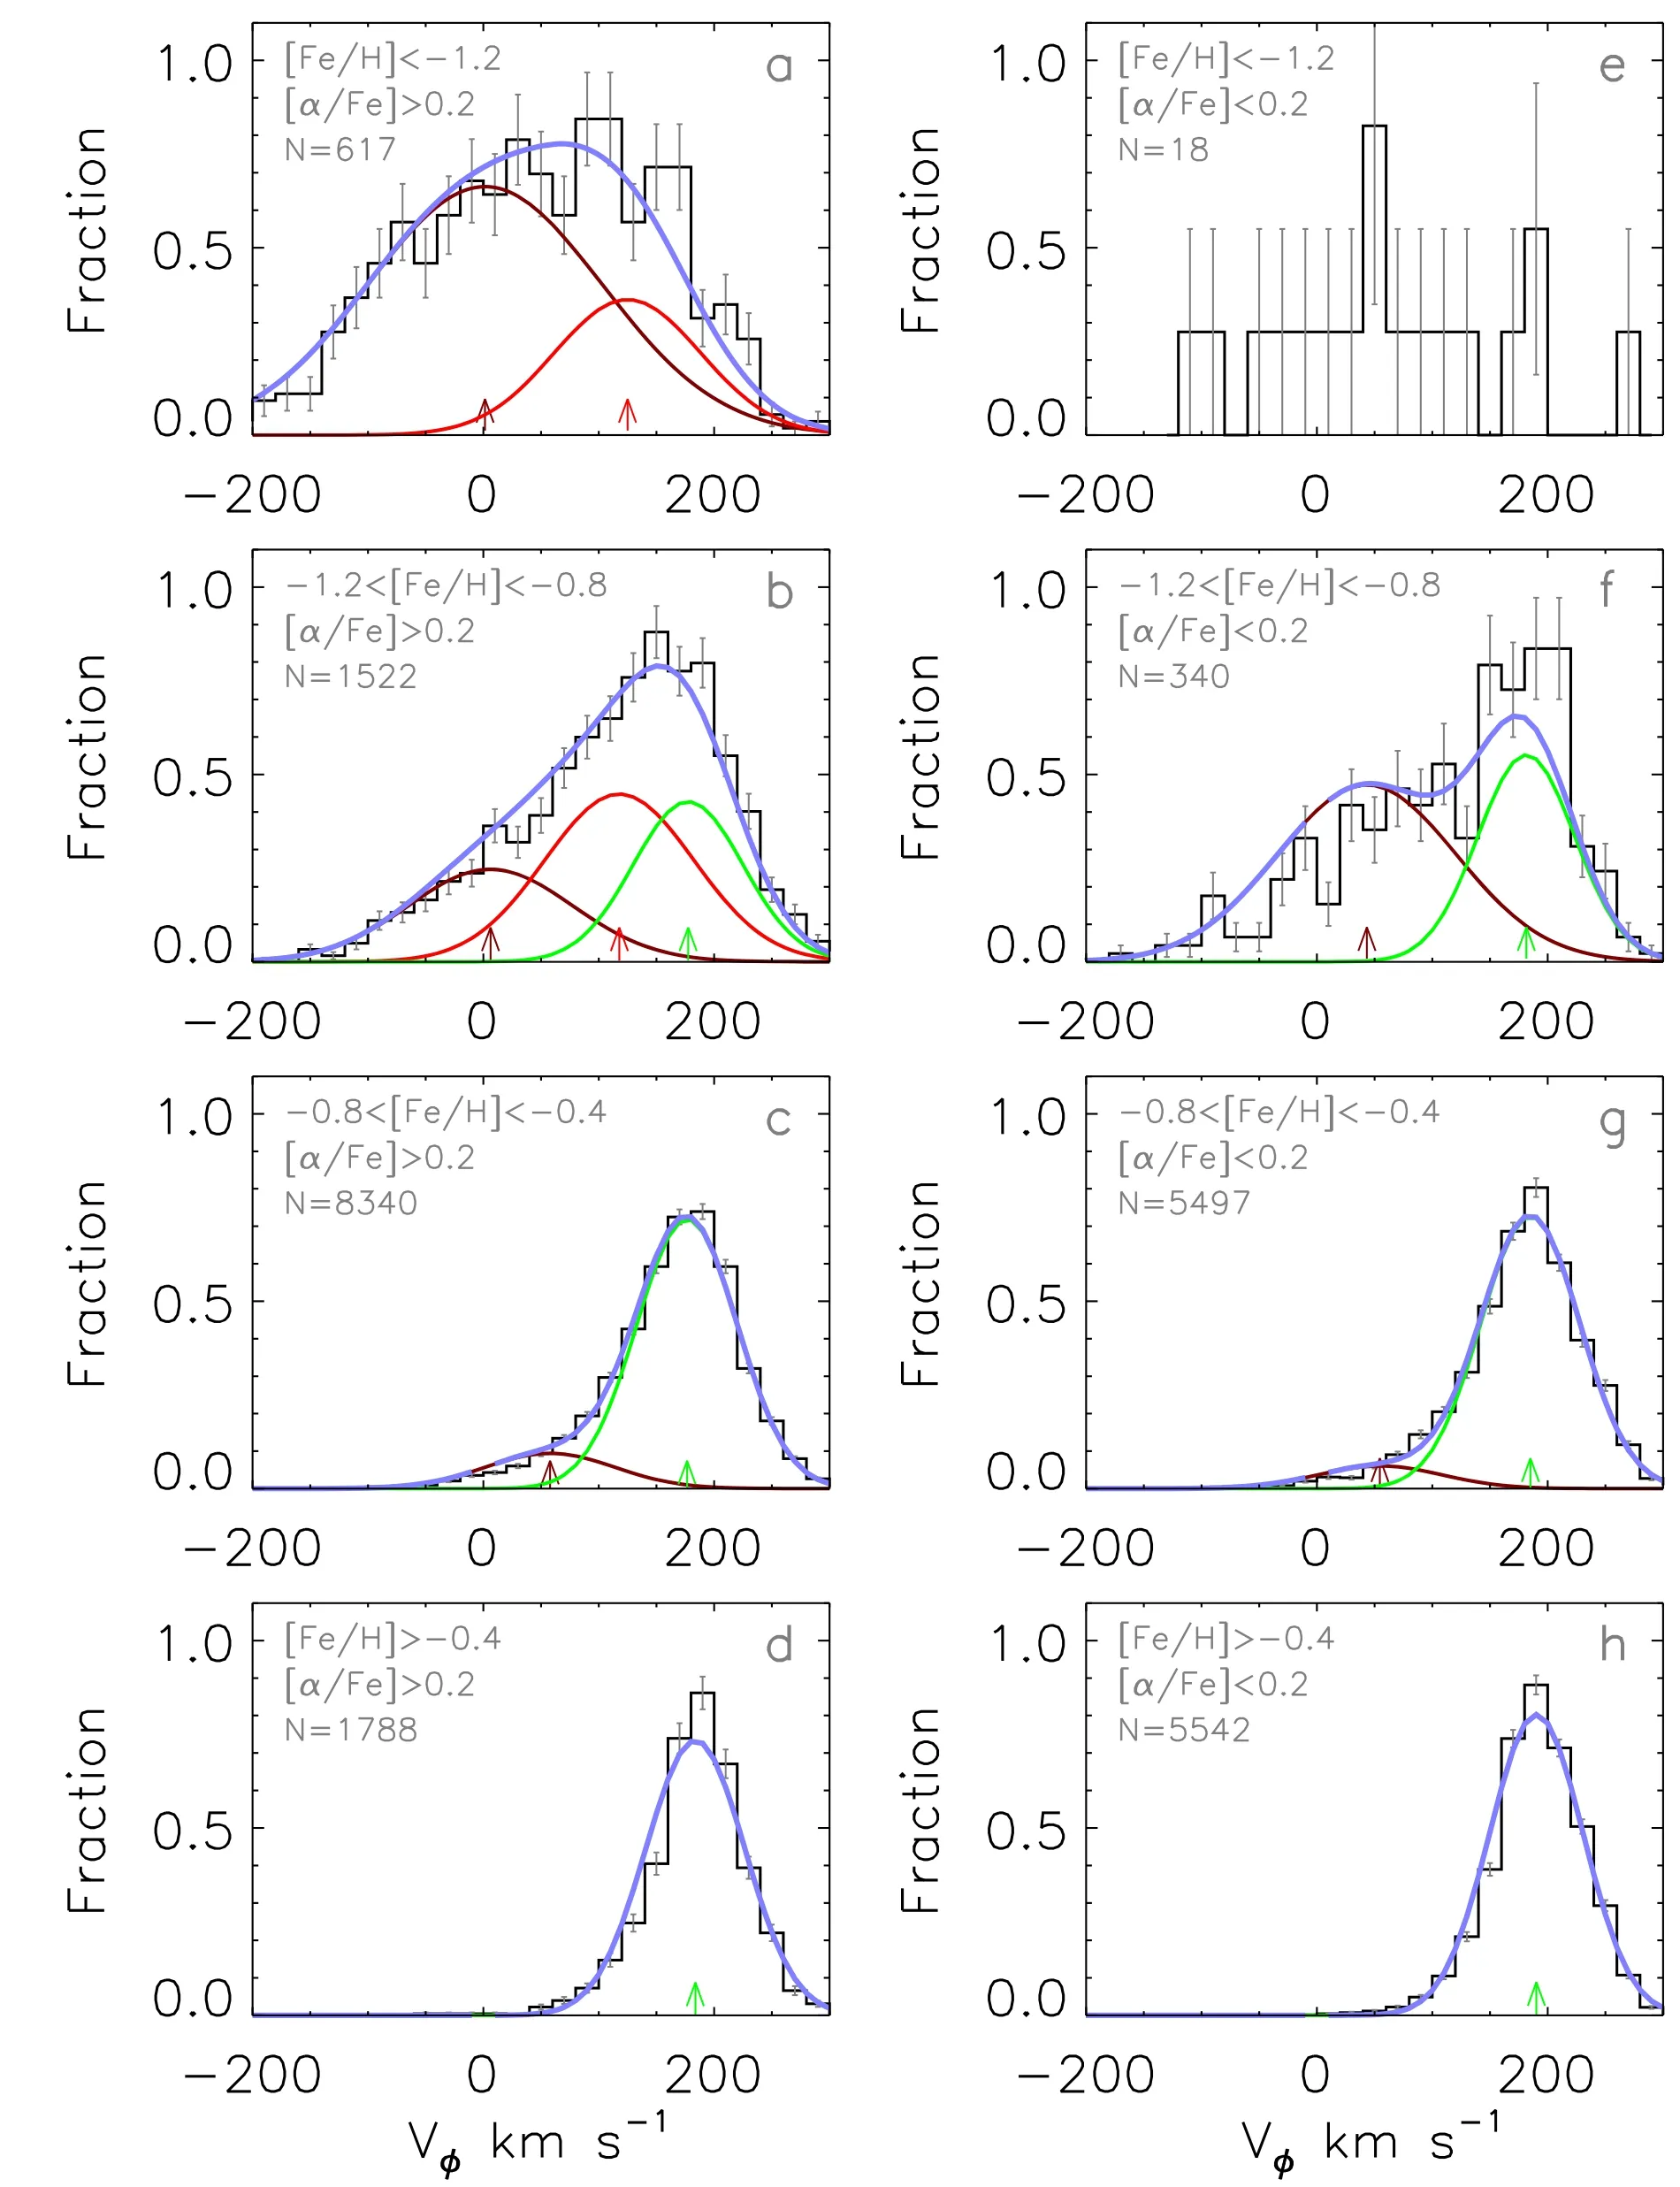
Figure 7.Similar to Figure 4 but for the Vφdistribution.
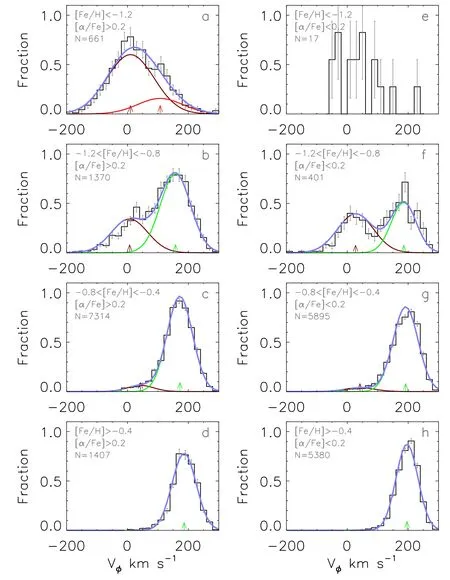
Figure 8.Similar to Figure 7 but for the outer stars(R GC>8.34 kpc).
For the four highαpanels,theLZdistributions vary regularly with the metallicity.The TD stars dominate both in panels(c)and(d),and theLZdistribution of these two panels are very similar to those of panels(g)and(h).The typicalLZpeak value is around 1350 kpc km s-1.
We note that there are three components in panel(b),and one of them has aLZpeak of 948.5±11.2 kpc km s-1with a scatter of 527.5±37.0 kpc km s-1,this value is lower than that of TD(1253.5±11.3 kpc km s-1),while it is higher than that of the halo(1.8±11.2 kpc km s-1).This indicates that this component is dynamically different from those of the halo and TD,and it is most likely to be MWTD(Carollo et al.2010;An&Beers 2020;Naidu et al.2020).The difference of theLZpeak between MWTD and TD is around 300 kpc km s-1,which is larger than that of the fitting error.Our results present that the fraction of MWTD in this panel is around 0.39,while the fractions of the halo and TD are ~0.21 and ~0.40,respectively.
?
?
?
?
For the more metal-poor panel(a),although there are only two components,we notice that there is a component with aLZpeak of 950.7±7.0 kpc km s-1with a scatter of 444.9±35.4 kpc km s-1.ThisLZpeak value is very close to that of MWTD in panel(b),which indicates this component is also MWTD.The contribution of MWTD in this panel is about one third(0.35).The remaining contribution in the panel accounts for about two-thirds,and they come from the halo of anLZpeak of-0.2±7.1 kpc km s-1with a sctter of 733.6±33.6 kpc km s-1.
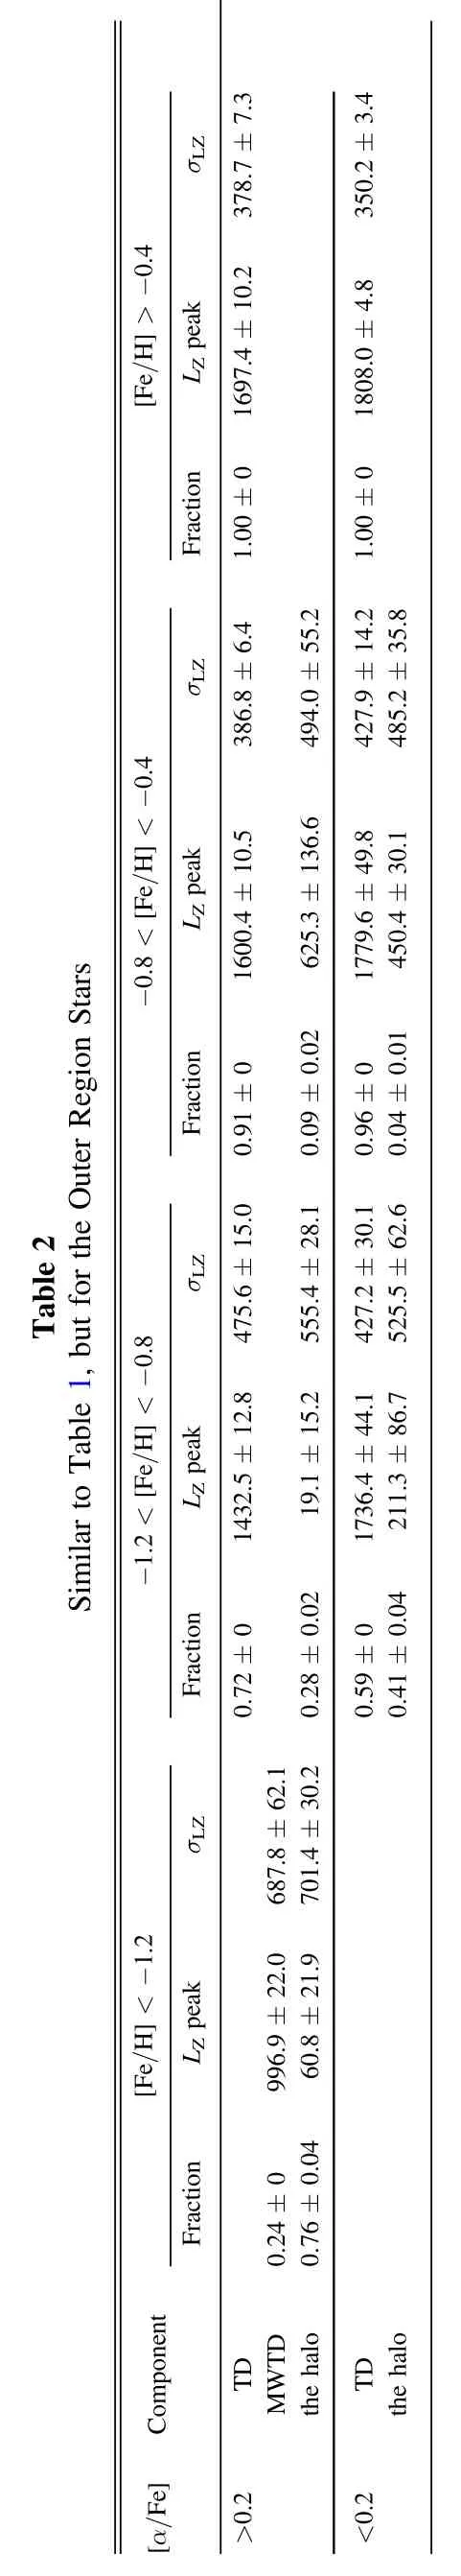
Figure 6 presents theLZdistributions of the outer region stars(RGC>8.34 kpc,black histogram)in slices of[Fe/H]and[α/Fe].Similar to the inner region,we applyemceeto perform an MCMC simulation to determine the components contained of each panel for the outer region stars.The best-fit components obtained through the simulation are superimposed on the histogram of Figure 6 with color curves,and the best-fit parameters are listed in Table 2.
MWTD has obvious contribution only in panel(a)of Figure 6.The fraction of MWTD in this panel is 0.24,which is lower than that in the same panel of the inner region.TheLZpeak of MWTD in this panel is 996.9±22.0 kpc km s-1with a scatter of 687.8±62.1 kpc km s-1,and we note that this scatter is larger than that of the inner ones(~500 kpc km s-1).The reason is most likely due to the fraction of MWTD in the outer region is lower than that in the inner one.
3.2.The VφDistributions
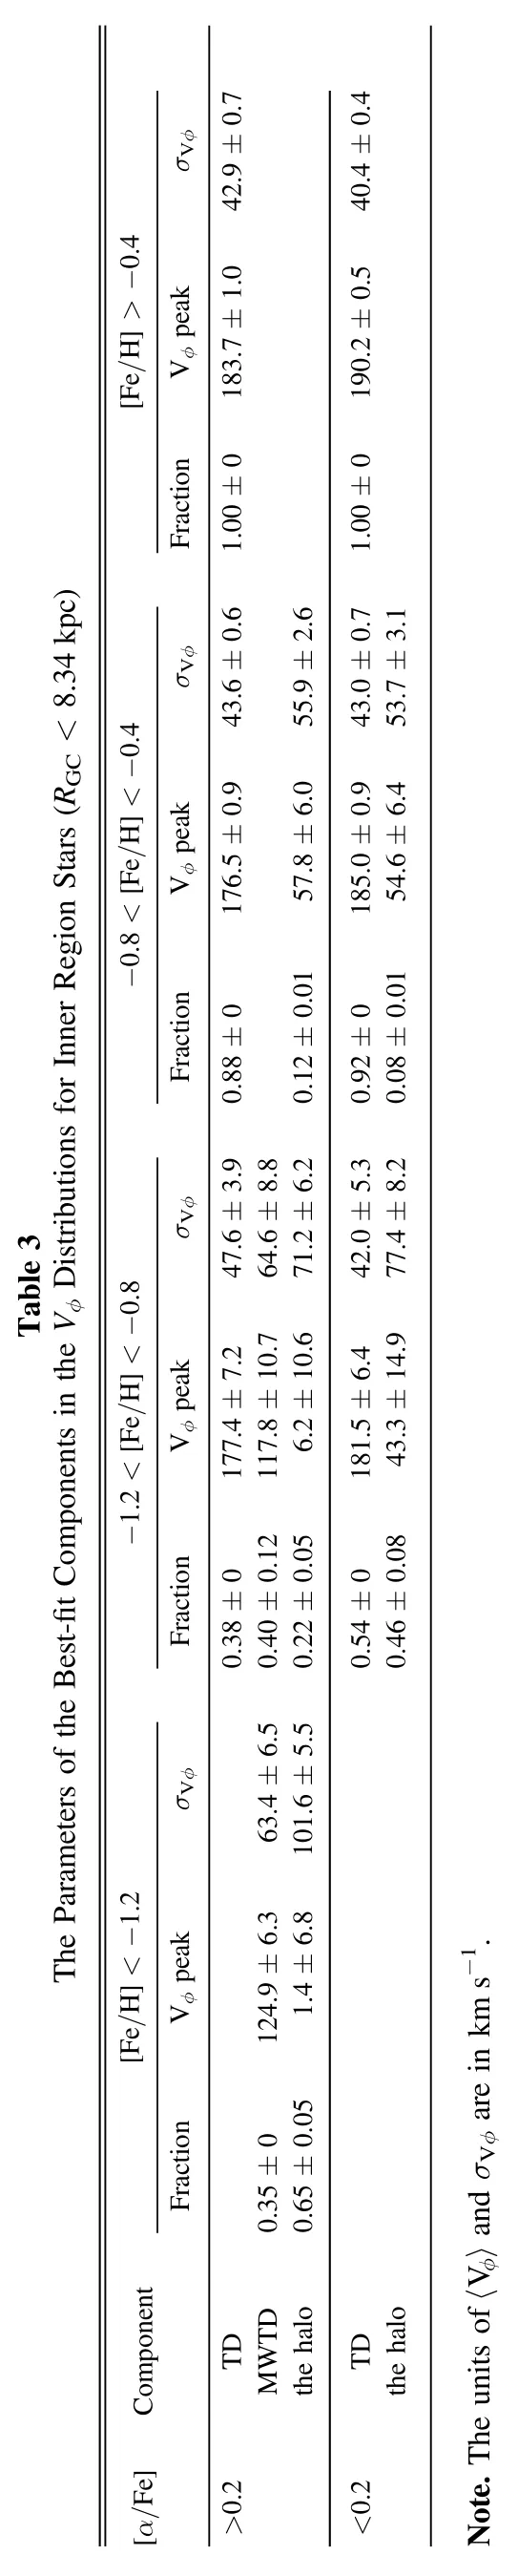
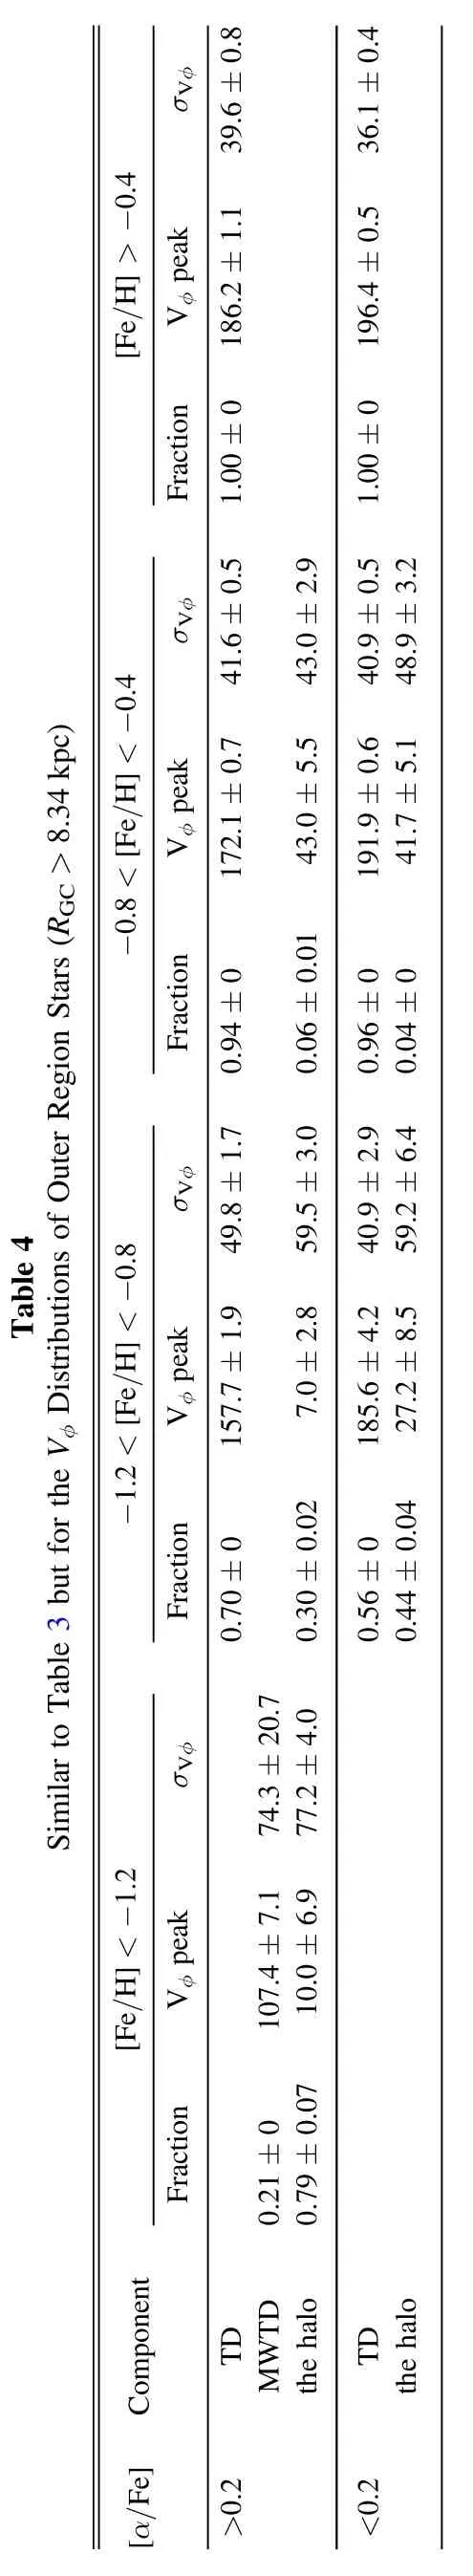
It is noted by An&Beers(2021),Carollo et al.(2010)and Kordopatis et al.(2013)that MWTD has kinematic properties different from those of the halo and TD,thus,we display theVφdistribution of the inner and outer region stars in Figures 7 and 8 in slices of[Fe/H]and[α/Fe],respectively.The best-fit result obtained with the MCMC simulation are superimposed on the histogram with color curves,and the best-fit parameters are listed in Tables 3 and 4.
In each panel of the two figures(Figures 7 and 8),the components determined from theVφdistribution are very similar to those from theLZones.TheVφpeak of MWTD in panels(a)and(b)of the inner region are 124.9±6.3 km s-1and 117.8±10.7 km s-1,respectively,while it is 107.4±7.1 km s-1in panel(a)of the outer region,which are consistent with those of Carollo et al.(2010)and Kordopatis et al.(2013),however,they are around 15 km s-1lower than those of An&Beers(2021).We note that the matallicites for the sapmle stars of An&Beers(2021)were estimated from the photometric data,while theVφof their individual stars were computed using photometric distances and proper-motion measurements from Gaia EDR3,and their sample restricts to stars within±30°from the Galactic prime meridian.Therefore,the difference inVφmay be due to the different in sample stars.
4.Discussion and Conclusions
Based on the combined data set of LAMOST DR5 and Gaia EDR3,we investigate the kinematic properties of the giant stars in the solar neighborhood.Our results show that MWTD occupies a signi ficant fraction with metallicity lower than-0.8 and[α/Fe]>+0.2 dex.It is found that the fraction of MWTD is signi ficantly higher within the solar orbit radius,while theZaxis angular momentum is similar to both subsamples divided by the solar orbit radius,950 and 1000 kpc km s-1for the inner and outer region,respectively.The high fraction of MWTD in the inner solar orbit radius and higherαelement abundances may suggest that the MWTD stars were born in the inner region of the primordial disk,and some of them migrated to larger radii,or MWTD is the result of inside out scenario.However,the number of the MWTD stars is relatively small compared to the TD and halo ones,thus,it is hard to make an ascertained estimation of the origin of MWTD under the current situations.To figure out the origin of MWTD,additional constraints from both observations(such as the abundances of C,N,O,Mg,Si,Ca and Ti,etc)and numerical simulations are necessary.
Acknowledgments
Our research is supported by National Key R&D Program of China No.2019YFA0405500,the National Natural Science Foundation of China under Grant Nos.12090040,12090044,11833006,12022304,11973052,11973042 and U1931102.H.T.is supported by Beijing Natural Science Foundation with Grant No.1214028,and partly supported by National Natural Science Foundation of China with grant No.U2031143.This work is supported by the Astronomical Big Data Joint Research Center,co-founded by the National Astronomical Observatories,Chinese Academy of Sciences and Alibaba Cloud.This work is also partially supported by the Open Project Program of the Key Laboratory of Optical Astronomy,National Astronomical Observatories,Chinese Academy of Sciences.Guo Shou Jing Telescope(the Large Sky Area Multi-Object Fiber Spectroscopic Telescope LAMOST)is a National Major Scienti fic Project built by the Chinese Academy of Sciences.Funding for the project has been provided by the National Development and Reform Commission.LAMOST is operated and managed by the National Astronomical Observatories,Chinese Academy of Sciences.This work has made use of data from the European Space Agency(ESA)mission Gaia(https://www.cosmos.esa.int/gaia),processed by the Gaia Data Processing and Analysis Consortium (DPAC,https://www.cosmos.esa.int/web/gaia/dpac/consortium).Funding for the DPAC has been provided by national institutions,in particular the institutions participating in the Gaia Multilateral Agreement.
ORCID iDs
Tai-Sheng Yan, https://orcid.org/0000-0003-2318-9013
Jian-Rong Shi, https://orcid.org/0000-0002-0349-7839
Hao Tian https://orcid.org/0000-0003-3347-7596
Wei Zhang https://orcid.org/0000-0002-1783-957X
Bo Zhang https://orcid.org/0000-0002-6434-7201
 Research in Astronomy and Astrophysics2022年2期
- Research in Astronomy and Astrophysics的其它文章
- Calibrating Photometric Redshift Measurements with the Multi-channel Imager(MCI)of the China Space Station Telescope(CSST)
- The“Bi-drifting”Subpulses of PSR J0815+0939 Observed with the Fivehundred-meter Aperture Spherical Radio Telescope
- Application of Random Forest Regressions on Stellar Parameters of A-type Stars and Feature Extraction*
- Detection of Gamma-Rays from the Protostellar Jet in the HH 80–81 System
- Radio Frequency Interference Mitigation and Statistics in the Spectral Observations of FAST
- Systematic Errors Induced by the Elliptical Power-law model in Galaxy–Galaxy Strong Lens Modeling