
Calibrating Photometric Redshift Measurements with the Multi-channel Imager(MCI)of the China Space Station Telescope(CSST)
2022-05-23 08:45:48YeCaoYanGongZhenYaZhengandChunXu
Ye Cao,Yan Gong,Zhen-Ya Zheng,and Chun Xu
1 Key Laboratory of Space Astronomy and Technology,National Astronomical Observatories,Chinese Academy of Sciences,Beijing 100101,China
gongyan@bao.ac.cn
2 School of Astronomy and Space Sciences,University of Chinese Academy of Sciences,Beijing 100049,China
3 Science Center for China Space Station Telescope,National Astronomical Observatories,Chinese Academy of Sciences,Beijing 100101,China
4 CAS Key Laboratory for Research in Galaxies and Cosmology,Shanghai Astronomical Observatory,Shanghai 200030,China
5 Division of Optical Astronomical Technologies,Shanghai Astronomical Observatory,Shanghai 200030,China
6 Joint Center of SHAO and SITP for Infrared Astronomical Instrumentation,Shanghai Astronomical Observatory,Shanghai 200030,China
Received 2021 October 13;revised 2021 December 7;accepted 2021 December 10;published 2022 February 2
Abstract The China Space Station Telescope(CSST)photometric survey aims to perform a high spatial resolution(~0 15)photometric imaging for the targets that cover a large sky area(~17,500 deg2)and wide wavelength range(from NUV to NIR).It expects to explore the properties of dark matter,dark energy,and other important cosmological and astronomical areas.In this work,we evaluate whether the filter design of the Multi-channel Imager(MCI),one of the five instruments of the CSST,can provide accurate photometric redshift(photo z)measurements with its nine medium-band filters to meet the relevant scienti fic objectives.We generate the mock data based on the COSMOS photometric redshift catalog with astrophysical and instrumental effects.The application of upper limit information of low signal-to-noise ratio data is adopted in the estimation of photo z.We investigate the dependency of photo z accuracy on the filter parameters,such as band position and width.We find that the current MCI filter design can achieve good photo z measurements with accuracyσz?0.017 and outlier fraction f c?2.2%.It can effectively improve the photo z measurements of the main CSST survey using the Survey Camera to an accuracyσz?0.015 and outlier fraction f c?1.5%.This indicates that the original MCI filters are proper for the photo z calibration.
Key words:cosmology:observations–(cosmology:)large-scale structure of universe–galaxies:distances and redshifts
1.Introduction
Photometric wide-field surveys can detect billions of target sources,and obtain the positions of these sources on the celestial sphere and the fluxes in multiple bands.They play a major role in modern astronomy research.A few current and upcoming large ground-and space-borne telescopes,e.g.,the Dark Energy Survey(The Dark Energy Survey Collaboration 2005),Sloan Digital Sky Survey(Fukugita et al.1996;York et al.2000),Large Synoptic Survey Telescope(LSST Science Collaboration et al.2009;Ivezi?et al.2019),Euclid space telescope(Laureijs et al.2011)and Hyper Suprime-Cam(Aihara et al.2018)have set photometric sky survey requirements with large areas and deep fields to ensure that their scienti fic objectives can be achieved.The information provided by these surveys can solve many important cosmological and astronomical questions,such as the properties of dark energy and dark matter,the formation and evolution of galaxies,the origin of the universe,etc.
Redshift provides distance information for targets on the traditional two-dimensional sky map.The high precision measurements of galaxy redshift are traditionally determined by the spectroscopic method.However,the spectroscopic redshift measurement is time-consuming and it is dif ficult to achieve the redshift calibration of all sources in large sky surveys.On the other hand,the photometric redshift(photoz)measurement as an ef ficient method plays an increasingly important role in large sky surveys.Photo-ztechnology has been developed and improved in recent decades(Salvato et al.2019),and it has been suf ficiently useful for most recent cosmological and astronomical researches,e.g.,weak gravitational lensing,cosmic large scale structure,etc.
The China Space Station Telescope(CSST)is a 2 m space telescope operating in the same orbit of the China Manned Space Station.As a major science project of the Space Application System of the China Manned Space Program,CSST is scheduled to be launched around 2024.It is designed to be a large field of view(~1.1 deg2),high spatial resolution(~0 15 and 0 18 at 633 nm for Survey Camera(SC)and Multi-Channel Imager(MCI),respectively)and multi-band(from NUV to NIR)telescope that will simultaneously perform both photometric and slitless grating photometric surveys covering a large sky area of 17,500 deg2with its SC in about a decade(Zhan 2011;Cao et al.2018;Gong et al.2019).CSST will explore a number of cosmological and astronomical objectives,such as dark mater and dark energy,the cosmic large scale structure,galaxy clusters,galaxy formation and evolution,active galactic nuclei,etc.
In this work,we explore the measurements of photoz,whose accuracy is the basis of many important scienti fic objectives,especially for the weak gravitational lensing survey.According to previous studies,the sample used in weak gravitational lensing must have an accuracyσ<0.05 in next generation surveys(e.g.,LSST Science Collaboration et al.2009),and we expects to improve its photozaccuracy to achieveσ?0.02(Zhan 2006).Here,we investigate the photozaccuracy and its dependence on the filter design parameters of the CSST-MCI.The MCI has three channels covering the same wavelength range as the SC from the NUV to NIR bands,and these channels can work simultaneously(Z.Y.Zheng et al.2021,in preparation).Three sets of filters,i.e.,narrow-,medium-,and wide-band filters,will be installed on the MCI to perform extreme-deep f ield surveys with a f ield of viewThe magnitude limit can be stacked to a depth of 29–30 AB mag in three channels.It will study the formation and evolution of high-zgalaxies,properties of dark matter and dark energy,and also can be used to calibrate the photozmeasurements with its nine medium-band filters for the CSST-SC surveys.
There are mainly two methods for estimating photoz,i.e.,“training method”and“template fitting method”(Connolly et al.1995;Lanzetta et al.1996;Brunner et al.1997;Fernández-Soto et al.1999;Abdalla et al.2011;Sánchez et al.2014),which have different advantages.The“training method”usually requires detecting the spectroscopic redshifts as training samples,e.g.,the neutral network software ANNz(Firth et al.2003;Collister&Lahav 2004).Although this method has high accuracy,currently it can only estimate the photozof the bright sources at low redshifts due to the limitation of spectral data as a training sample.On the other hand,the“template fitting method”extracts the photozby fitting photometric data with the spectral energy distribution(SED)templates,and the estimated range of redshift is not restricted.Publicly available codes of this type include Hyperz(Bolzonella et al.2000),BPZ (Benítez 2000),LePhare(Arnouts et al.1999;Ilbert et al.2006),CIGALE(Boquien et al.2019;Yang et al.2021),etc.Following Cao et al.(2018),we use a modi fied LePhare software considering the flux upper-limit information to explore the photozmeasurements.The machine learning method can also be used in the study as shown in Zhou et al.(2021).
In order to simulate photometric observation as realistic as possible,we generate the mock data based on the COSMOS photometric redshift catalogs(henceforth referred as COSMOS08 and COSMOS15 catalogs)(Capak et al.2007;Ilbert et al.2009;Laigle et al.2016).These two catalogs have a similar magnitude limit as the CSST,and hence similar galaxy redshift and magnitude distributions(Cao et al.2018;Gong et al.2019;Zhou et al.2021).After considering the effects of redshift and extinction,we generate the mock data by convolving SED and filter curves,and then we estimate their photozand analyze the results.We explore the capability of each MCI medium-band filter in the photozmeasurements,and investigate the filter design by changing the filter position of the central wavelength and the band wavelength width.The results can provide good references for the design of the CSSTMCI medium-band filters.
This paper is organized as follows:in Section 2,we introduce the de finition of the CSST-MCI medium-band filters and the method of generating mock data based on the COSMOS catalog.In Section 3,we use a modi fied LePhare software to estimate the photoz,and then investigate the dependency of photozaccuracy on the band and filter parameters for the MCI medium-band filters.Finally we summarize the results in Section 4.
2.Mock Data
2.1.The De f i nition of the MCI Medium-band Filters
Based on the current instrumental design,the CSST-MCI medium-band filters include 9 filters from near-ultraviolet to nearinfrared,including F275W,F336W,F375M,F450M,F500M,F630M,F763M,F845M and F960M.We set the curve shape of the intrinsic transmission of the filters to trapezoid,and show the transmission curves for the filters that are under test in Figure 1.The left panel shows the transmission curves of the MCI mediumband filters,which are used to explore the dependency of photozaccuracy.The right panel is the transmission curves of the SC broad filters,which are based on Cao et al.(2018).Here the intrinsic transmission and the total transmission including the detector quantum ef ficiency are presented in dashed and solid lines,respectively.We list the de finition of the MCI medium-band filters in Table 1.Here we show the mean wavelengthλc,full width at half maximum(FWHM),and the wavelengths at 50%of the maximum transmission curve(left:λL50,and right:λR50),the steepness and the top transmission ef ficiency for each band.In this paper,we set the slope of the intrinsic transmission curve to be
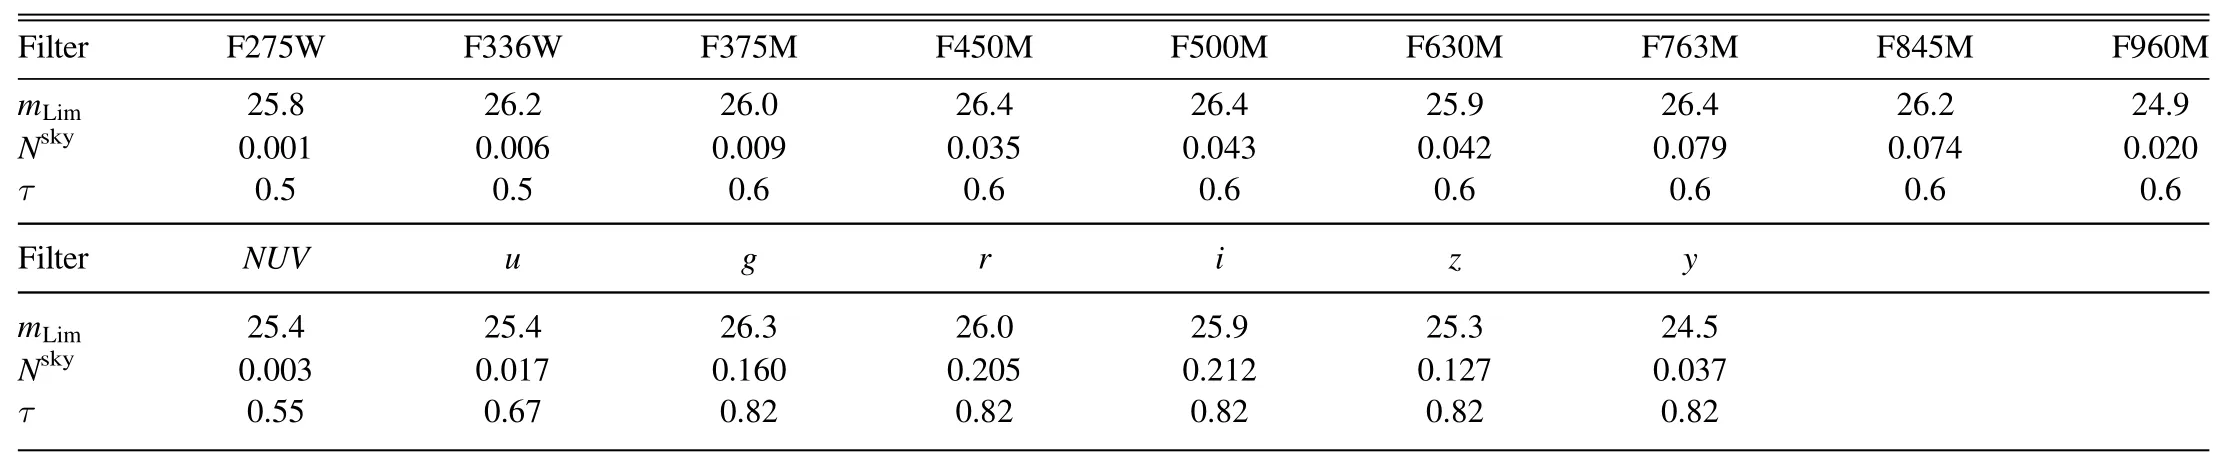
Table 2The Parameters of the CSST MCI and SC Filters
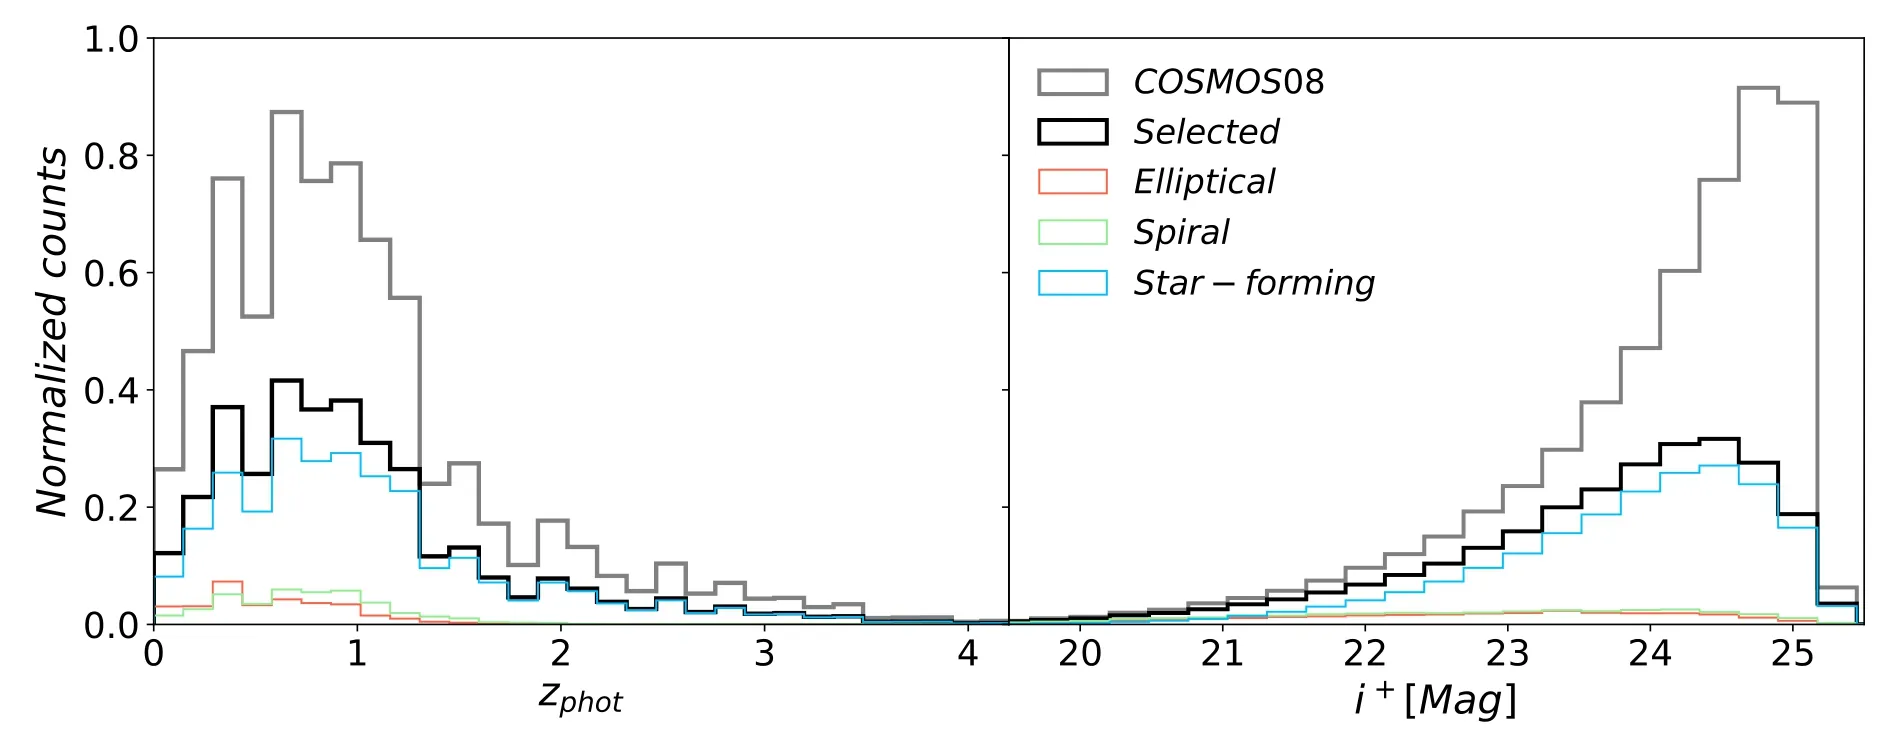
Figure 2.The redshift and magnitude distributions of the galaxies in the mock catalog.The black and gray histograms show the galaxies from the selected highquality samples and COSMOS08 catalog,respectively.The distributions of elliptical,spiral,and star-forming galaxies are shown in red,green and blue histogram,respectively.We can find that the peak of the redshift distribution is z~0.7 before and after the selection,and some faint galaxies are removed during the selection process.The peak of the magnitude distribution becomes i~24.3 after the selection.
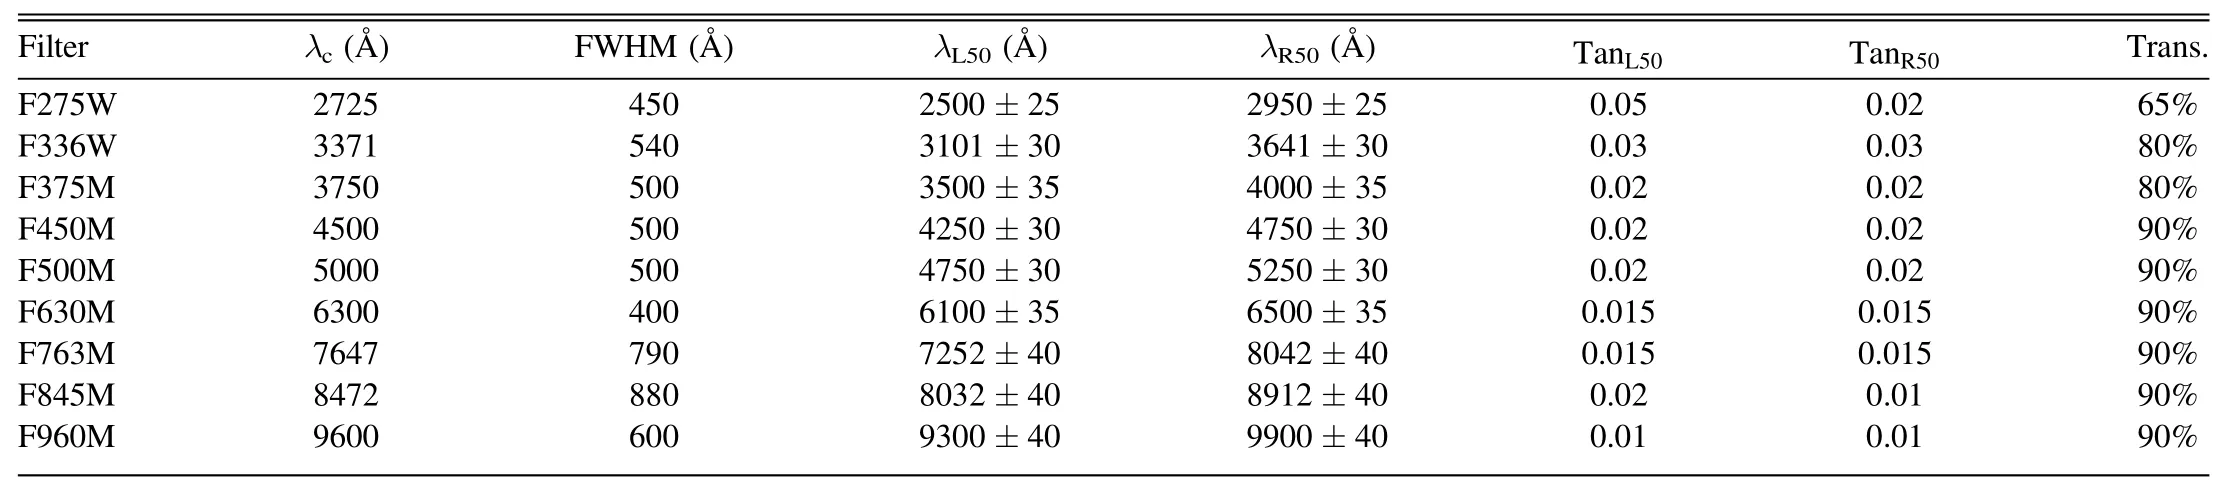
Table 1The CSST-MCI Medium-band Filter De finition
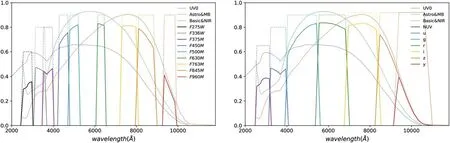
Figure 1.Left:The transmission curves for the nine MCI medium-band filters from NUV to NIR bands,including the F275W,F336W,F375M,F450M,F500M,F630M,F763M,F845M and F960M.Right:The transmission curves for the seven SC filters,including the NUV,u,g,r,i,z,and y bands.The dotted curves show the detector quantum ef ficiency,and the dashed lines and the solid lines are the intrinsic transmission and the total transmission by considering detector quantum ef ficiency,respectively.
constant,the steepness is de f ined as Tanx=Δλxλx,here the subscriptxrepresents L50 or R50,Δλxis the wavelength difference between 0%and 100%maximum transmission.We estimate the limiting magnitudemLimfor point sources with 5σ detection at each band,here the point sources are measured within 80%energy concentration region of a Gaussian PSF.Then wede finition is the basic case,we will study the dependence of each MCI medium-band filter and the de finition parameters on the photozaccuracy in our following discussion.
2.2.Galaxy Catalog
Following Cao et al.(2018),we use the COSMOS08 and COSMOS15 catalogs to generate the mock galaxy catalog for the CSST-MCI observation in the SC photozcalibration.The data of the catalogs cover about 2 deg2COSMOS field,which is expected to be similar to the CSST-MCI SC photozcalibration survey.The wavelength range is from the ultraviolet to mid-infrared(30 bands)from Galaxy Evolution Explorer(Martin et al.2005),Subaru Telescope(Capak et al.2007;Taniguchi et al.2007),Canada–France–Hawaii Telescope(Boulade et al.2003),United Kingdom Infrared Telescope(Warren et al.2007)and Spitzer Space Telescope(Rowan-Robinson et al.2008).The catalogs contain 385,065 sources withi+≤25.2,and the photozaccuracy ofσΔzatz<1.25 is 0.02,0.04,0.07 for Subarui+~24,~25,~25.5,respectively.
In order to investigate the photozcalibration,we need to generate the mock flux data based on redshift,magnitude,galaxy type,best-fitting SED,dust extinction and other information from the catalogs.To collect all of these properties,we need to combine the COSMOS08 and COSMOS15 catalogs.7The information of galaxy size is missing in the COSMOS08 catalog,while there are no dust extinction and best-fitting SED in the CSOMOS15 catalog.Hence we need to match the relevant galaxies in the two catalogs and combine them together to collect all of necessary information.Then 219,566 galaxies are obtained after removing stars,X-ray and masked sources.In order to perform the photozestimation with required accuracy,we select the high-quality sources with the signal-to-noise ratio(S/N)≥10 ingoriband(Zhan 2021).The calculation of S/N will be discussed in Section 2.3.Then we obtain 103,931 galaxies as the selected catalog.Finally,we randomly select 10,000 galaxies from the high-quality sample,and calculate the photometric data and errors for each band based on the CSST instrumental parameters.
In Figure 2,we show the magnitude and redshift distributions of the galaxies we use in the left and right panels.Here,the black and gray histograms show the galaxy samples from the selected catalog and the COSMOS08 catalog,respectively.We can find that some faint galaxies are removed during the selection process,so the peak of the magnitude distribution becomesi~24.3 after selecting,but the range is still fromi~19 to~25.The redshift distribution of the two catalogs is similar,and the peak of redshift distribution aroundz=0.7 and the range can extend toz~4.In COSMOS08 catalog,galaxies are classi fied into three categories:elliptical,spiral,and young blue star-forming galaxies,shown in red,green and blue histograms,respectively.We find that the star-forming galaxies are dominant in the catalog,accounting for about 75%of the total.For the star-forming and spiral galaxies,the peaks of redshift distributions are atz~0.7,and it is atz~0.3 for elliptical galaxies.
2.3.Data and Error Estimation
We adopt the SED templates used in the COSMOS photometric redshift fitting as the original SED templates to generate the mock flux data(Arnouts et al.1999;Ilbert et al.2006).Totally 31 basic SED templates are used here,including seven elliptical galaxy templates and 12 spiral galaxy templates(from S0 to Sdm),which are derived from Polletta et al.(2007).Other templates are the young star-forming galaxy templates(starburst ages from 0.03 to 3 Gyr),which are generated by the BC03 method(Ilbert et al.2009).Following Cao et al.(2018),we extend the wavelength coverage of the COSMOS templates to~90?using the BC03 models.In order to increase the completeness of the SED templates and avoid the“over-fitting”effect,we use the linear interpolation method to generate new SEDs.For simplicity,we assume that the transitions between different SEDs are continuous and that the probability of adjacent SEDs is similar,so that the new intrinsic galaxy SEDSintcan be written as,

wherea∈(-0.5,0.5)is a random factor,Siis the best-fit SED template for a source from the COSMOS catalog,andSi±1is the adjacent templates ofSi.We setSi+1fora>0,andSi-1whena<0.
An important effect to consider is the extinction of dust from the galaxies themselves,especially for high redshift galaxies.The most used extinction law in high redshift studies is derived by Calzetti et al.(2000)for the near starburst galaxy.To increase the diversity,four other excellent dust extinction laws are also adopted,they are derived from the studies of the Milky Way(Allen 1976;Seaton 1979),Large Magellanic Cloud(Fitzpatrick 1986),and Small Magellanic Cloud(Prevot et al.1984;Bouchet et al.1985).We add the dust extinction to SED when generating the mock flux data.Here the flux density after dust reddening form galaxies themselves can be expressed as(Calzetti et al.1994;Galametz et al.2017),

HereE(B-V)is the color excess,andk(λ)is the reddening curve.Another effect that must be accounted for is the absorption of intergalactic medium(IGM).The emission from high redshift galaxies usually can be absorbed by the neutral hydrogen clouds in the IGM.We make use of the attenuation model discussed by Madau(1995)to process the redshiftedSext,and obtain the final observed spectrumSmodel.The extinction laws used above can be found in Figure 4 of Cao et al.(2018).
For a given spectrum from the target source,the value of mock flux can be calculated by convolving the final observed spectrumSmodelwith the filter transmission functionT(λ),sothe mock fluxFmockcan be de fined as,

Herexrepresents thexband,λ=λres(1+z)is the observed wavelength,andτis the mirror ef ficiency.We show the CSST mirror ef ficiency in Table 2.For the CSST-MCI,the mirror ef ficiency is found to be~0.5 for F275W and F336W bands,and~0.6 for other bands.BecauseSmodelis a normalized spectrum,we need to use the information of the COSMOS galaxy catalog to calibrate the mock data.We can write the AB magnitudemxon thexband as,
here,the number of exposuresnare 8 and 2 for the MCI and SC,respectively,the single exposure timet=300 s for MCI and 150 s for SC,npixis the number of detector pixels used in spectral sampling,Ndark=0.017e-s-1pixel-1andNRN=5.5e-pixel-1are the dark current and the read noise of CCD,respectively.is the sky background at wavelength λ,we estimate the sky backgroundNskybased on the average values of the zodiacal light and earthshine measured by Ubeda et al.(2012),and show the values ofNskyfor each filter in Table 2.
In Equation(5),Cλis the count rate from the target source at wavelengthλine-s-1,and it can be expressed as,

wheremis the magnitude of an arbitrary object.ZP is the zeropoint of an instrument,and we can de fine the zero-point of a filter such that(Cao et al.2021),

wheremLimis the limiting magnitude,and we show the values ofmLimfor each filter in Table 2.σis the standard deviation of noise.
In Figure 3,we show an example of mock flux data from four randomly selected galaxies with redshiftsz?0.1,1.0 and 2.0.The SC and MCI data are shown in the left and right panels,respectively.Here,the crosses and solid lines are the mock flux data and final observed spectra described in Equation(3),respectively.The error bars are 1σuncertainties that account for all noises and errors.
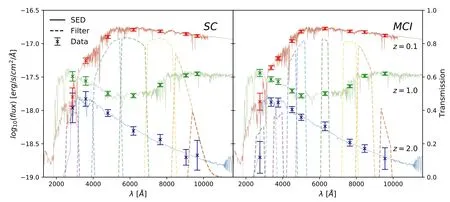
Figure 3.An example of mock flux data of four randomly selected galaxies with redshift z?0.1,1.0 and 2.0.Here,the dashed lines show the filter transmission with detector quantum ef ficiency,the solid lines denote the final observed SED,and the crosses with error bars are the mock flux data.The SC and MCI data are shown in the left and right panels,respectively.
3.Photo-z Estimation and Filter Dependency
3.1.Photo-z Accuracy Estimation
Following Cao et al.(2018),we modify the LePhare code to include the upper-limit information(Arnouts et al.1999;Ilbert et al.2006).Here the best fitting redshiftzbfis derived by the chi-squareχ2method,which can be obtained by,
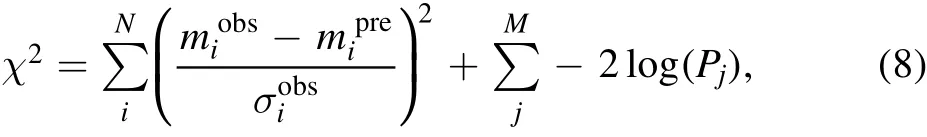
whereNandMare the number of data with S/N≥3 and S/N<3,respectively.miobsandσiobsare the observed AB magnitude and its error for theith band,respectively,which are derived from the mock data described in the Section 2.3.mipreis the predicted magnitude by the photozfitting software.Pjis the probability that the predicted data are between 0 and the upper limit value proposed by Cao et al.(2018),
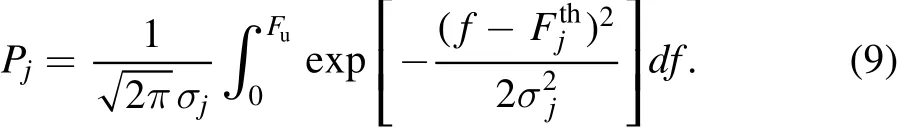
Herefis the flux variable,is the predicted flux in bandj,σjis the flux error,andFu=3σjis the upper limit value of bandj.
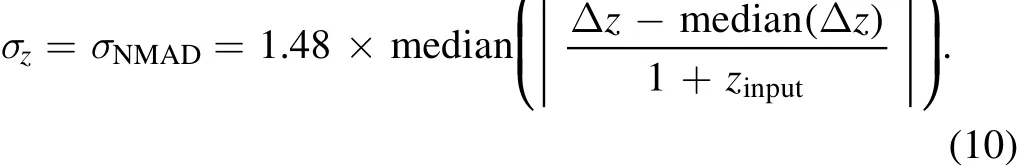
Here,we use two parameters:the deviationσzand the catastrophic redshift fractionfcto analyze the accuracy of redshift.The catastrophic redshift fractionfcrepresents the proportion of data with|Δz|/(1+zin)>0.15 to the total number,whereΔzis the difference between the input redshiftzinand the photozbest fitting redshiftzbf.In order to suppress the weighting of a small number of large error data,we use the normalized median absolute deviationσNMAD(Ilbert et al.2006;Brammer et al.2008)to calculate the deviationσzofΔz,and we can write as,
We first investigate the improvement of photozaccuracy by adding MCI medium-band filters.The photometric data are obtained by convolving all the MCI medium-band filters and SC filters with SED based on the method introduced in Section 2.3,and then we estimate and analyze the photozof the mock photometric data with and without MCI data.We showzinputversuszoutputfor the current filters in Figure 4,the left panel is the result with SC data only,and the right panel is the result with all data.We find that the deviation and the catastrophic redshift fraction of the fitting results containing only the SC data areσz=0.028 andfc=4.75%.After adding MCI data,we find that the accuracy is greatly improved compared with before,and the deviation and catastrophic redshift fraction becomeσz=0.015 andfc=1.48%.
Note that active galactic nucleus(AGN)may contaminate galaxies in photometric surveys,that can result in wrong photozestimation if they are misidenti fied as galaxies.However,we find that the number of AGNs(~107)observed by the CSST only takes about 1%of the number of galaxies(~109)in the CSST photometric survey(LSST Science Collaboration et al.2009;Gong et al.2019).Besides,since the CSST can simultaneously perform photometric and spectroscopic surveys,it has a distinct advantage of identifying and con firming AGNs,which can be helpful to effectively remove AGNs from the galaxy sample.Therefore,we assume that the AGN contamination can be ignored here.
3.2.Dependency of Photo-z Accuracy on Each Band
Next we investigate the effect of each MCI medium-band filter passband on photozaccuracy by removing it,and explore the trend of the photozaccuracy with the change of filter parameters.The value of the deviationσzand the catastrophic redshift fractionfcfor removing one filter case are shown in Figure 5 and Table 3.Note that we divide the results into two groups,represent the result using only the MCI data,andσzandfcrepresent the result using both the MCI and SC data.
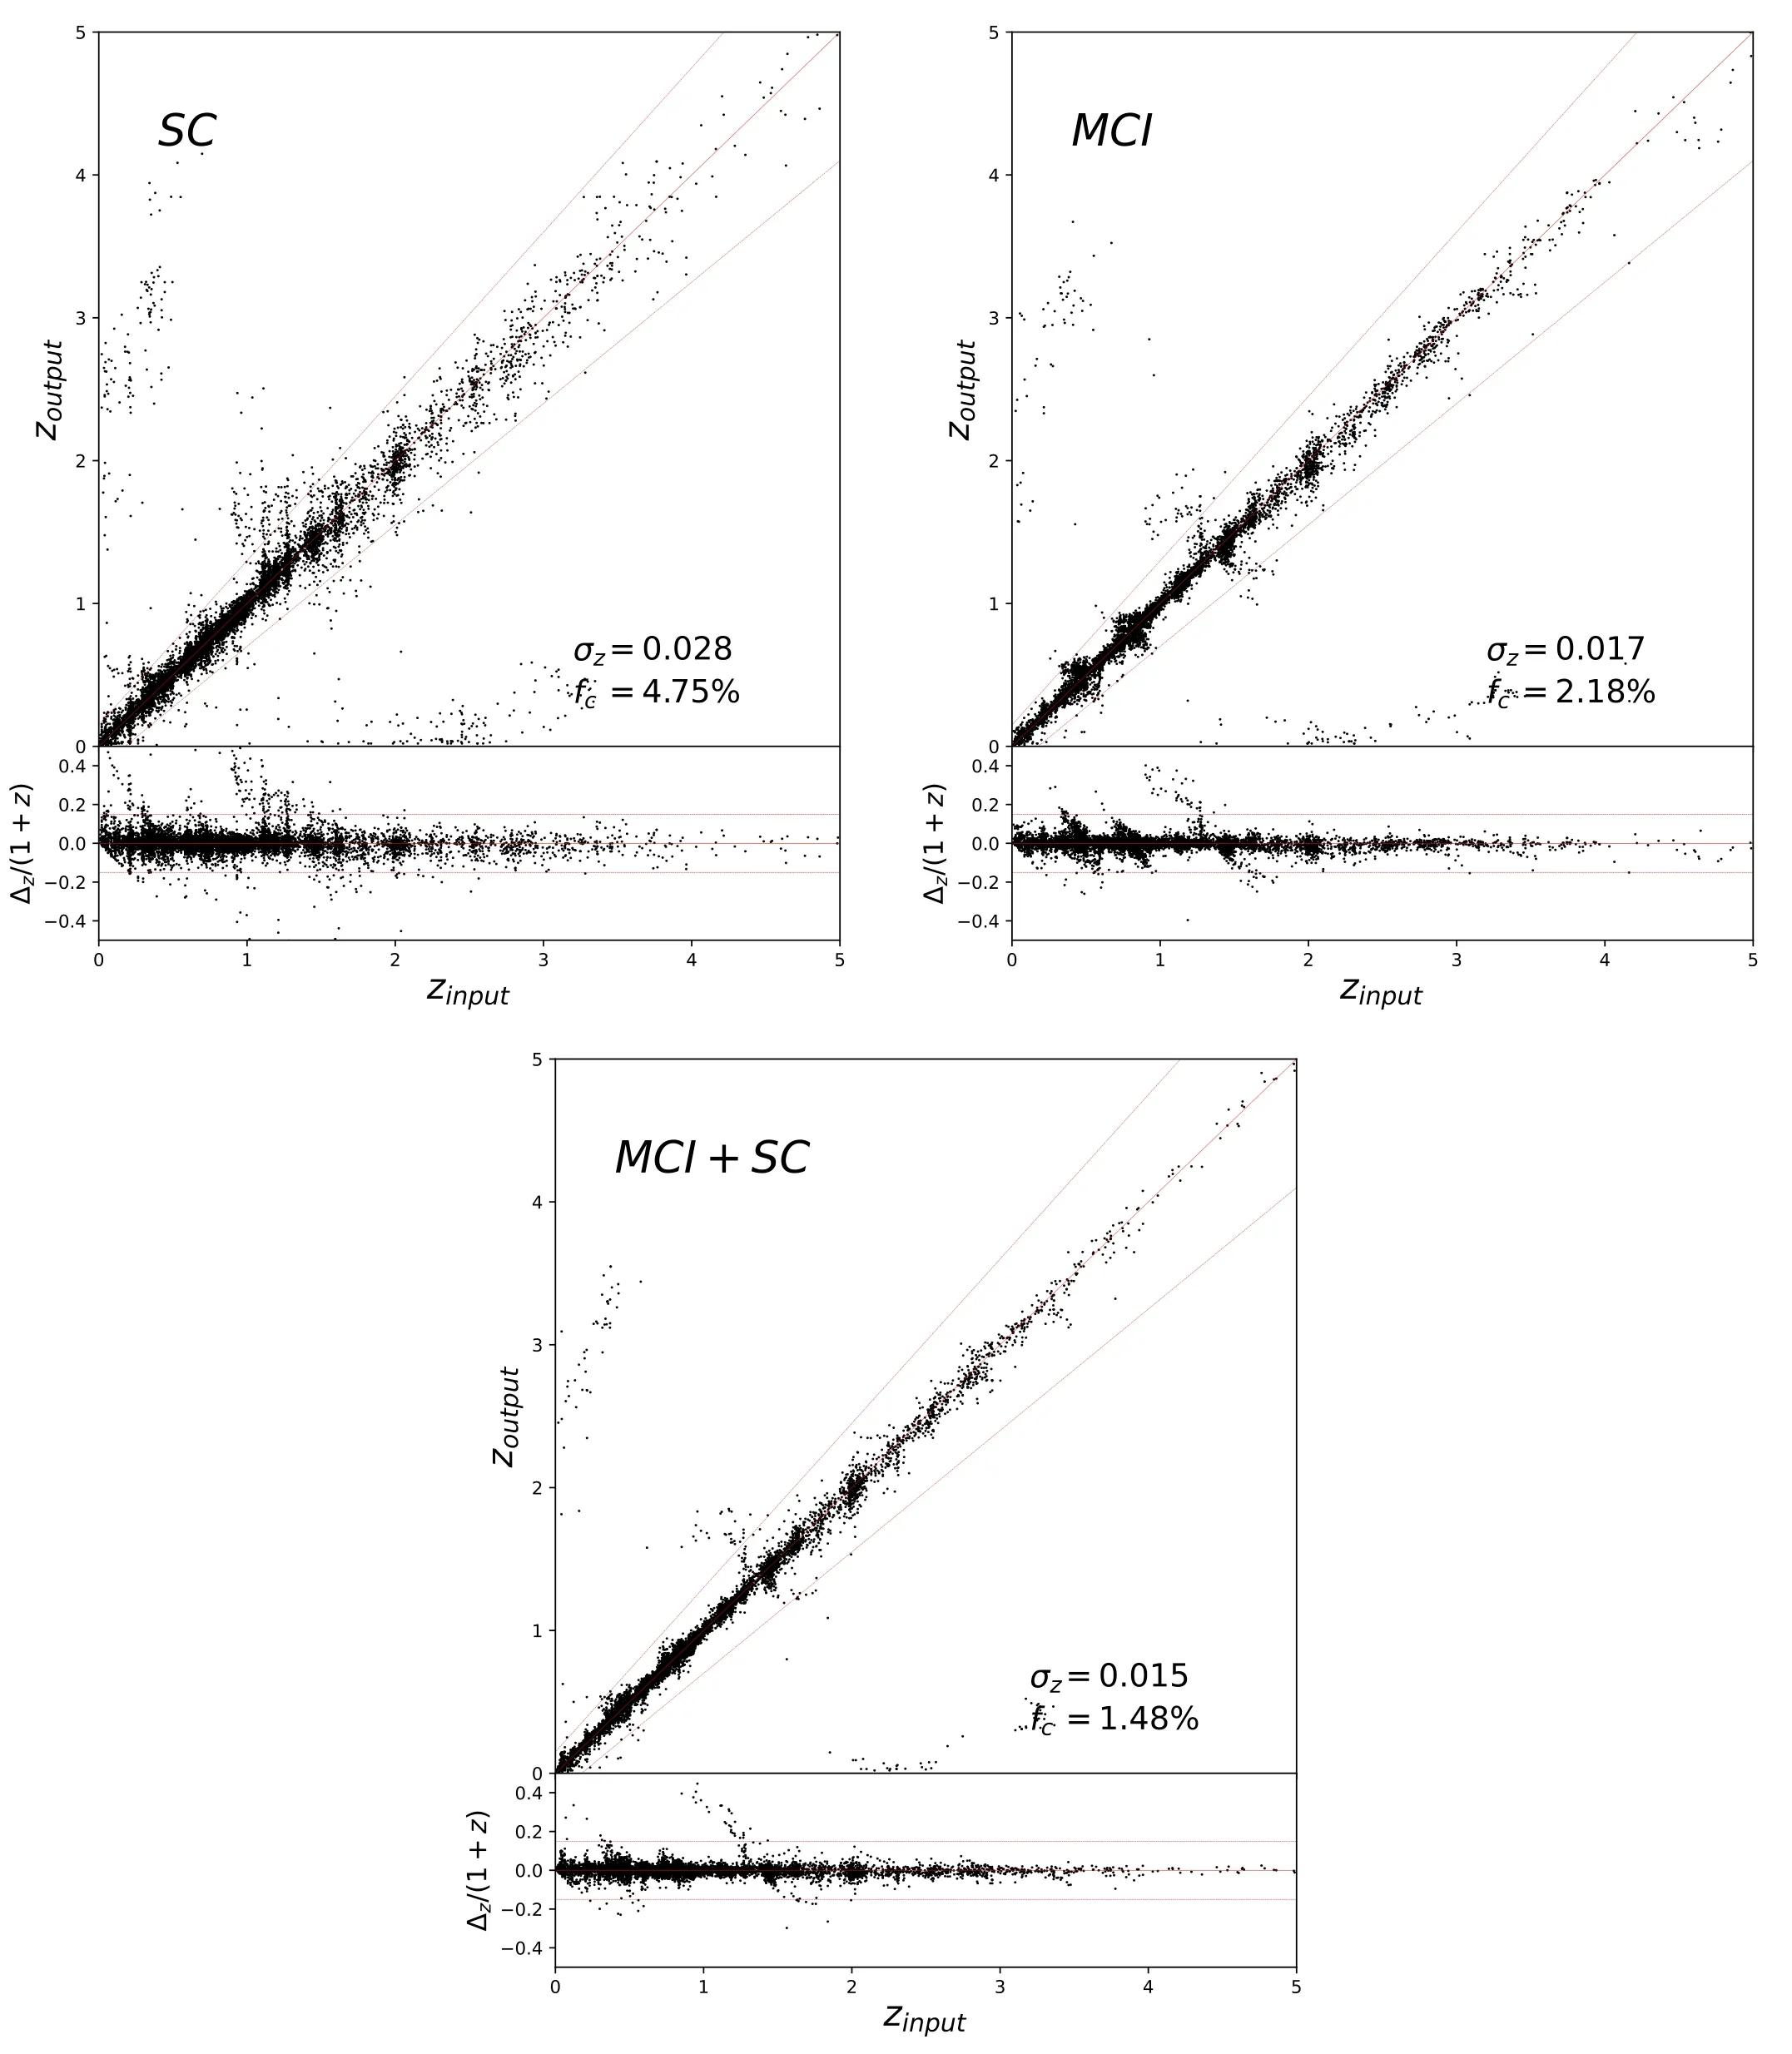
Figure 4.Left:The photo z fitting results including the information of upper-limits.Here,the photo z are obtained from the SC data only.Middle:The result obtained from the MCI data only.There are a few areas of poor estimation due to gaps between bands,which will be discussed in detail in Section 3.2.Right:The result including all SC and MCI data.Here the deviationσz=0.015 and the catastrophic data redshift fraction f c=1.48%,which is signi ficantly improved compared to σz=0.028 and f c=4.75%without considering the MCI data.
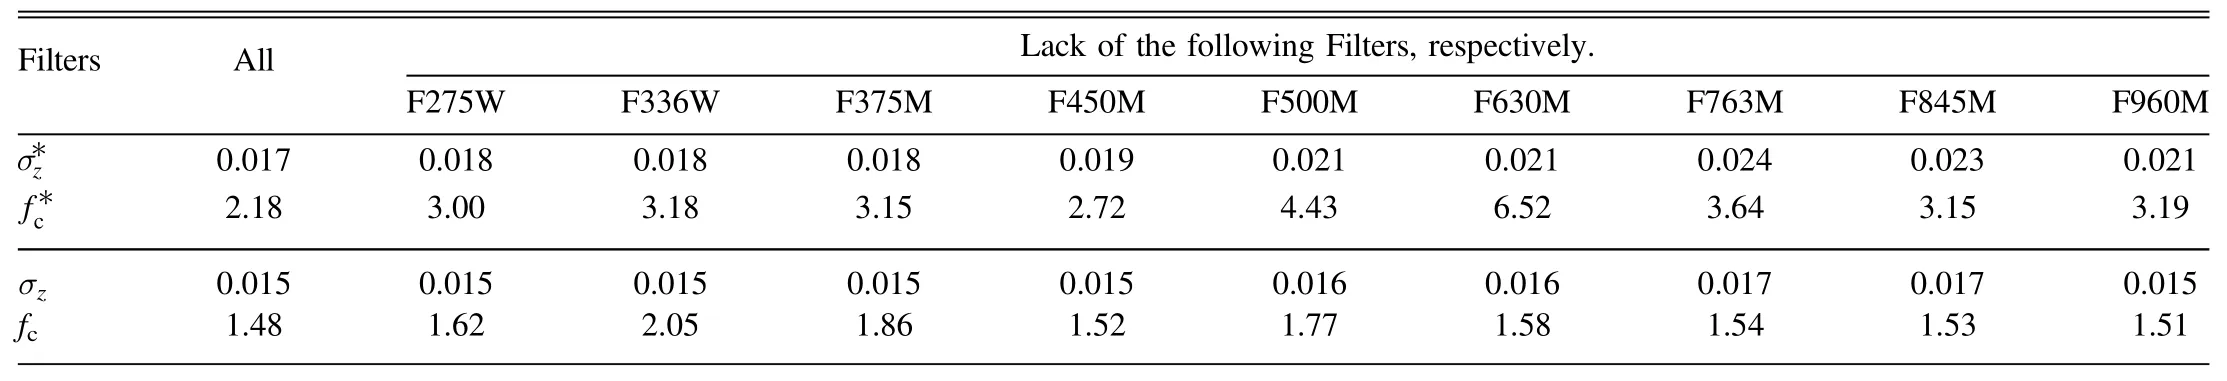
Table 3Theσz and f c for Different Filter Sets
When removing the F275W,F336W or F375M band,we find that the values of deviation=0.015)are similar to in the case that the relevant filter is included,but the catastrophic redshift fractionincreases signi ficantly.Due to the low ef ficiency of the filter in the near-ultraviolet band,the improvement of photozaccuracy is limited compared with other bands.However,the presence of the near-ultraviolet band can pin down the number of catastrophic redshifts(Cao et al.2018).This is because the accuracy of the template fitting method depends on the recognition and calibration of the strong spectral features.When fitting the values of photoz,the fitting program may misidentify the Lyman break with the Balmer break or 4000?break.Adding detection information in the near-ultraviolet band helps improving the accuracy of recognition.On the other hand,improving the ef ficiency and increasing the exposure time can also improve the accuracy of photozmeasurement.
As shown in Table 3 and Figure 5,the bands with wavelengths greater than 3750can signi ficantly affect the photozfitting results.The SED template fitting method relies on matching the strong feature,especially the 4000?break(3750–3950?).Removing the band with wavelengths greater than 3750?will result in a poor estimation in the corresponding redshift range,which can conveniently obtained by950? -1 andzmax=λR3750? -1.Here,λLandλRare the wavelengths at both ends of the gap created by removing a band.In Figure 5,we find that the F450M,F500M,F630M and F763M bands mainly affect the fittings atz?0–0.3,0.2–0.6,0.3–1.0 and 0.6–1.2,respectively.By checking these areas on thezinputversuszoutputmaps,we can find that the dots do not follow tightly the linezoutput=zinput,but spread around it.Because the missing band affects the photozaccuracy within the corresponding redshift range,the redshift distribution will indirectly affect the photozaccuracy.For example,we haveand r espectively,that can decrease the photozf itting accuracydramatically.An important reason is that F630M and F763M bands cover the peak(atz~0.7)of the galaxy redshift distribution of our catalog.
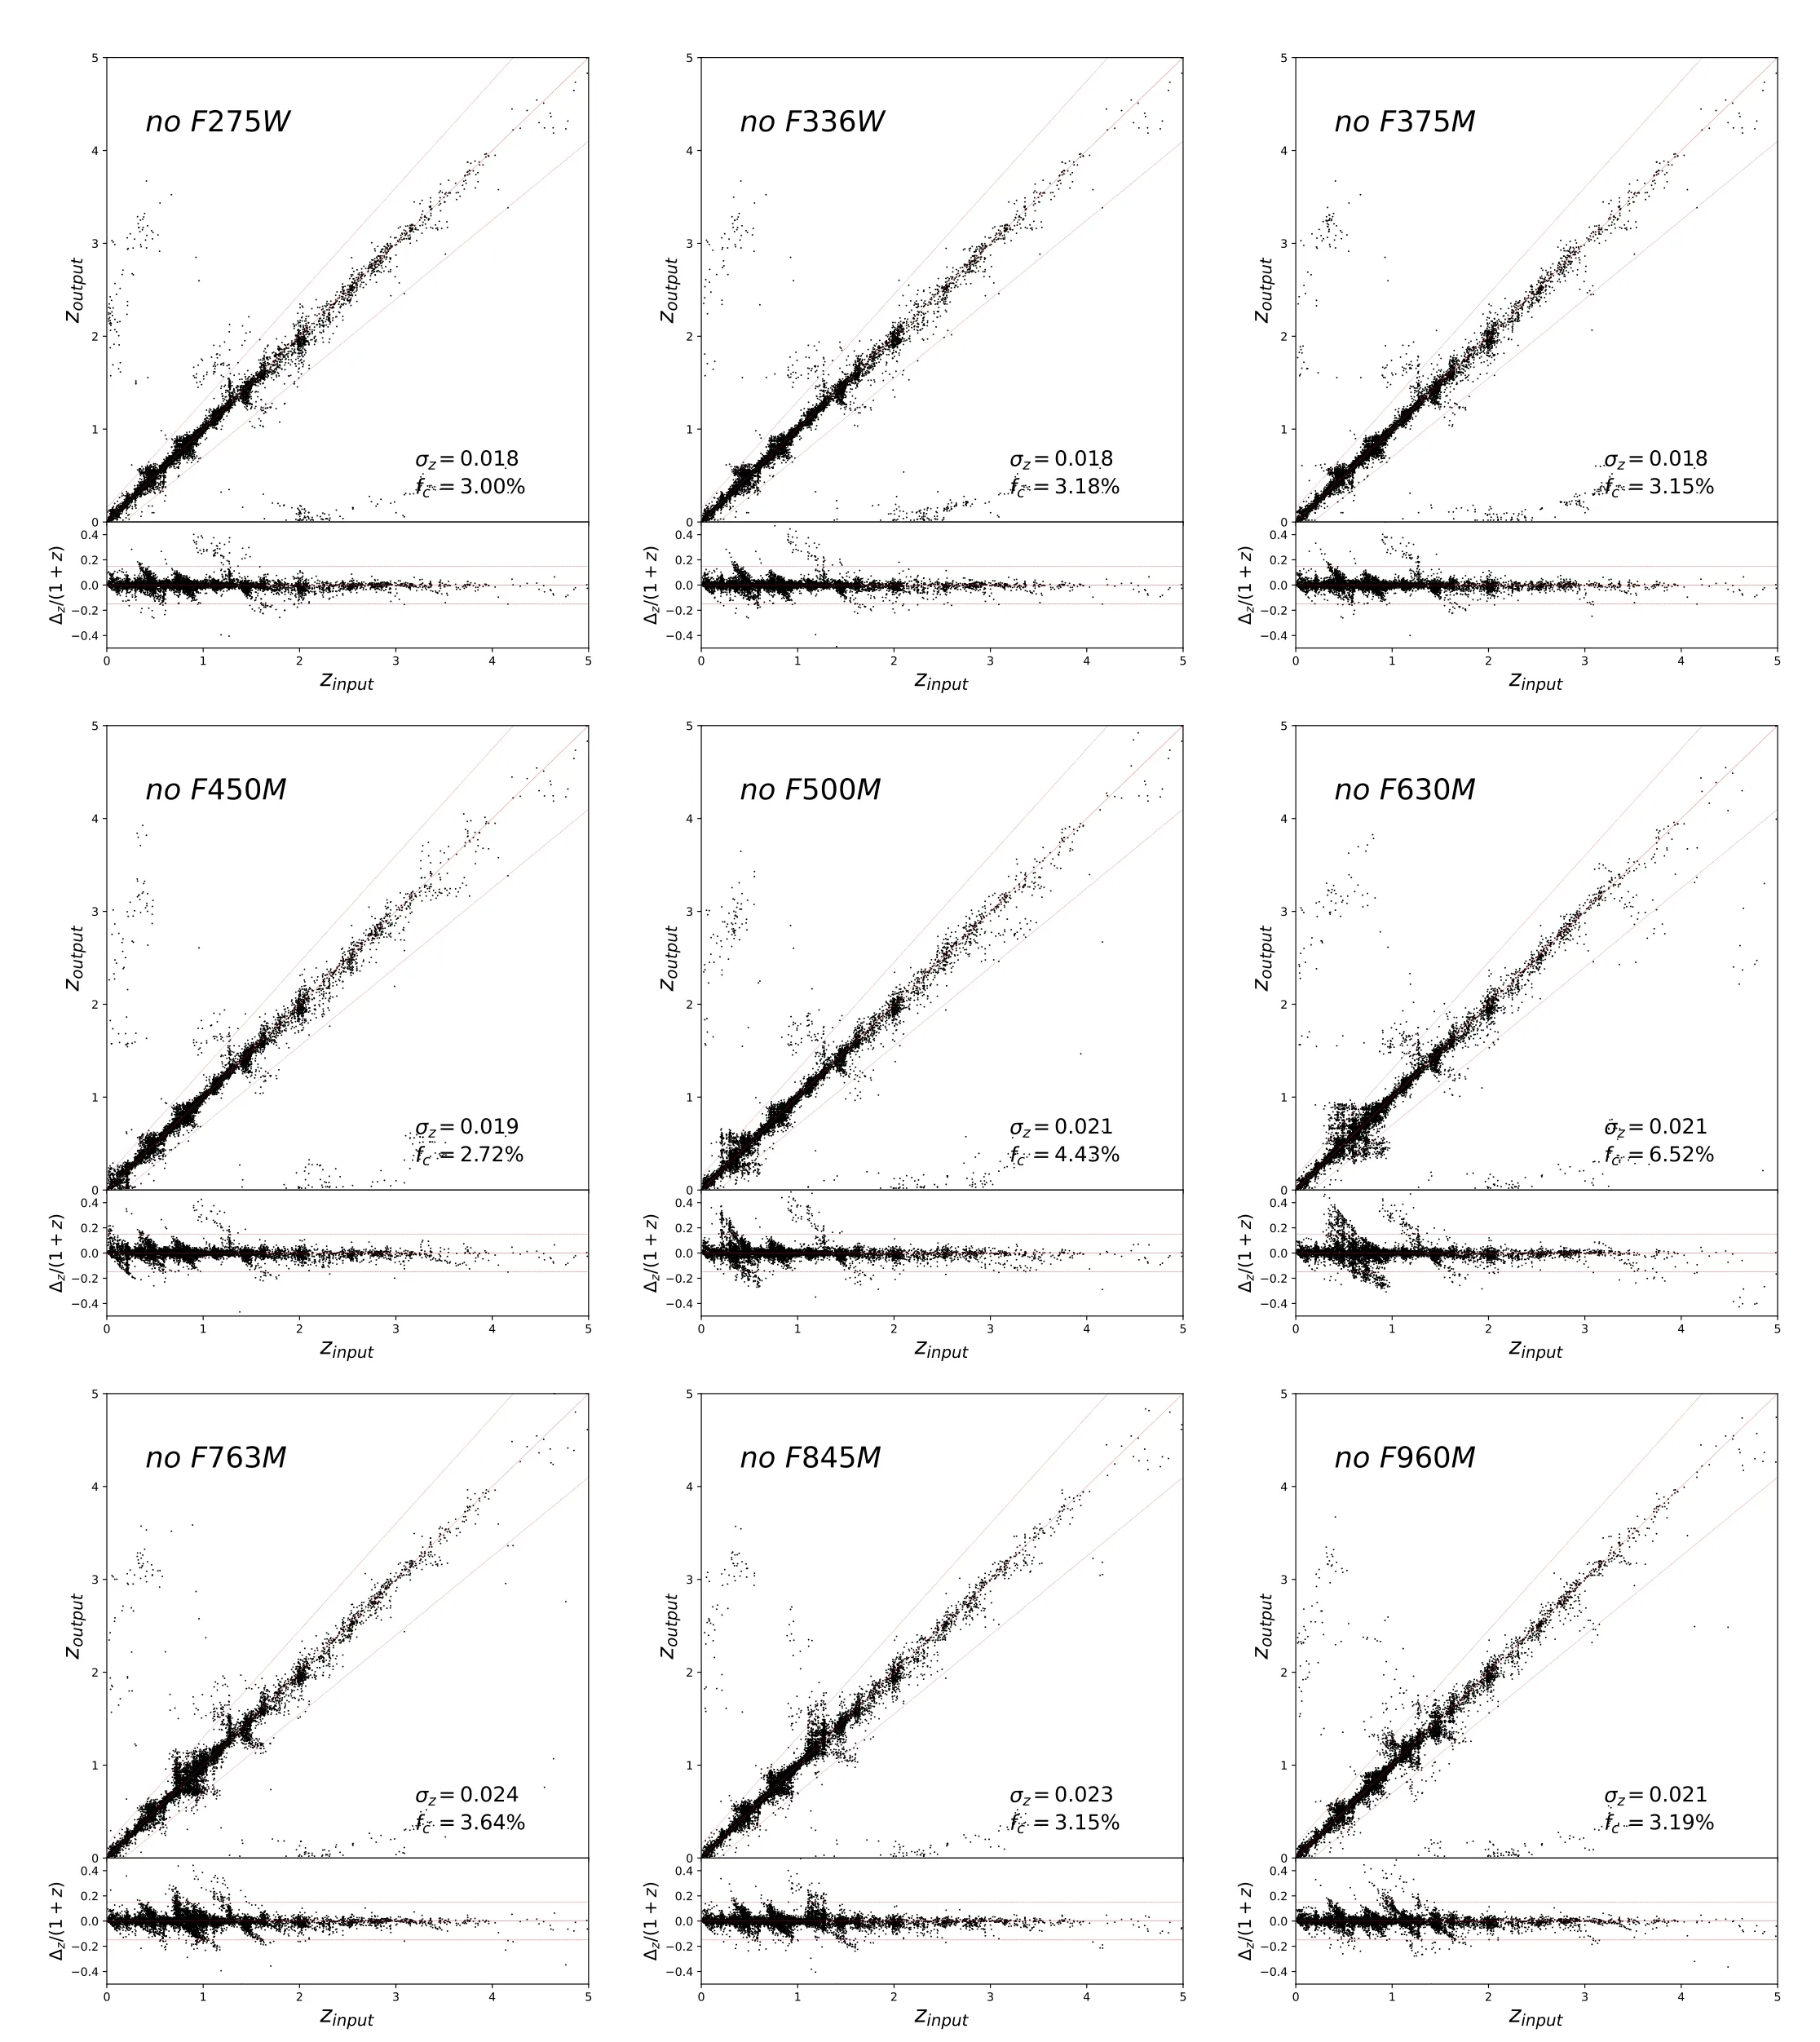
Figure 5.The z input vs.z output for exploring the effect of a single MCI filter on the photo z accuracy.Due to the restriction of the ef ficiency of the filters in the nearultraviolet band,they have less effect on the photo z accuracy than other bands.Removing the band with wavelengths greater than 4000?will result in a poor estimation in the corresponding redshift range.
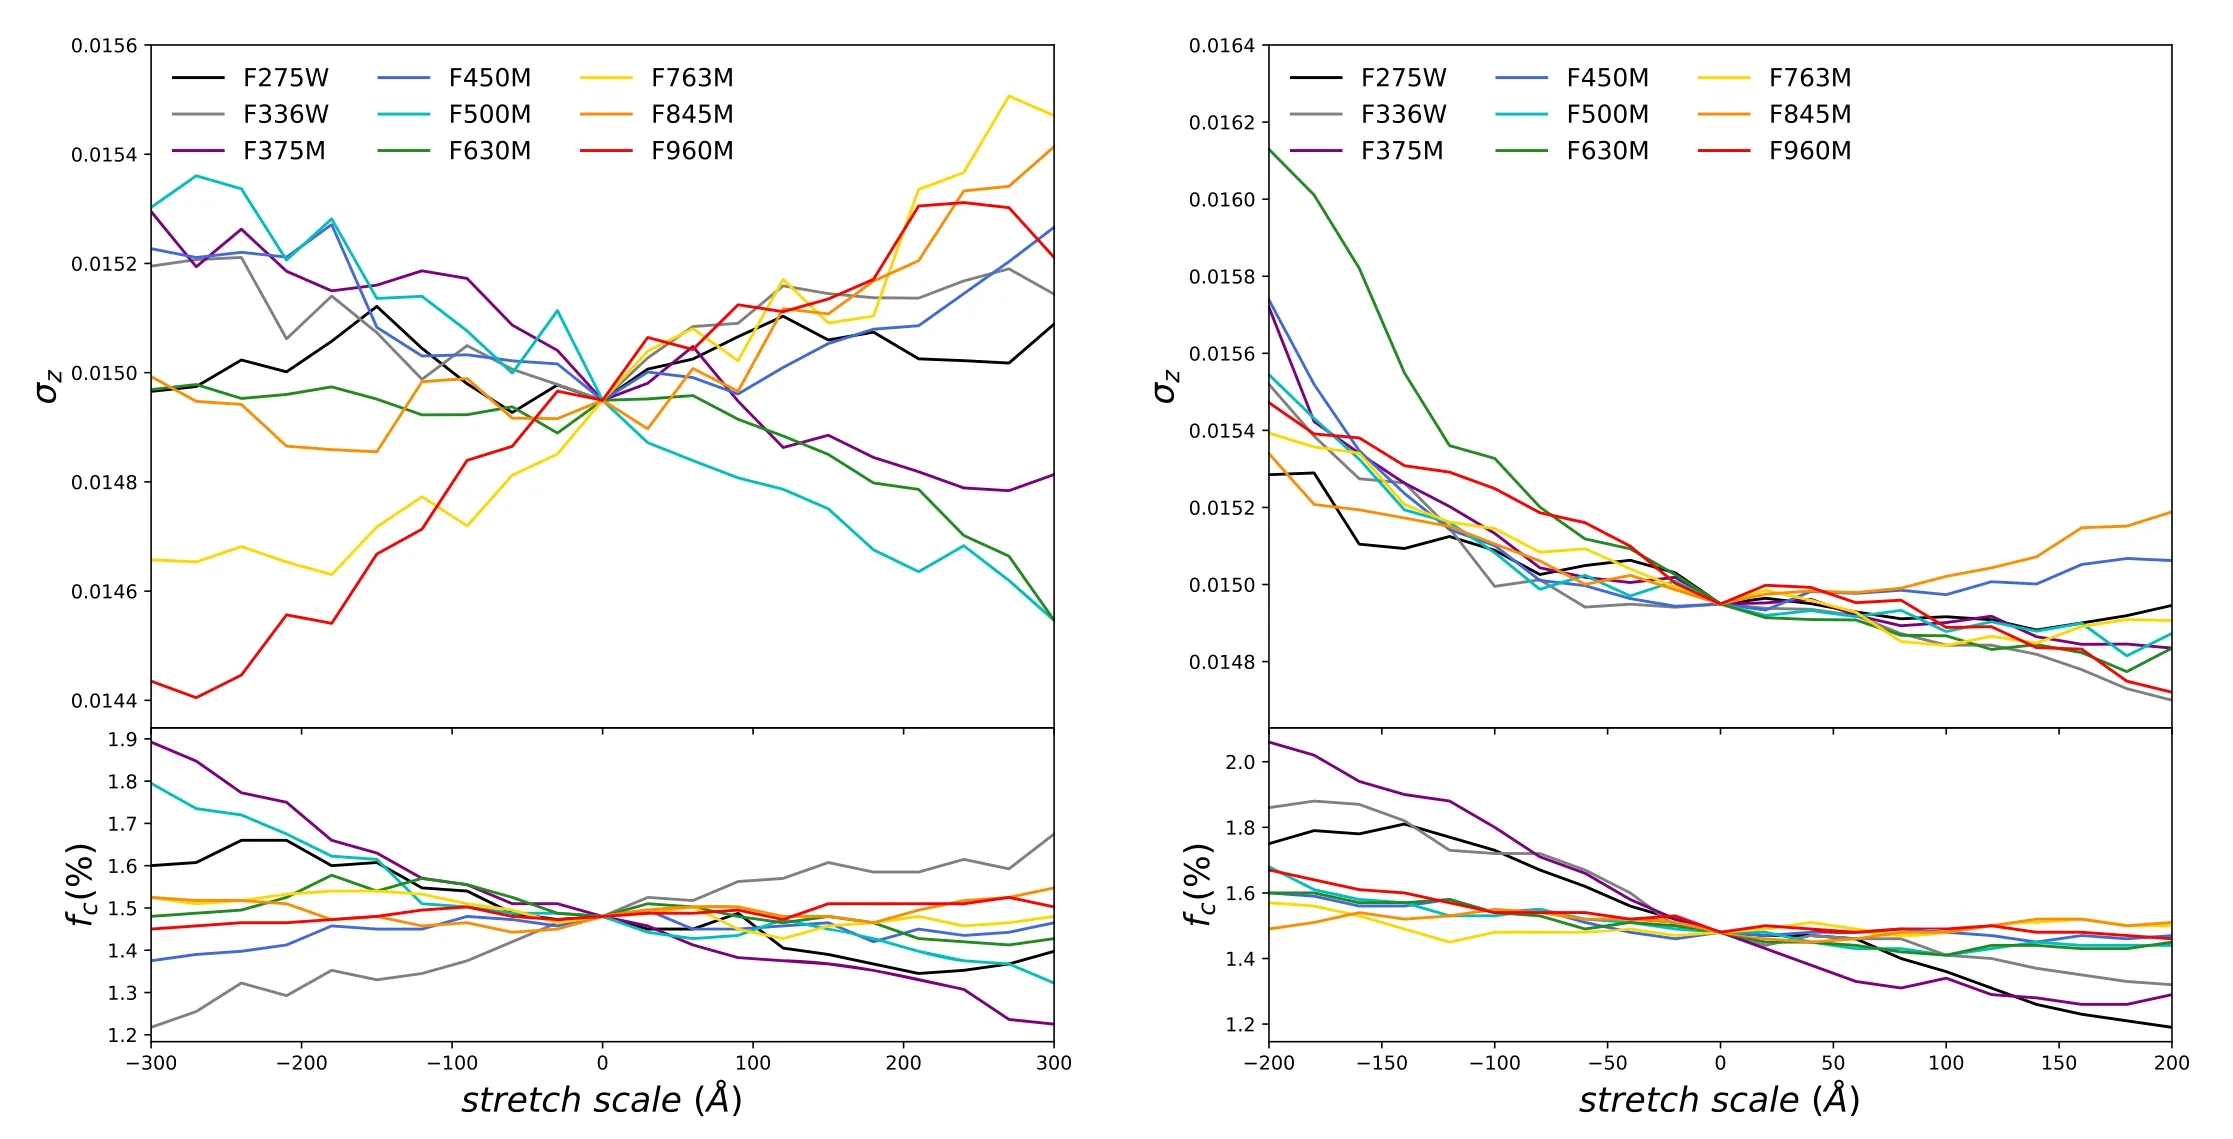
Figure 6.Left:theσz and f c as functions of the parameterλx c.Right:the results as functions of the width stretch scaleΔλx s.Here the position equal to 0 represents the photo z fitting result using the original filter,which are shown in Figure 1.
We can find that there are some catastrophic redshift dots on the left and bottom ofzinputversuszoutputmaps,which are due to the misidenti fication of spectral features at short wavelength as the features at long wavelength.According to Cao et al.(2018),the addition of ultraviolet and infrared bands can be effectively reduce the rate of catastrophic redshifts.As shown in Table 3,the values ofσzandfcare similar for different filter groups,especially forσz.The main reason for this phenomenon is that the SC filters fill the gaps between the MCI mediumband filters.
3.3.Dependency of Photo-z Accuracy on Filter Parameters
position for most curves.However,a bluer F336W,F763W and F960M bands or redder F275W,F375M,F500M and F630M bands may be better.As the discussion in Section 3.2,changing the near-ultraviolet bands F275W,F336W and F375M mainly improves the number of catastrophic redshift in photozfitting.The bluer F960M can signi ficantly improves the deviationσzof photozestimation.This is because moving the F960M band toward the blue end can help improving the ef ficiency of the filter under the in fluence of the detector quantum ef ficiency curve.
In the right panel of Figure 6,we show theσzandfcas a function of the width stretch scalewhich is adopted to adjust the FWHM byΔλ=Δλori+Δλs.HereΔλoriis the FWHM of the original filter shown in Table 1.We can find that the wider filter is helpful to improve the accuracy of photozfitting,and mostσzandfcof the original filters are around the minimum values.According to the curve offc,only increasing the width of the near-ultraviolet filters can be helpful to pin down the number of catastrophic redshift.Due to limited manufacturing technology,the ef ficiencies of the near-ultraviolet filters are lower than other filters.The simulation results show that we can reduce the effect of the inef ficient filter on the photozfitting by increasing the width and exposure time.Wider F630M and F960M bands can be helpful to reduce the deviation.But the improvements ofσzare not much(less than 0.001),and this indicates that the original filters are proper for the photozcalibration.
4.Summary
In this work,we investigate the accuracy of photozmeasurement with CSST-MCI medium-band filters,which cover a large wavelength range from near-ultraviolet to nearinfrared bands.We select high-quality galaxies with S/N≥10 ingoriband from the COSMOS08 catalog,and use these galaxy templates generate the mock catalog,which has peaks of the magnitude distribution and redshift distribution atmi+ ~24.3 andz~0.7,respectively.Then we randomly select 10,000 galaxies from the high-quality samples,and generate the mock data and errors based on CSST instrument parameters.Then we measure the photozand analyze the results with two parametersσzandfc.
First,we build the SED template library using 31 extend SEDs,which include elliptical,spiral and star-forming galaxy templates.We simulate the extinction of dust from a galaxy itself for a restframe SED,and then shift the processed SED to the given redshift from the mock catalog.After considering the absorption of the IGM,we calculate the flux by convolving the final SED with the filter transmissions,and add Gaussian noise to the final mock data.The uncertainties of data are obtained by calculating errors from the instrumental noise,sky background and systematic errors.We adopt the modi fied LePhare code to fit the photozusing both MCI and SC data,and we find that the results can achieveσz~0.015 andfc~1.5%.
Next,we investigate the effect of each MCI medium-band filter passband on photozaccuracy by removing it.The mock data are generated after removing one band each time,and then we perform the fitting process and analyze the photozaccuracy.We find that the accuracy of the SED template fitting method depends on the recognition of 4000?break,and the bands with wavelengths greater than 3750?can signi ficantly affect the photozfitting accuracy.Due to the in fluence of redshift distribution,the F630M and F763M bands have the largest effects onσzandfc.On the other hand,the near-ultraviolet bands have relatively small in fluence on the accuracy of photoz.
Finally,we investigate the dependency of photozaccuracy on the design parameters of the MCI medium-band filters.We focus on central wavelength positionλcand wavelength coverageΔfor each band,and estimate the accuracy for the certain filter parameter ranges.We find that theσzandfcare always less than 0.016%and 2%(around 0.015%and 1.5%),respectively,in the filter parameter ranges we explore.We find that the bluer F336W and F960M bands or redder F275W,F375M,F500M and F630M bands are more advantageous to the photozestimation,but the improvements ofσaare less than 0.001.This indicates that the original MCI medium-band filters are proper for photozcalibration.
Acknowledgments
Y.C.and Y.G.thank Xianmin Meng for helpful discussion.Y.C.and Y.G.acknowledge the support of NSFC-11822305,NSFC-11773031,NSFC-11633004,MOST-2018YFE0120800,MOST-2020SKA0110402,and CAS Interdisciplinary Innovation Team.This work is also supported by the science research grants from the China Manned Space Project with NO.CMSCSST-2021-B01 and CMS-CSST-2021-A01.Z.Y.Z.acknowledges support by the National Natural Science Foundation of China(11773051 and 12022303)and the CAS Pioneer Hundred Talents Program.
 Research in Astronomy and Astrophysics2022年2期
- Research in Astronomy and Astrophysics的其它文章
- The“Bi-drifting”Subpulses of PSR J0815+0939 Observed with the Fivehundred-meter Aperture Spherical Radio Telescope
- Application of Random Forest Regressions on Stellar Parameters of A-type Stars and Feature Extraction*
- Detection of Gamma-Rays from the Protostellar Jet in the HH 80–81 System
- Radio Frequency Interference Mitigation and Statistics in the Spectral Observations of FAST
- Systematic Errors Induced by the Elliptical Power-law model in Galaxy–Galaxy Strong Lens Modeling
- Light Curve Analysis and Period Study of Two Eclipsing Binaries UZ Lyr and BR Cyg