
Prediction of early recurrence of hepatocellular carcinoma after liver transplantation based on computed tomography radiomics nomogram
2022-12-19 08:10:12JingWeiZhoXinShuXioXiChenJiXiongLiuMuQingLiuJuYeHuiJieJingGuiShengWng
Jing-Wei Zho , ,# , Xin Shu ,# , Xio-Xi Chen ,# , Ji-Xiong Liu , Mu-Qing Liu , Ju Ye ,Hui-Jie Jing , Gui-Sheng Wng ,?
aDepartment of Radiology, the Third Medical Center, Chinese PLA General Hospital, The Training Site for Postgraduate of Jinzhou Medical University, Beijing 100 039, China
bDepartmentof Radiology,the ThirdMedical Center, Chinese PLA General Hospital, Beijing 10 0 039,China
cMedical School of ChinesePLA, Beijing 100853, China
dDepartmentof Radiology,the Second Affiliated Hospital of Harbin Medical University,Harbin 150086, China
Keywords:Radiomics Nomogram Liver transplantation Early recurrence Hepatocellular carcinoma
A B S T R A C T
Introduction
The incidence rate of hepatocellular carcinoma (HCC) ranks sixth in all kinds of cancers worldwide. There are about 780 0 0 0 new cases annually, and half of them are diagnosed in China [ 1 , 2 ].Therefore, it is urgent to improve HCC prevention and treatment to improve the prognosis of HCC patients. Liver transplantation (LT) is one of the most effective treatments for HCC. However, the 5-year recurrent rate of HCC is 20.0%-57.8% [3–6] . Patients’ different clinical conditions are the main reason underlying the significant differences in recurrent rates in various studies [ 7 , 8 ]. Therefore, reasonable control of LT indications is the key to reducing the HCC recurrence rate.
In 1996, Mazzaferro et al. [9] proposed the Milan criteria to select suitable patients for LT. These criteria only included tumor size, numbers, vascular invasion and extrahepatic involvement. Patients who fulfill these criteria have good prognoses after LT. However, the Milan criteria is strict, and many patients who do not meet the criteria can also have good prognoses following LT [ 10 , 11 ]. Strict compliance with the Milan criteria will cause HCC patients to lose the chance of LT. Another issue is that the size and numbers of tumors seen on preoperative imaging may not be completely consistent with the intraoperative findings [12] . Since HCC patient prognosis is significantly affected by recurrence [ 12 , 13 ], preventing and treating recurrence are very important.
Early diagnosis of recurrence is conducive to choosing treatment options and improving prognosis. Previous studies [ 14 , 15 ] reported that microvascular invasion (MVI) and pathological differentiation are related to HCC recurrence in patients who received LT, and MVI or pathological differentiation can be used to predict recurrence. However, MVI or pathological differentiation does not provide information about tumor heterogeneity [16] . It is diffi-cult to comprehensively develop diagnosis and treatment strategies based solely on MVI or pathological differentiation.
Radiomics can transform medical images into high-dimensional features for quantitative evaluation. The features related to the concerned problems (e.g., diagnosis, treatment, prognosis, quantifying tumor heterogeneity, etc.) are analyzed, and the highly correlated features are selected. Machine learning and deep learning algorithms are usually used to train and establish models to quantify tumor heterogeneity in order to predict prognosis, providing promising decision-making tools for clinicians. The present study aimed to develop and validate a nomogram based on radiomics features and clinical factors to improve preoperative prediction of early recurrence in HCC patients after LT.
Patients and methods
Patient selection and follow-up
A total of 151 consecutive HCC patients who underwent LT between December 2013 and July 2019 were enrolled. They were randomly divided into a training cohort (105 cases) and a validation cohort (46 cases). The inclusion criteria were: (i) patients with histologically confirmed HCC, (ii) preoperative contrast-enhanced computed tomography (CT) scans performed within 1 month before LT, and (iii) followed up for at least one year or until recurrence. The exclusion criteria were: (i) no preoperative enhanced CT images, (ii) preoperative identification of extrahepatic metastasis, and (iii) other treatments received before contrast-enhanced CT scans. Early recurrence refers to intrahepatic recurrence or distant metastasis within 1 year after LT. During follow-up, at 1 month and every 3 months after LT, all patients underwent CT or magnetic resonance imaging (MRI) scans, and their alpha-fetoprotein(AFP) levels were measured. Early recurrence was confirmed by CT or MRI with typical imaging manifestations or pathological findings. The endpoint was time to recurrence. Overall, 33 of 151 enrolled patients experienced early recurrence (21 in the training cohort and 12 in the validation cohort).
Clinical factors
Preoperative clinical factors potentially associated with early recurrence were collected, including sex, age, hepatitis B surface antigen (HBsAg), AFP, alanine aminotransferase (ALT), aspartate aminotransferase (AST) and gamma-glutamyl transpeptidase (GGT).The thresholds for AFP ( > 13.6 ng/mL), ALT ( > 40 U/L), AST ( > 40 U/L) and GGT ( > 54 U/L) are consistent with those used in our institution.
CT image acquisition
A 64-Detector Row CT scanner (Discovery CT750 HD, GE Healthcare, Chicago, IL, USA) was used for all patients. The scanning parameters were as follows: tube voltage, 120 kV; tube current, auto;detector collimation, 64 × 0.625 mm; reconstruction slice thickness, 1.25 mm; field of view, 500 × 500 mm; matrix, 512 × 512,slice interval, 5 mm; and slice thickness, 5 mm. After performing an unenhanced scan, the contrast agent (Omnipaque 350, GE Healthcare) was administered through the median cubital vein. The injection flow rate was 3 mL/s. After the injection, the acquisitions of arterial and venous phase images were performed at 25 and 60 s, respectively.
Tumor segmentation and radiomics features extraction
HCC lesions on the 1.25-mm slice thickness images of preoperative enhanced CT in the arterial phase were delineated with 3D slicer software, slice by slice ( Fig. 1 ) . The software’s pyradiomics package was used to extract 1218 features of the delineated images. The features can be divided into four categories: (i) firstorder features, (ii) shape-based features, (iii) texture-based features, and (iv) first-order features and texture features extracted from images filtered by logarithm and wavelet transformation.
Intra- and interclass correlation coefficients (ICCs) were used to evaluate the reproducibility of radiomics features. To calculate the interclass correlation coefficients, two radiologists delineated 20 randomly selected lesions. The interclass correlation coefficients were calculated based on radiomics features extracted from these delineated images. To calculate the intraclass correlation coeffi-cients, the first radiologist delineated the same 20 patients’ lesions after two weeks. The intraclass correlation coefficients were calculated based on radiomics features extracted from the delineated images performed by the first radiologist at different times. The radiomics features with ICCs both > 0.75 were retained for further analyses.
Selection of radiomics features and radiomics signature building
Radiomics features are high-throughput data and therefore, dimension reduction should be performed before signature building to avoid overfitting. Dimension reduction was performed by applying the least absolute shrinkage and selection operator (LASSO) logistic regression based on the radiomics features with ICCs both >0.75 in the training cohort. The optimal lambda value was determined by 10-fold cross-validation. The selected features were multiplied by their coefficients, summed, and finally added with the intercept. The result is the radiomics signature (Rad-score).
Clinical model and nomogram construction
In the training cohort, clinical factors (i.e., sex, age, HBsAg, AFP,ALT, AST, and GGT) were analyzed by univariate analysis. Those withP< 0.05 were included in the multivariate analysis, and clinical factors withP< 0.05 in multivariate analysis were used to construct the clinical model. Finally, the Rad-score was introduced into the clinical model, and the nomogram was established with multivariate logistic regression.
Model assessment
According to the modeling results, the receiver operative characteristic (ROC) curves in the three models were generated, and the areas under the ROC curves (AUCs) were calculated to assess model performance. ROC curves were compared with DeLong tests,andP< 0.05 was considered statistically significant. Optimal cutoff values were determined by the Youden index, then the sensitivities, specificities, and accuracies of the three models were calculated. Calibration curves were used to assess nomogram calibration. The goodness of fit was evaluated with Hosmer-Lemeshow tests. The clinical usefulness of the three models was assessed by decision curve analysis (DCA).
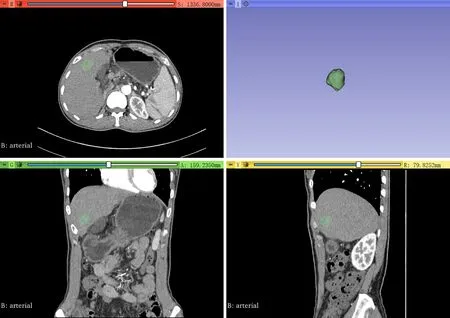
Fig. 1. The delineation process.
Statistical analysis
Statistical analyses were carried out using R software (version:4.0.3, https://www.r-project.org/ ). Chi-square or Fisher’s exact test was used for categorical variables. Mann-WhitneyUtest was used for continuous variables. The “irr” package was used to calculate ICCs. The “rms” package was utilized to perform multivariate logistic analysis and plot the nomogram and calibration curves. LASSO logistic regression on high-dimensional data was performed using the “glmnet” package. ROC curves were plotted using the “pROC”and “ggplot2” packages. The “generalhoslem” package was utilized for Hosmer-Lemeshow test. The "rmda" package was used to plot decision curves.
Results
Clinical factors of the patient
The clinical factors of the training and validation cohorts were shown in Table 1 . There were no significant differences in sex, age,HBsAg, AFP, ALT, AST or GGT both the two cohorts (P> 0.05). The results of univariate analysis of patients with and without early recurrence in the training and validation cohorts were shown in Table 1 . AFP, AST and GGT were significantly different between non-early recurrence and early recurrence groups in the training cohort (P< 0.05).
Selection of radiomics features and radiomics signature building
There were 1099 radiomics features with ICCs > 0.75 included for dimension reduction. Finally, 13 radiomics features were selected ( Fig. 2 ). The formula for the Rad-score calculation is provided in supplementary materials. In the training cohort, the Radscores of patients with and without early recurrence were -0.662(-1.662, 0.338) and -1.733 (-2.303, -1.163), respectively. In the validation cohort, the corresponding values were -0.746 (-1.722, 0.230)and -1.750 (-2.140, -1.360). The Rad-score was significantly different between patients with early recurrence and those without early recurrence in the training cohort (P< 0.001) and validation cohort (P< 0.001).
Clinical model and nomogram construction
The multivariate analysis included AFP, AST and GGT withP<0.05 in univariate analysis. ThePvalue of AST was 0.191, but those of AFP and GGT were still < 0.05, so these two variables were integrated into the clinical model. The odds ratios (ORs) of AFP and GGT in the clinical model were shown in Table 2 . In nomogram construction, thePvalues of AFP, GGT, and Rad-score were all <0.05 after introducing the Rad-score into the clinical model, indicating that all three were independent risk factors for early recurrence ( Fig. 3 ). The ORs of AFP, GGT, and Rad-score in the nomogram model were shown in Table 2 .
Model assessment
The generated ROC curves were shown in Fig. 4 . In the training cohort, the AUCs of the radiomics signature, clinical model, and nomogram were 0.864, 0.747, and 0.882, respectively ( Fig. 4 A). The corresponding AUCs in the validation cohort were 0.848, 0.735, and 0.917 ( Fig. 4 B). The accuracies, sensitivities, and specificities were shown in Table 3 . After adding the radiomics signature, the performance of the clinical model was significantly improved in the training cohort (from 0.747 to 0.882;P= 0.045) and validation cohort (from 0.735 to 0.917;P= 0.047). These results demonstrated that the radiomics signature improved the performance of the clinical model in predicting early recurrence.
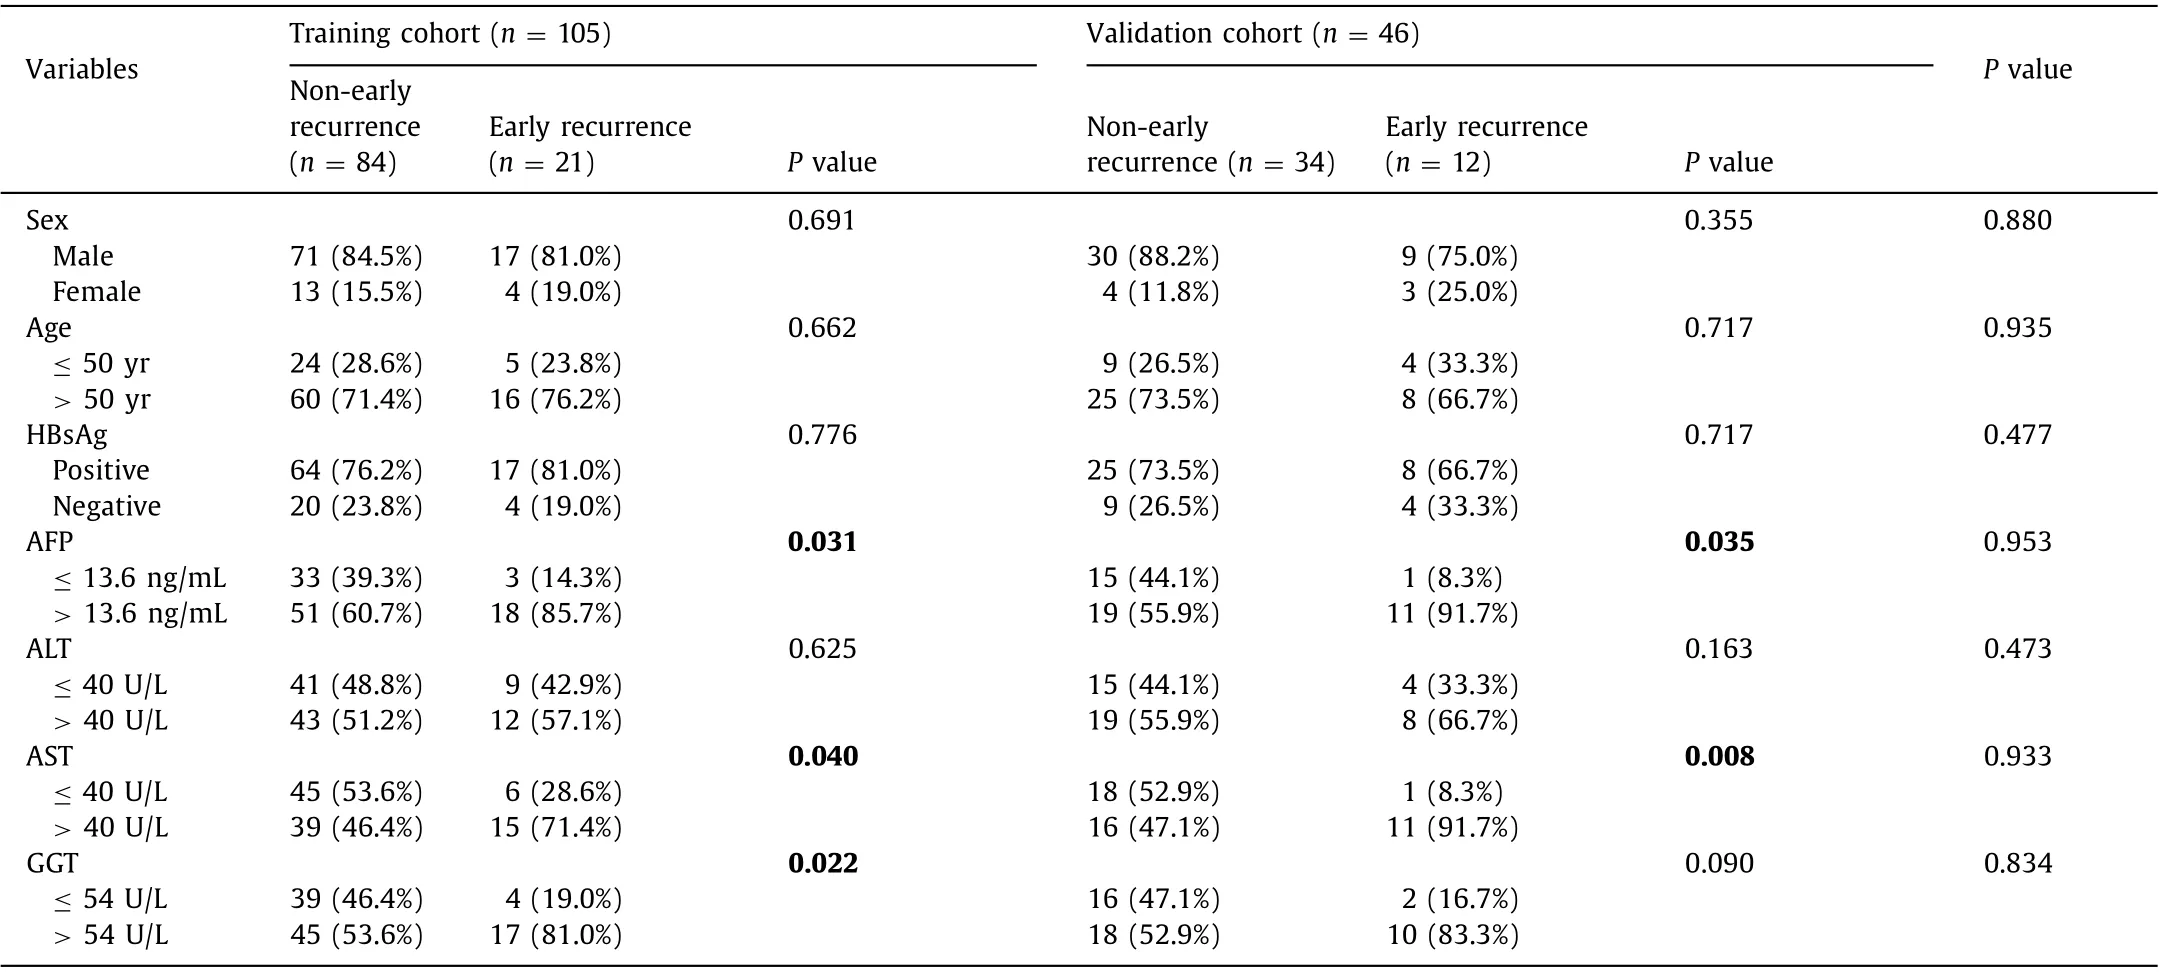
Table 1 Clinical factors.
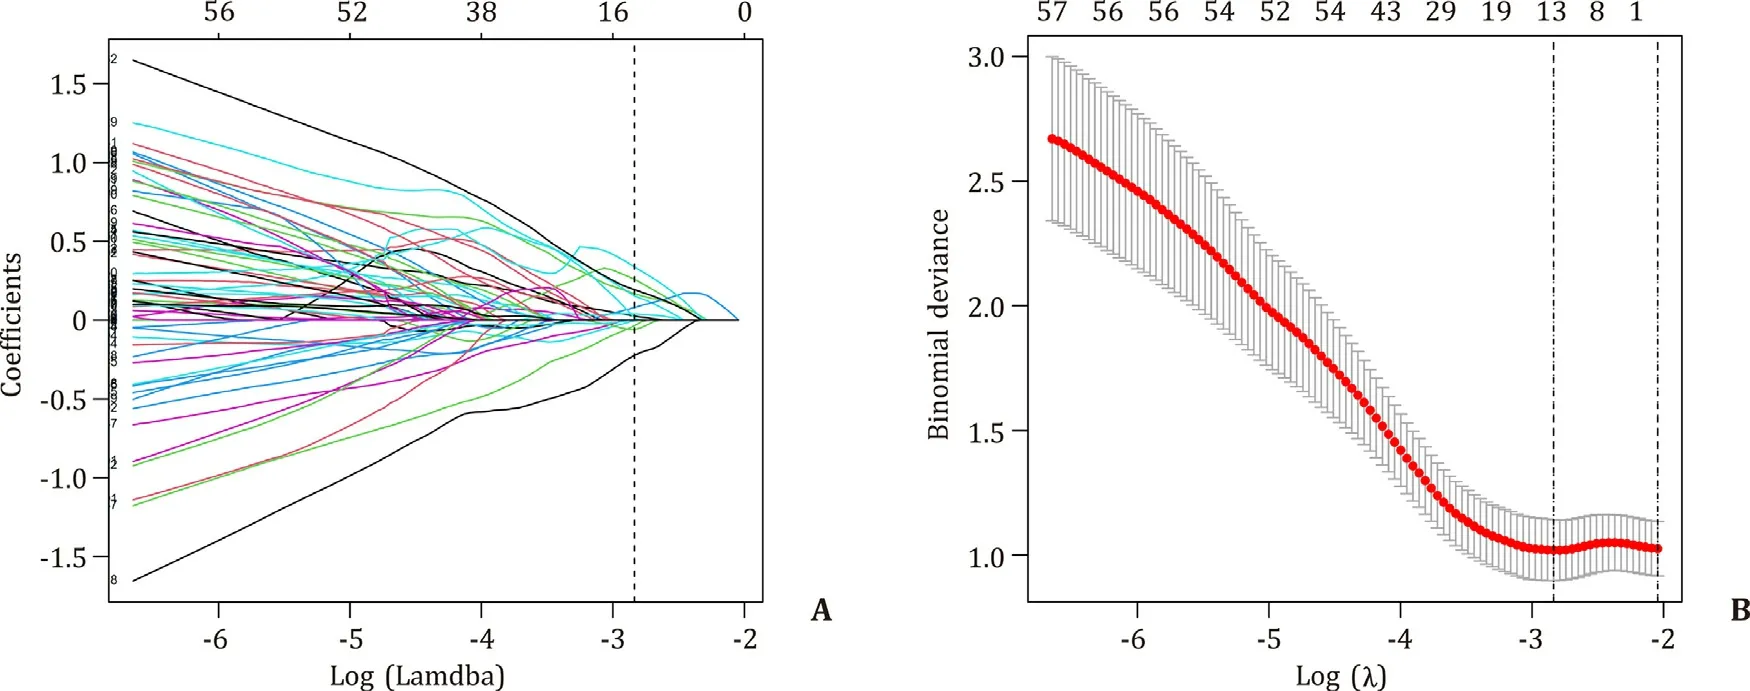
Fig. 2. Selection of radiomics features. A: LASSO coefficient profiles of the 1099 radiomics features. B: Selection of the lambda in the LASSO model. Log (Lambda) = -2.835(Lambda = 0.059) was selected as optimal lambda value through 10-fold cross-validation.
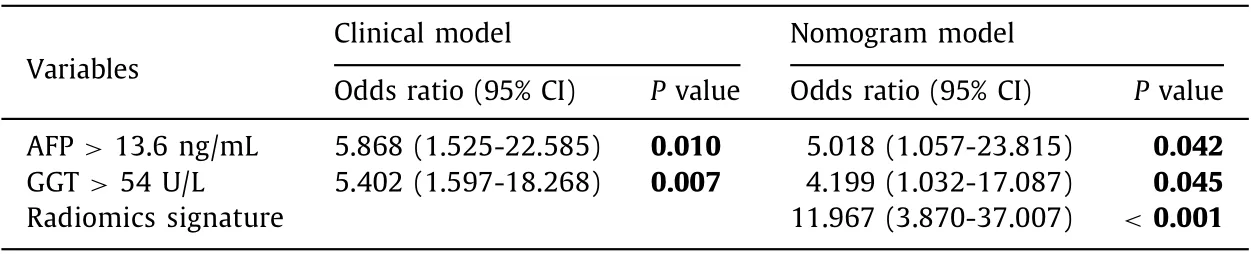
Table 2 Multivariate analysis results.
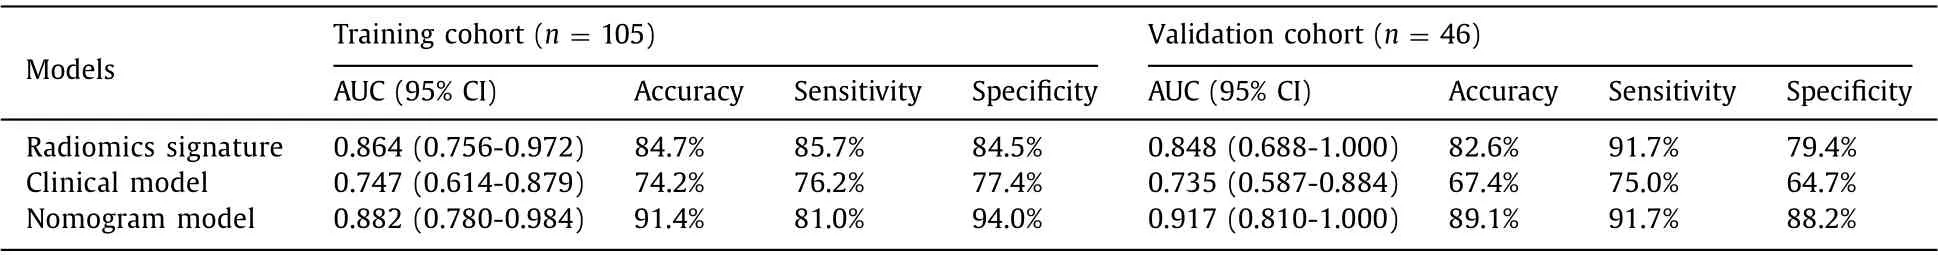
Table 3 Model performance.
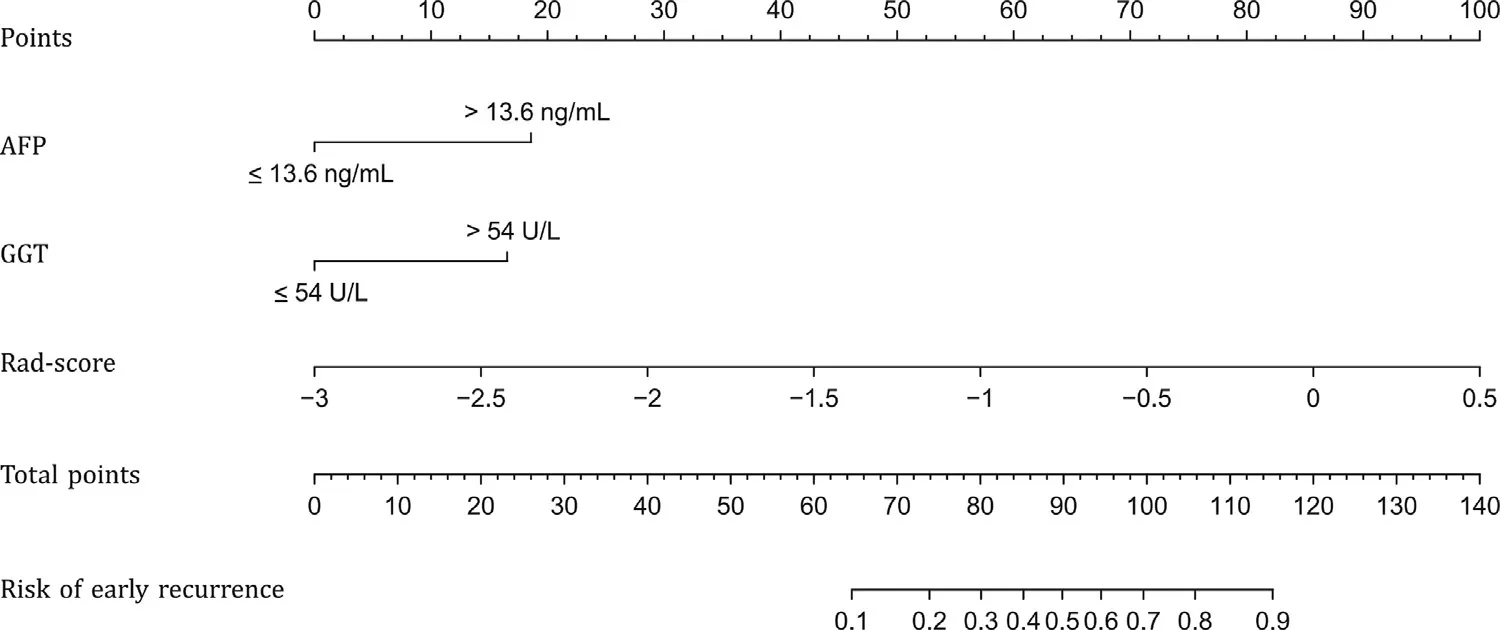
Fig. 3. Nomogram constructed with AFP, GGT and Rad-score. AFP: alpha-fetoprotein; GGT: gamma-glutamyl transpeptidase; Rad-score: radiomics signature.
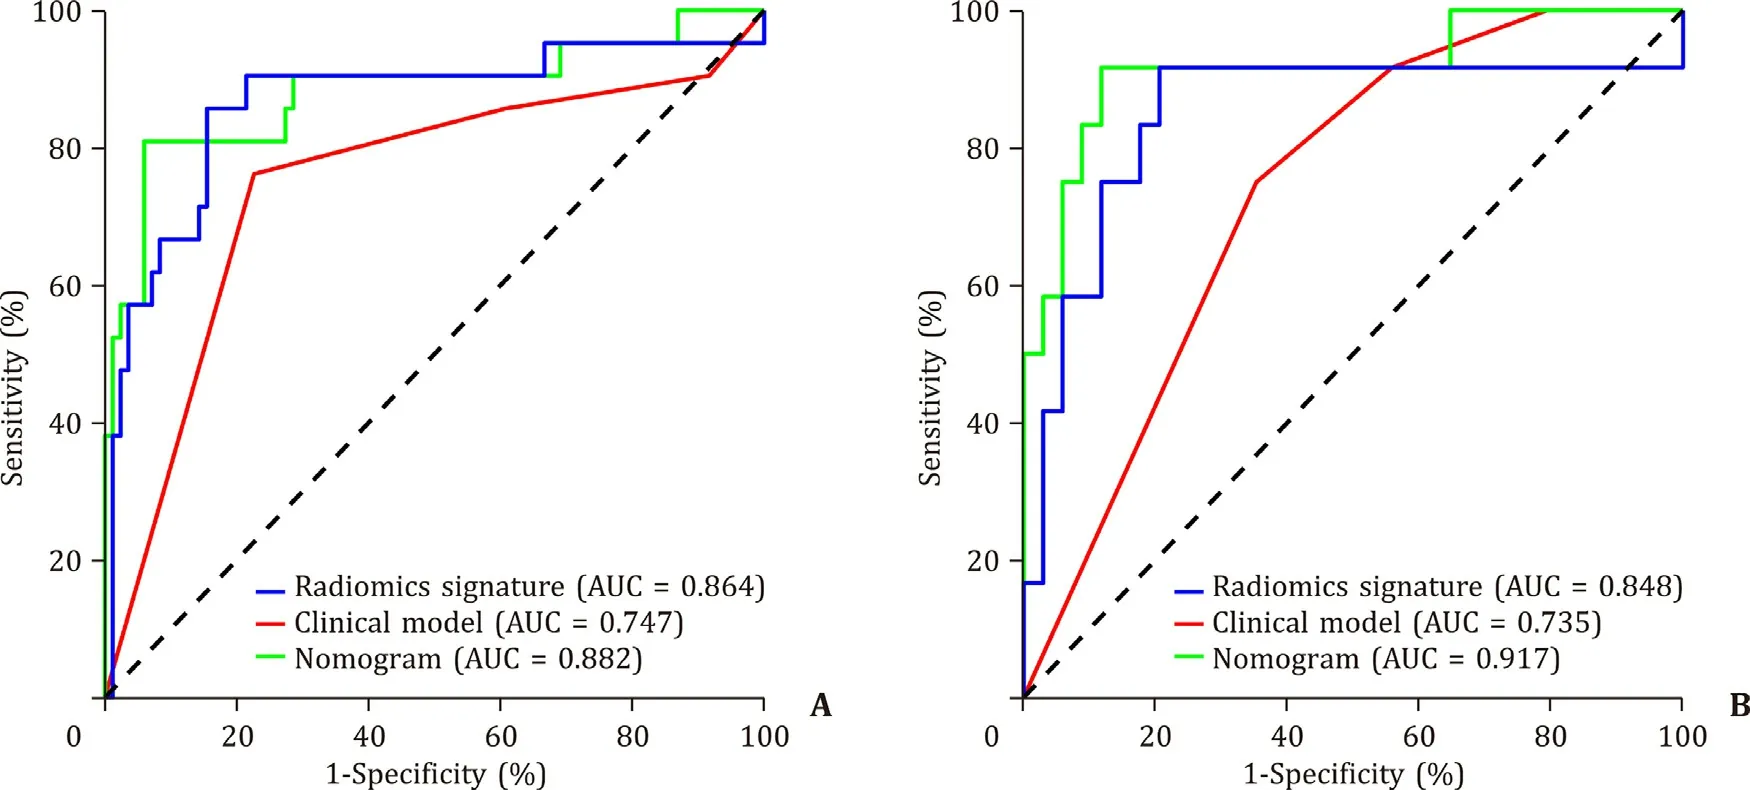
Fig. 4. The receiver operating characteristics (ROCs) of the three models in the training ( A ) and validation ( B ) cohorts. AUC: area under the ROC curve.
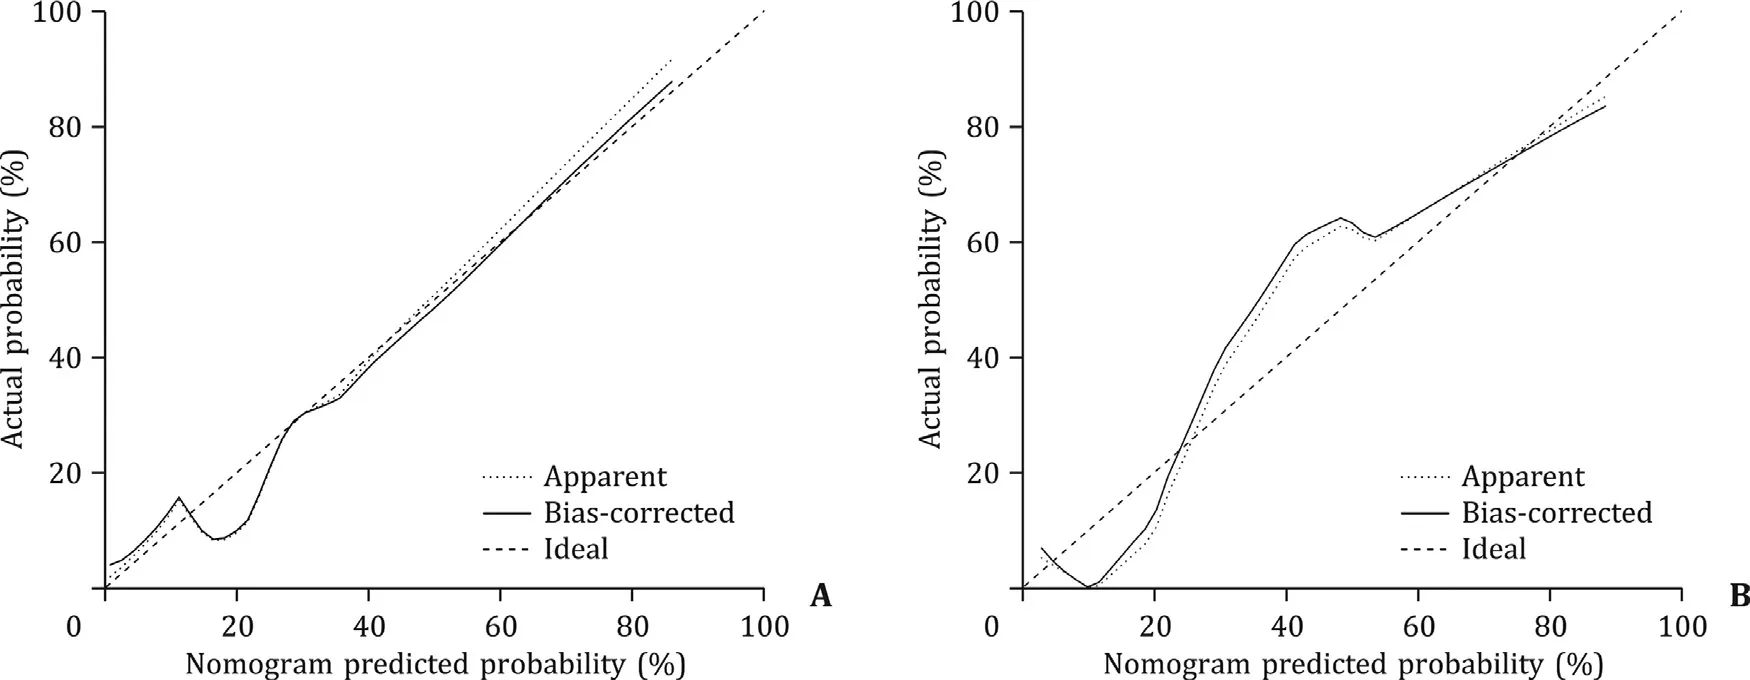
Fig. 5. Calibration curves of the nomogram for the training ( A ) and validation ( B ) cohorts. The closer the solid line is fit to the diagonal dotted line, the better the nomogram calibration will be.
The nomogram calibration curves were shown in Fig. 5 . We observed high consistency between the actual and predicted probabilities. Hosmer-Lemeshow testing confirmed that the nomogram showed good calibration in the training (P= 0.138) and validation(P= 0.396) cohorts.
The decision curves of the three models were shown in Fig. 6 .When the threshold probability was within 0.06-1, the nomogram model had a higher net benefit rate than the clinical model, the“intervene all patients” strategy, and the “non-intervention” strategy.
Discussion
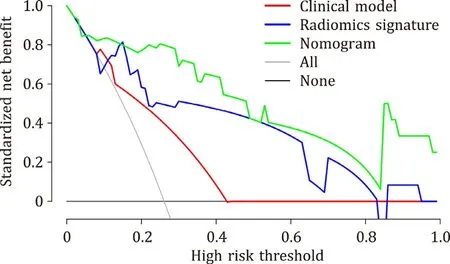
Fig. 6. Decision curve analysis for the three models in the validation cohort. The gray line is based on the assumption that all patients experienced early recurrence.The red, blue, and green lines represent the clinical model, radiomics signature, and nomogram, respectively; the black line is based on the assumption that none of the patients experienced early recurrence. With threshold probability in the range of 0.06-1, the nomogram model had a higher net benefit rate than the clinical model,the “intervene all patients” strategy, and the “non-intervention” strategy.
In this study, we developed and validated a radiomics signature incorporating 13 radiomics features extracted from enhanced CT images to predict early recurrence in HCC patients after LT. Our results showed that the radiomics signature was an independent risk factor for early recurrence. Then, we combined it with AFP and GGT to establish a nomogram. This nomogram yielded AUCs of 0.882 and 0.917 in the training and validation cohorts, respectively.These findings demonstrated that the nomogram noninvasively and effectively assessed the risk of early recurrence with better clinical usefulness than the clinical model.
Previous studies [17–20] have shown that MVI, tumor diameter,differentiation, and AFP are essential factors affecting HCC recurrence after LT. However, solid tumors are heterogeneous on imaging, and these indicators are not sufficient to reflect the overall biological characteristics of the tumors, which negatively impacts clinical decision-making. Radiomics offers the advantage of detecting the whole tumor, which can provide heterogeneity information and improve the accuracy of clinical decision-making [ 21 , 22 ]. Radiomics can analyze various tumor images and then predict patient prognosis. A study on pancreatic cancer prognosis found that a model based on the Brennan score, carbohydrate antigen 19-9 level, and image features showed excellent performance, with a concordance index of 0.74 [23] . Although studies with larger sample sizes are needed to verify their results, applying radiomics to predict the prognosis of patients with pancreatic cancer is promising. Radiomics features also have potential value in distinguishing histopathological grades and the differential diagnosis of benign and malignant tumors. Sun et al. [24] established a radiomics signature based on the features of the corticomedullary and nephrographic phases to accurately differentiate high-grade from lowgrade clear cell renal cell carcinoma. Some studies [ 25 , 26 ] reported that radiomics models have potential clinical value in the differential diagnosis of renal tumors. Others [27–29] demonstrated that radiomics could predict HCC recurrence after hepatectomy. A multicenter study concluded that a model based on radiomics features maintained relatively stable prediction performance in different institutions, which supports the potential of radiomics to be widely used in various centers [29] .
In this study, we selected 13 features to construct a radiomics signature to predict early recurrence in HCC patients. The selected features include first-order features and texture-based features. As a first-order feature,log.sigma.5.0.mm.3D_firstorder_Skewness measures the asymmetric distribution of gray level values about the average gray level value. Lower log.sigma.5.0.mm.3D_firstorder_Skewness indicates a greater part of the nodule with a higher gray level value than the mean gray level value of the whole nodule, which means that a greater part of the nodule was hyper-enhanced. Another first-order feature is wavelet.HLH_firstorder_Mean which is the average gray level value within the nodule. Higher wavelet.HLH_firstorder_Mean indicates a higher degree of enhancement. These may potentially reflect increased arterial blood supply, which reflects the angiogenesis of HCC. Increasing arterial blood supply is related to increasing grade of malignancy of the nodules [30] . Moreover, angiogenesis is related to the progression and metastasis of HCC [31] . These may be the reason why they are related to recurrence. Among the selected texturebased features, wavelet.HHL_glrlm_ShortRunEmphasis measures the distribution of short run lengths, with a greater value indicative of shorter run lengths and more fine textural textures.Log.sigma.1.0.mm.3D_glszm_LargeAreaLowGrayLevelEmphasis measures the proportion in the image of the joint distribution of larger size zones with lower gray-level values.Wavelet.LHH_gldm_LargeDependenceHighGrayLevelEmphasis measures the joint distribution of large dependence with higher graylevel values. Wavelet-LHL_glrlm_ShortRunHighGrayLevelEmphasis measures the joint distribution of shorter run lengths with higher gray-level values. These texture-based features describe the heterogeneous enhancement of tumors, potentially reflecting the heterogeneity of HCC. Tumor heterogeneity plays an important role in tumor aggressiveness and prognosis [32] . Therefore, these texture-based features can potentially predict the recurrence of HCC. In the training and validation cohorts, the AUCs of the radiomics signature were 0.864 and 0.848, respectively, indicating satisfactory predicative performance. After uni- and multivariate analyses of clinical factors, AFP and GGT were integrated into the clinical model as independent risk factors. The AUCs of the clinical model were 0.747 and 0.735 in the training and validation cohorts, respectively. The AFP level is elevated in about 60% of HCC patients [33] . It is not reliable to diagnose HCC based on AFP alone, but it is associated with patient prognosis. One group found that AFP level was negatively related to HCC patient survival after LT [33] . Others demonstrated that AFP is related to HCC recurrence after LT [ 34 , 35 ], which is consistent with the results of our study. We found that GGT was also associated with early recurrence after LT, similar to another publication showing that GGT is related to HCC recurrence [36] . After the Rad-score was introduced into the clinical model, the nomogram based on the 13 selected features, AFP, and GGT was constructed by logistic regression. The nomogram is convenient and straightforward, and the probability of early recurrence can be obtained by entering the corresponding Rad-score and AFP and GGT levels of each patient.The AUCs of the nomogram were 0.882 and 0.917 in the training and validation cohorts, respectively, which were significantly better than those of the clinical model. In the training cohort, the AUC improved from 0.747 to 0.882, and in the validation cohort,the AUC increased from 0.735 to 0.917. These results indicated that the Rad-score significantly improved the predictive performance of clinical models. In previous studies, predictive performance was improved when a nomogram constructed based on radiomics was combined with other models, which is similar to our results [37–39] .
The calibration curve of the nomogram showed good calibration. With a threshold probability in the range of 0.06-1, the nomogram model had a higher net benefit rate than the clinical model,the “intervene all patients” strategy, and the “non-intervention”strategy. Thus, the nomogram has higher clinical utility. It also has more advantages in the discrimination and calibration of predicting early recurrence in HCC patients. Nomogram model provides a more accurate and objective reference for clinicians to predict early recurrence after LT and help clinicians make appropriate decisions.
There are some limitations in this study. Firstly, this was a single-center study with a small number of patients, and larger cohort and multicenter investigations are needed to verify our results. Secondly, the delineated images were all acquired with one scanner (Discovery CT750 HD). More types should be used to evaluate the reproducibility of radiomics features from different scanners. Thirdly, due to the epidemiology of HCC in China, most patients in our cohort were infected with hepatitis B virus. This may affect the application of our findings to a broader range of patients. Finally, this was a retrospective study with unavoidable bias.Therefore, further prospective studies should be performed to verify our results.
In conclusion, the radiomics signature based on preoperative enhanced CT images obtained in the arterial phase can be used to predict early recurrence in patients with HCC after LT. The nomogram model combining AFP, GGT, and the radiomics signature significantly improved the predictive performance of the clinical model. The nomogram has high calibration, can accurately predict early recurrence probability, and provide a decision-making tool for clinicians.
Acknowledgments
None.
CRediT authorship contribution statement
Jing-Wei Zhao: Data curation, Formal analysis, Writing – original draft. Xin Shu: Investigation, Visualization, Writing – original draft. Xiao-Xia Chen: Methodology, Project administration, Writing – review & editing. Jia-Xiong Liu: Software. Mu-Qing Liu: Validation. Ju Ye: Resources. Hui-Jie Jiang: Conceptualization, Writing – review & editing. Gui-Sheng Wang: Conceptualization, Funding acquisition, Supervision, Writing – review & editing.
Funding
This study was supported by grants from the National Key Research and Development Program of China ( 2019YFC0118104 ),the National Natural Science Foundation of China ( 82001808 ), the Beijing Natural Science Foundation (7222319), the Beijing Municipal Science & Technology Commission (Z2110 0 0 02921047) and the Capital’s Clinical Applied Research Project (Z18110 0 0 01718013).
Ethical approval
The study was approved by the Medical Ethics Committee of the Third Medical Center of Chinese PLA General Hospital (KY2021-020). All study procedures were carried out in accordance with theDeclarationofHelsinki.
Competing interest
No benefits in any form have been received or will be received from a commercial party related directly or indirectly to the subject of this article.
Supplementary materials
Supplementary material associated with this article can be found, in the online version, at doi: 10.1016/j.hbpd.2022.05.013 .
 Hepatobiliary & Pancreatic Diseases International2022年6期
- Hepatobiliary & Pancreatic Diseases International的其它文章
- YAP activates pancreatic stellate cells and enhances pancreatic fibrosi s
- Combined analysis of imaging tumor capsule with imaging tumor size guides the width of resection margin for solitary hepatocellular carcinoma
- Complications of modern pancreaticoduodenectomy: A systematic review and meta-analysis
- Technical aspects in pancreaticoduodenectomy and therapeutic strategies for pancreatic cancer: History, current status, and future perspectives
- Contrast-enhanced ultrasound predicts microvascular invasion in patients with hepatocellular carcinoma
- Safety and immunogenicity of COVID-19 vaccination among liver transplant recipients in China