
Monitoring vegetation drought in the nine major river basins of China based on a new developed Vegetation Drought Condition Index
2023-12-22 11:09:56ZHAOLiliLILushengLIYanbinZHONGHuayuZHANGFangZHUJunzhenDINGYibo
Journal of Arid Land 2023年12期
ZHAO Lili, LI Lusheng*, LI Yanbin, ZHONG Huayu, ZHANG Fang, ZHU Junzhen,DING Yibo
1 School of Water Conservancy, North China University of Water Resources and Electric Power, Zhengzhou 450046, China;
2 College of Water Conservancy and Hydropower Engineering, Hohai University, Nanjing 210098, China;
3 University International College, Macau University of Science and Technology, Macao 999078, China;
4 Yellow River Engineering Consulting Co., Ltd., Zhengzhou 450003, China
Abstract: The effect of global climate change on vegetation growth is variable.Timely and effective monitoring of vegetation drought is crucial for understanding its dynamics and mitigation, and even regional protection of ecological environments.In this study, we constructed a new drought index (i.e.,Vegetation Drought Condition Index (VDCI)) based on precipitation, potential evapotranspiration, soil moisture and Normalized Difference Vegetation Index (NDVI) data, to monitor vegetation drought in the nine major river basins (including the Songhua River and Liaohe River Basin, Haihe River Basin, Yellow River Basin, Huaihe River Basin, Yangtze River Basin, Southeast River Basin, Pearl River Basin, Southwest River Basin and Continental River Basin) in China at 1-month-12-month (T1-T12) time scales.We used the Pearson's correlation coefficients to assess the relationships between the drought indices (the developed VDCI and traditional drought indices including the Standardized Precipitation Evapotranspiration Index(SPEI), Standardized Soil Moisture Index (SSMI) and Self-calibrating Palmer Drought Severity Index(scPDSI)) and the NDVI at T1-T12 time scales, and to estimate and compare the lag times of vegetation response to drought among different drought indices.The results showed that precipitation and potential evapotranspiration have positive and major influences on vegetation in the nine major river basins at T1-T6 time scales.Soil moisture shows a lower degree of negative influence on vegetation in different river basins at multiple time scales.Potential evapotranspiration shows a higher degree of positive influence on vegetation, and it acts as the primary influencing factor with higher area proportion at multiple time scales in different river basins.The VDCI has a stronger relationship with the NDVI in the Songhua River and Liaohe River Basin, Haihe River Basin, Yellow River Basin, Huaihe River Basin and Yangtze River Basin at T1-T4 time scales.In general, the VDCI is more sensitive (with shorter lag time of vegetation response to drought) than the traditional drought indices (SPEI, scPDSI and SSMI) in monitoring vegetation drought,and thus it could be applied to monitor short-term vegetation drought.The VDCI developed in the study can reveal the law of unclear mechanisms between vegetation and climate, and can be applied in other fields of vegetation drought monitoring with complex mechanisms.
Keywords: vegetation drought; Vegetation Drought Condition Index (VDCI); Normalized Difference Vegetation Index (NDVI); vegetation dynamics; climate change; China
1 Introduction
Droughts are often characterized by recurring climatic extremes that affect water resources(Gleeson et al., 2012), ecosystems (Nguyen et al., 2021), agricultural production (Rhee et al.,2010) and socio-economic development (Mishra and Singh, 2010; Shi et al., 2018; Shao et al.,2019; Zhang et al., 2019a).In the context of climate change and global warming, droughts are becoming more frequent and severe due to the uncertain of water supply and demand in recent decades (Gleeson et al., 2012; Shi et al., 2020; Pascolini-Campbell et al., 2021).Vegetation is an important link in regulating water, atmosphere and land (Zhou et al., 2020a).Vegetation growth can reflect the health of ecosystems and the change of climate (Fensholt and Proud, 2012; Xu et al., 2018; Shi et al., 2020).Moreover, vegetation dynamics are impacted by local climate and water conditions, as well as drought (Asadi Zarch et al., 2015; Zhu et al., 2019; Ding et al., 2020;Zhang et al., 2021).Therefore, indicators of climate and water conditions perform better in monitoring vegetation drought and forecasting vegetation dynamics, contributing to understanding the principles of vegetation dynamics (Vicente-Serrano et al., 2013) and reflecting climate change (Leng et al., 2015).
Vegetation is usually defined as a general term for the plants and their communities covering surfaces (Ye et al., 2021).Surface vegetation generally includes forest biomes, grassland biomes,cropland biomes and desert biomes (Fensholt and Proud, 2012; Xu et al., 2018; Ye et al., 2021).Satellite remote sensing is an efficient and reliable method used to monitor vegetation dynamics(He et al., 2017; Jeong et al., 2017).At present, the Global Inventory Modeling and Mapping Studies (GIMMS) Normalized Difference Vegetation Index (NDVI) dataset produced by Advanced Very High Resolution Radiometer (AVHRR) sensors (Zeng et al., 2013; Ye et al., 2021)has the longest time series of vegetation observation data (Pinzon and Tucker, 2014; He et al.,2017).Although the GIMMS NDVI product has a lower spatial resolution than the Moderate-resolution Imaging Spectroradiomete (MODIS) NDVI product, its long time series of vegetation observation data can provide high reliability in monitoring the dynamics of vegetation and droughts (Fan and Liu, 2016; Ding et al., 2020; Zhou et al., 2020a).
Vegetation growth is mainly impacted by precipitation (Zhou et al., 2020a), potential evapotranspiration (Zhao and Ma, 2021) and soil moisture (Luo et al., 2021).These three parameters can not only independently influence vegetation dynamics (Gong et al., 2021) but also work together to reflect agricultural drought and influence vegetation dynamics (Ding et al.,2020).The extent and mechanism of vegetation response to meteorological factors are also related to regional climatic characteristics (Xu et al., 2018; Sahaar and Niemann, 2020).Therefore, at present, we may not fully understand the relationship between vegetation dynamics and meteorological factors in different climatic regions (Zhou et al., 2020b).However, many studies have explained that historical statistical data could reveal regular patterns of unclear mechanisms between vegetation dynamics and climate change (Guo et al., 2019a; Shi et al., 2020;Di Curzio et al., 2021; Gong et al., 2021; Waqas et al., 2021).Moreover, historical statistical data can be used to correct model parameters to construct a reliable drought index based on local conditions (Guo et al., 2019b; Gong et al., 2021).
Traditional drought indices, such as the Standardized Precipitation Evapotranspiration index(SPEI) (Yao et al., 2020), Standardized Precipitation Index (SPI) (Asadi Zarch et al., 2015) and Self-calibrating Palmer Drought Severity Index (scPDSI) (Zhang et al., 2019b), are used to investigate drought dynamics based on historical statistical data.However, both the SPEI and SPI only consider meteorological factors (precipitation and potential evapotranspiration) to investigate drought (Asadi Zarch et al., 2015; Ma et al., 2020), and the scPDSI could not be used to investigate drought on multiple time scales due to its computational structure framework (Wells et al., 2004).Vegetation drought is influenced by many factors, so it is not reliable to analyze vegetation drought based on a single variable or short time scale (Bento et al., 2018).Thus, a new multivariable vegetation drought index based on historical statistical data should be considered.
Previous studies divided climatic regions based on drought and vegetation changes (Xu et al.,2018; Ding et al., 2021a).However, these regional divisions may not take into account all the characteristics of subregions (Zhou et al., 2021c).In many studies, the basins are regarded as the basic units, such as the optimal allocation of water resources (Lakshmi et al., 2018), flood and drought disaster characteristics (Zhou et al., 2021a), and agricultural and ecological environments (Li et al., 2020).From this perspective, in this study, based on historical statistical data (1982-2015) of precipitation, potential evapotranspiration, soil moisture and NDVI, we developed a new Vegetation Drought Condition Index (VDCI) reflecting the relationship between vegetation and drought, and applied the VDCI in the nine major river basins in China at 1-month-12-month (T1-T12) time scales.We estimated its performance in monitoring vegetation drought using the correlation analysis with the NDVI, and further compared it with the traditional drought indices including the SPEI, scPDSI and Standardized Soil Moisture Index (SSMI).The findings can be used in the early warning and monitoring system of vegetation drought in the future, and provide references for related management planning at the basin scale.
2 Data and methods
2.1 Study area
China is located in East Asia (03°51′-53°33′N(xiāo), 73°29′-135°04′E).The terrain of China is high in the east and low in the west, with roughly three ladder-like distributions (Fig.1a).The first ladder-like region has the highest altitude in China, including the Qinghai-Tibet Plateau; the second ladder-like region has a higher altitude in China and includes the Inner Mongolia Plateau,Loess Plateau, Yun-Gui Plateau, Sichuan Basin, Junggar Basin and Tarim Basin; and the third ladder-like region has the lowest altitude in China, including the Northeast China Plain, North China Plain and Middle-Lower Yangtze Plain.There are nine major river basins in China (Yin et al., 2021), namely the Songhua River and Liaohe River Basin in northeastern China, the Haihe River Basin in eastern China, the Yellow River Basin in northern China, the Huaihe River Basin in eastern China, the Yangtze River Basin in central China, the Southeast River Basin in southeastern China, the Pearl River Basin in southern China, the Southwest River Basin in southwestern China and the Continental River Basin in northwestern China (Fig.1b).
2.2 Data sources
In this study, vegetation dynamics were described using the GIMMS NDVI dataset (1982-2015)(Fensholt and Proud, 2012; Pinzon and Tucker, 2014; Ye et al., 2021).GIMMS NDVI dataset was obtained from the Ecological Forecasting Lab at the NASA Ames Research Center(http://ecocast.arc.nasa.gov/), with the spatial and temporal resolutions of 8 km and 1 month,respectively (Ding et al., 2020).The dataset eliminated the interference of clouds, aerosols, solar altitude angle and bidirectional reflection of ground objects using the maximum value synthesis method (Ye et al., 2021).
Daily meteorological data including precipitation (mm), wind speed (m/s), relative humidity(%), sunshine duration (h) and temperature (°C) (mean temperature, maximum temperature and minimum temperature) during 1982-2015 were obtained from the China Meteorological Data Service Center (http://data.cma.cn), and 826 meteorological stations were employed (Fig.1b).We interpolated meteorological stations using the inverse distance weighting method (Gong et al.,2014) to achieve the same spatial resolution (8 km) with the GMMIS NDVI data.In this study, we calculated potential evapotranspiration by the FAO56 Penman-Monteith method based on meteorological data (Allen et al., 2006; Yang et al., 2021).
The soil moisture dataset (1982-2015) was obtained from the European Space Agency Climate Change Initiative soil moisture version 03.3 product (https://cds.climate.copernicus.eu/), with the spatial and temporal resolutions of 0.25° and 1 month, respectively.We re-projected the soil moisture data based on the geographic coordinate system of World Geodetic System 1984, and resampled the data to 8-km resolution based on the bilinear interpolation method to confirm the consistency of spatial resolution with the GMMIS NDVI data.
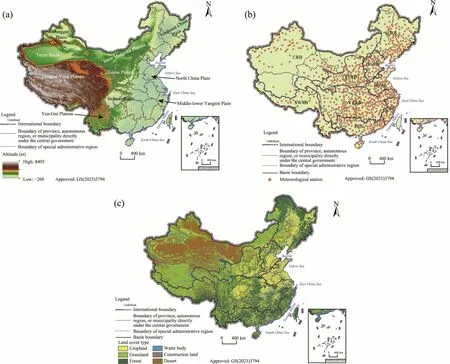
Fig.1 Topographic and geographic zones in China (a), distribution of meteorological stations in the nine major river basins in China (b), and land cover types in the nine major river basins in China in 2020 (c).SLRB, Songhua River and Liaohe River Basin; HARB, Haihe River Basin; YERB, Yellow River Basin; HURB, Huaihe River Basin; YARB, Yangtze River Basin; SERB, Southeast River Basin; PRB, Pearl River Basin; SWRB, Southwest River Basin; CRB, Continental River Basin.
Land cover type data (2000) and climate-vegetation subregion boundaries of China were obtained from the Resource and Environmental Science Data Center(https://www.resdc.cn/Default.aspx).Land cover types included forest, grassland, cropland,water body, construction land and desert (Fig.1c).Climate-vegetation subregions included cold temperate coniferous forest, temperate coniferous and deciduous broad-leaved mixed forest,warm temperate deciduous broad-leaved forest, subtropical evergreen broad-leaved forest,tropical monsoon forest and rainforest, temperate grassland, temperate desert, and alpine vegetation on the Qinghai-Tibet Plateau.
2.3 Methodology
2.3.1 Construction of the Vegetation Drought Condition Index (VDCI)
Precipitation and potential evapotranspiration can alter soil moisture through water intake and output in the process of the hydrological cycle (Dayon et al., 2018).Therefore, in this study, we integrated the three single variables (precipitation, potential evapotranspiration and soil moisture)to estimate the vegetation drought conditions in the nine major river basins in China (Rhee et al.,2010; Guo et al., 2019b).
First, we performed the correlation analysis between each of the three single variables(precipitation, potential evapotranspiration and soil moisture) and the NDVI (Guo et al., 2019b).
The specific equation is given as follows:
whereRxyis the correlation coefficient betweenx(each variable of precipitation, potential evapotranspiration and soil moisture) andy(NDVI);xiis theithvalue (i=1, 2, …,n) in the time series of the variablex;xis the mean value of the time series of variablex;yiis theithvalue in the time series of the NDVI; andyis the mean value of the time series of NDVI.
Second, the performance of the VDCI could be refined by determining the influence weights of the three variables in each grid cell (Guo et al., 2019b).Influence weight can indicate the influence degree of the variable to the NDVI.Influence weights of the three variables(precipitation, potential evapotranspiration, and soil moisture) in each grid cell were calculated using Equations 2-4.The specific equations are given as follows:
wherekP,kPETandkSMare the influence weights of precipitation, potential evapotranspiration and soil moisture, respectively;RP,RPETandRSMare the correlation coefficients of precipitation,potential evapotranspiration and soil moisture with the NDVI, respectively; and the parameter abs represented the absolute value.
Then, precipitation, potential evapotranspiration and soil moisture data were normalized to the dimensionless form in the range of 0-1 (Zeng et al., 2013).The integrated result of the three single variables in each grid cell was determined by Equation 5:
whereWRis the integrated result of the three single variables (precipitation, potential evapotranspiration and soil moisture) in each grid cell; and P (mm), PET (mm) and SM (%) are the values of precipitation, potential evapotranspiration and soil moisture in each grid cell,respectively.
Finally, we used the distribution function to fit theWRof the three single variables to obtain the VDCI (Ding et al., 2021a).Based on the probability plot correlation coefficient method (Heo et al., 2008; Zhou et al., 2020a), we compared and estimated the fitting performance of the gamma and log-logistic distribution functions (Ding et al., 2021b).The gamma distribution function showed a greater fitting performance than the log-logistic distribution function in the fitting results ofWR(Fig.2).Therefore, we used the gamma distribution function (Bouaziz et al., 2021)to fit theWRin this study.
whereg(x) is the gamma distribution function;αandβrepresent the shape and scale parameters,respectively; and Γ(α) is the main function in the gamma distribution.
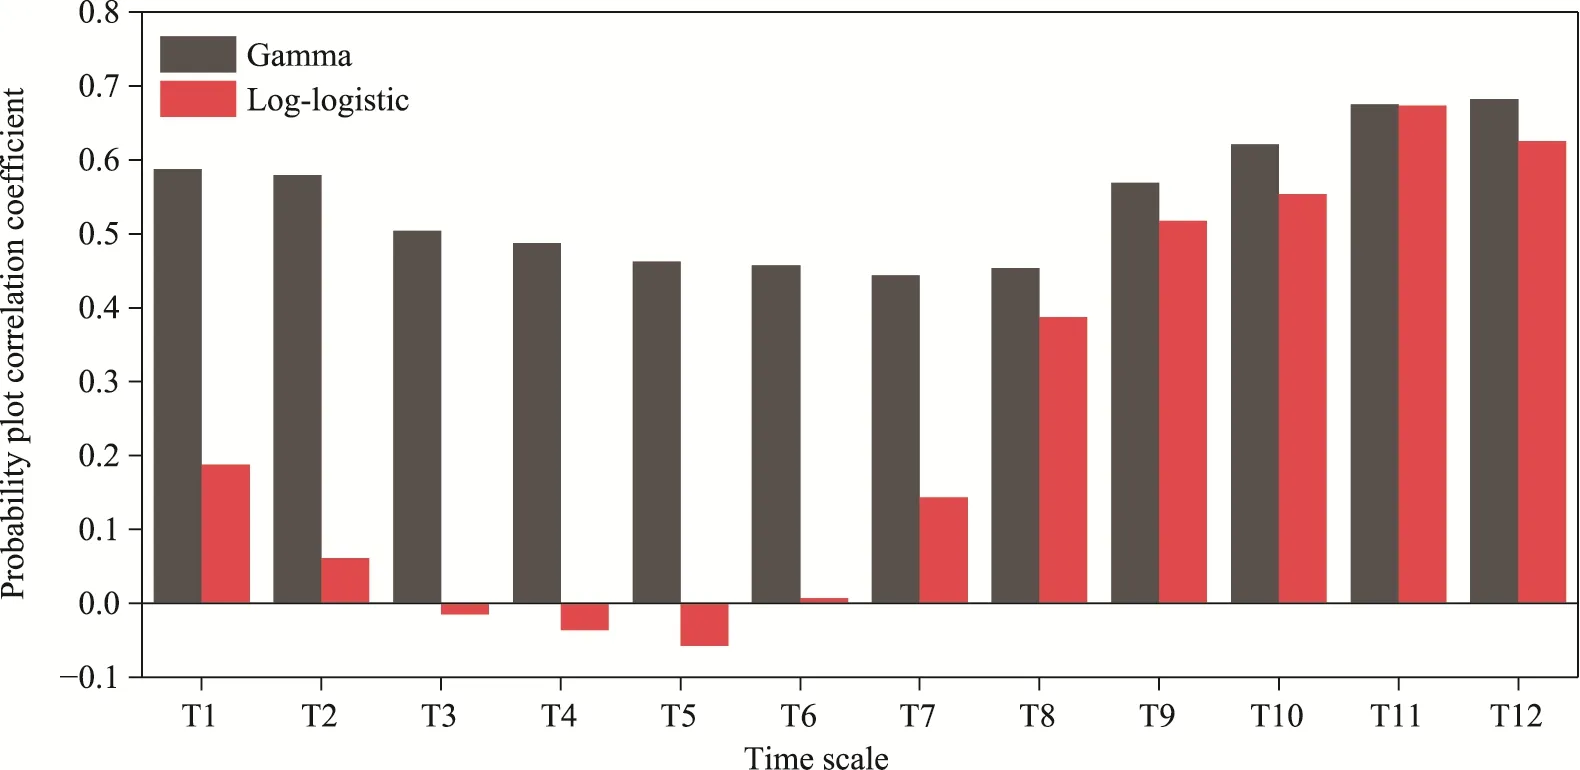
Fig.2 Evaluation of the WR fitting performance of the gamma and log-logistic distribution functions at 1-month-12-month (T1-T12) time scales.WR, the integrated result of precipitation, potential evapotranspiration and soil moisture.
2.3.2 Traditional drought indices
The SPEI, SSMI and scPDSI were applied in this study to compare the performance in monitoring vegetation drought with the VDCI.The SPEI at T1-T12 time scales was calculated using water deficit (precipitation minus potential evapotranspiration) (Xu et al., 2018; Yao et al.,2020; Ding et al., 2021a).The log-logistic probability distribution function was adopted to fit the water deficit series (Asadi Zarch et al., 2015).We calculated the SSMI at T1-T12 time scales by the different mean lengths of soil moisture based on the methods of Wang et al.(2020) and Luo et al.(2021).The standard normal distribution function was used to fit the water deficit series (Wang et al., 2020).The scPDSI at T1-T12 time scales was determined using potential evapotranspiration, precipitation, and soil moisture based on the method of Zhang et al.(2019d),which is usually considered as an agricultural drought monitoring indicator and is used to monitor vegetation drought (Ding et al., 2020).
2.3.3 Correlation analysis between different drought indices and the NDVI
In this study, we used the Pearson's correlation coefficients to estimate the relationship between drought indices and the NDVI.The higher the correlation coefficient is, the better the correlation between drought indices and the NDVI is (Zhang and Zhang, 2019).Moreover, the correlation coefficients were also calculated to estimate the lag times of vegetation response to drought (Guo et al., 2019b).A shorter lag time represented a timelier reflection of vegetation drought (Sattar and Kim, 2018; Guo et al., 2019b).Specifically, we computed the correlation coefficients between drought indices and the NDVI at T1-T12 time scales and obtained the lag times between drought indices (VDCI, SPEI and SSMI) and the NDVI.The time scale with the maximum correlation coefficient was defined as the lag time of vegetation response to drought (Ding et al.,2021b).
3 Results
3.1 Characteristics of the influence weights of precipitation, potential evapotranspiration and soil moisture in different river basins
To investigate the response degrees of vegetation to precipitation, potential evapotranspiration and soil moisture at multiple time scales, we calculated the mean values of the influence weights of precipitation, potential evapotranspiration and soil moisture in different river basins at T1-T12 time scales (Fig.3).In general, the influence weights of potential evapotranspiration and precipitation at T1-T7 time scales were positive in the nine major river basins; while they were negative at T9-T11 time scales.The influence weights of soil moisture at multiple time scales were all negative in the nine major river basins.
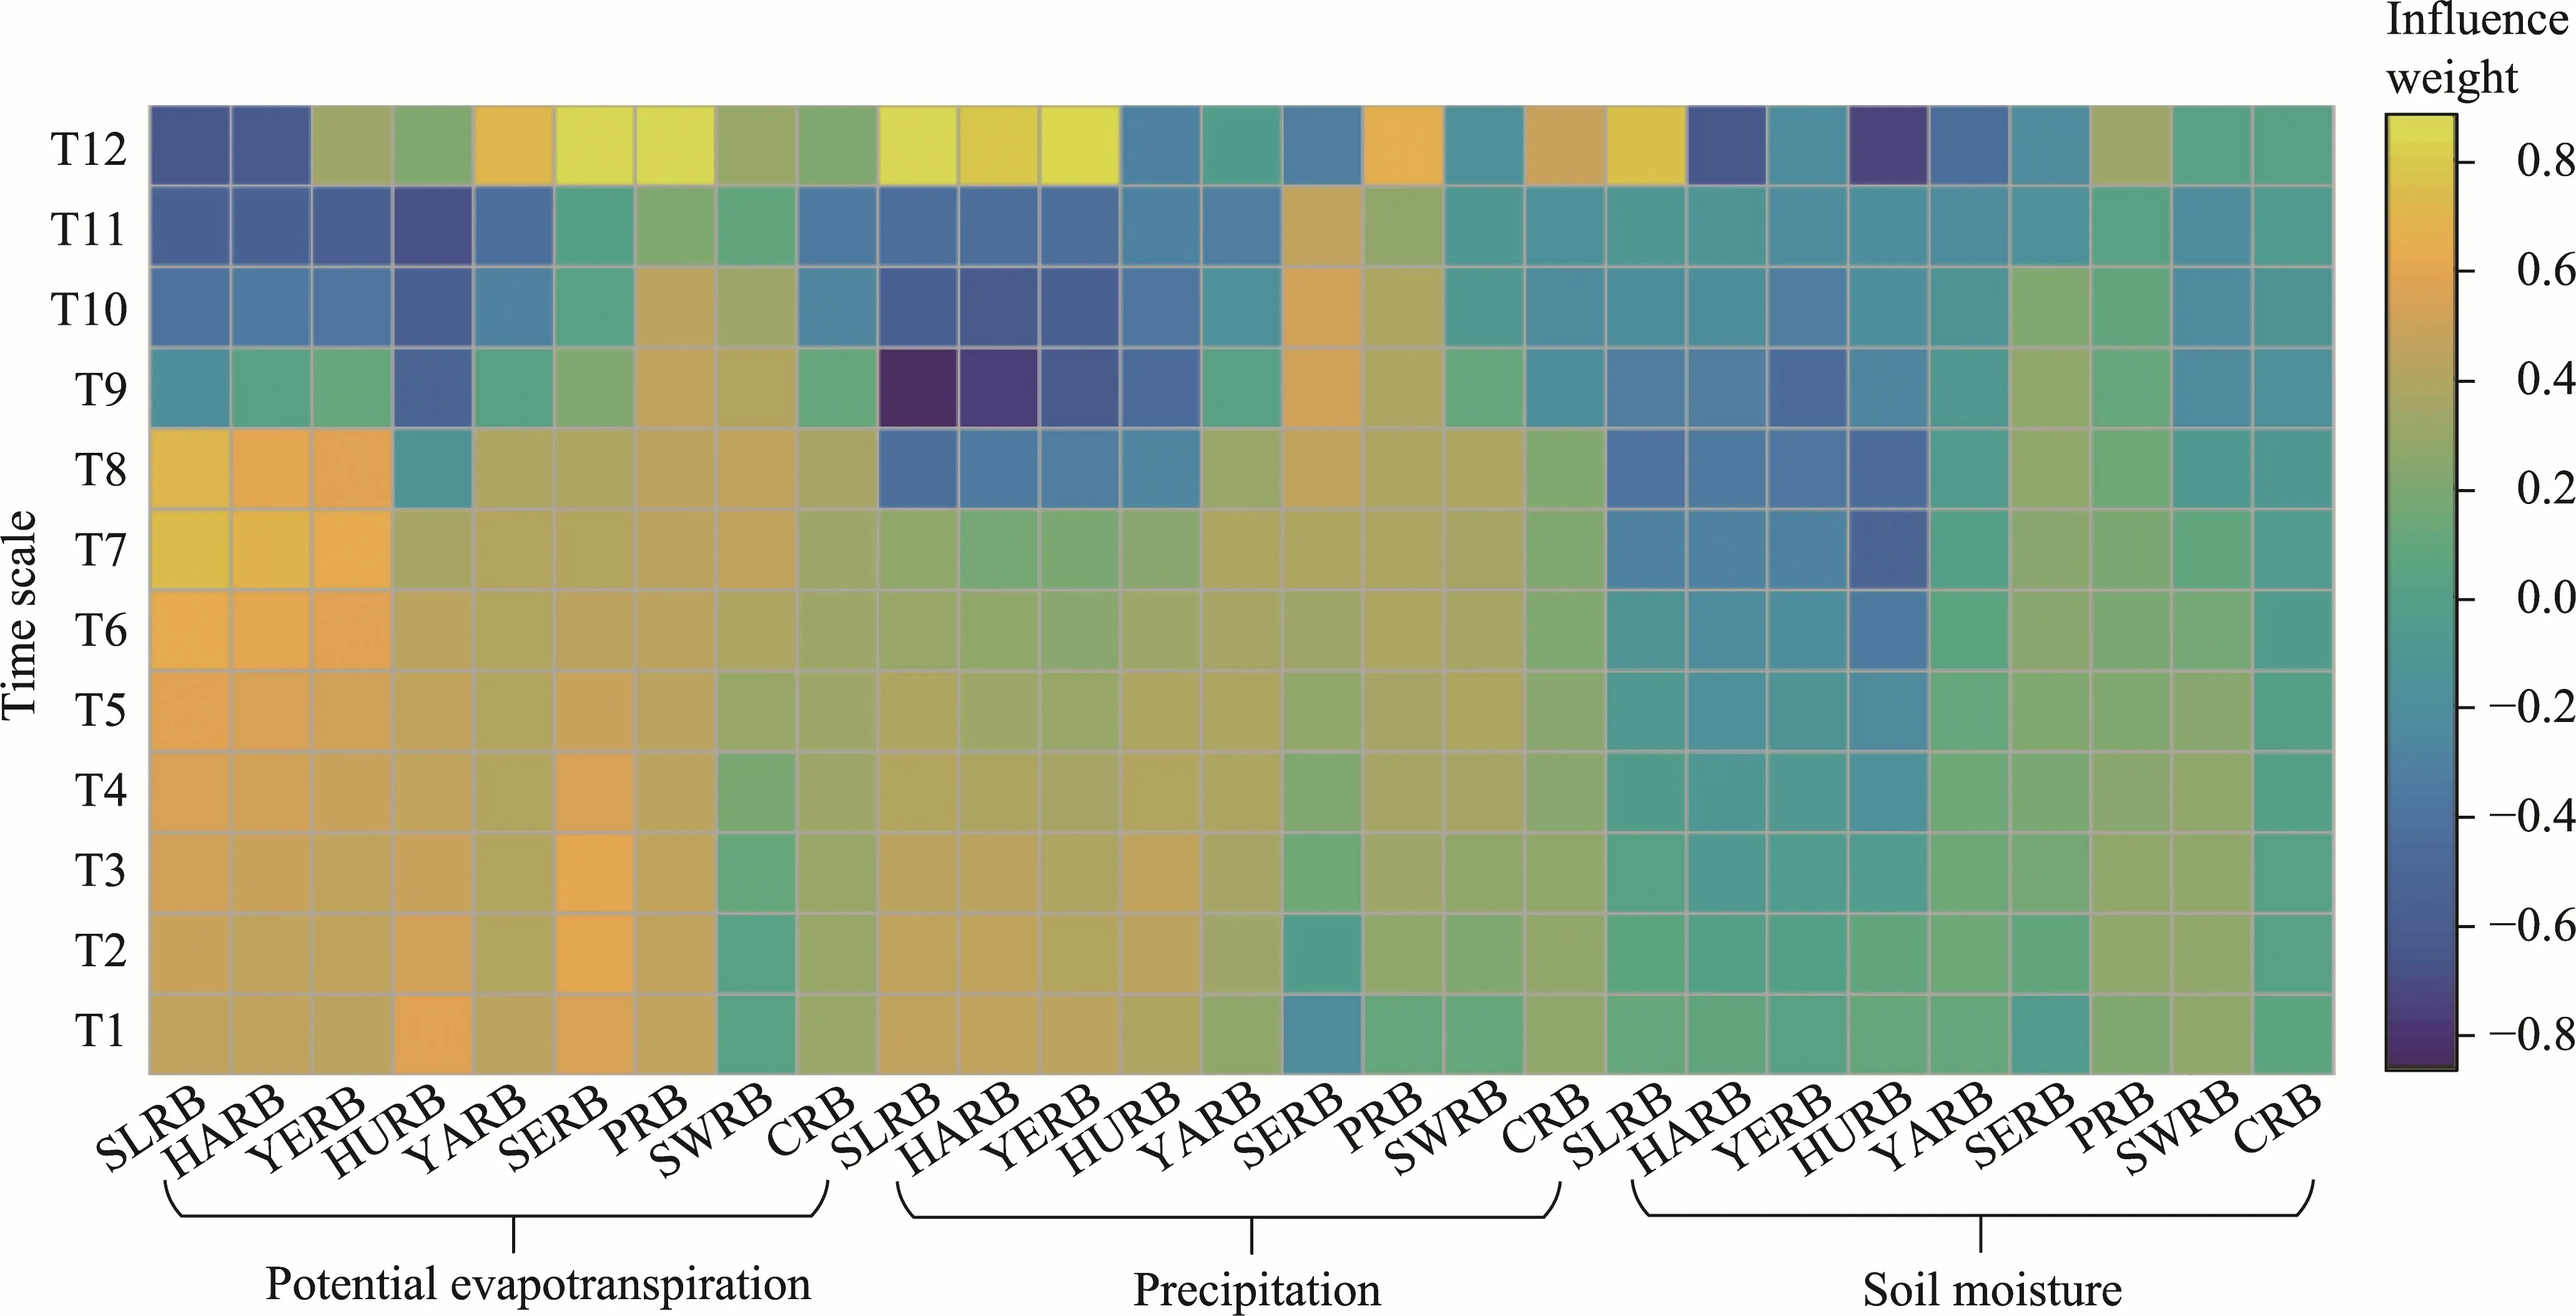
Fig.3 Influence weights of potential evapotranspiration, precipitation and soil moisture in the nine major river basins of China at T1-T12 time scales.SLRB, Songhua River and Liaohe River Basin; HARB, Haihe River Basin; YERB, Yellow River Basin; HURB, Huaihe River Basin; YARB, Yangtze River Basin; SERB, Southeast River Basin; PRB, Pearl River Basin; SWRB, Southwest River Basin; CRB, Continental River Basin.
As shown in Figure 4, the primary influencing factor in different river basins varied at different time scales.Regions with potential evapotranspiration and precipitation as the primary influencing factors showed higher area proportions in the different river basins at multiple time scales, while regions with soil moisture as the primary influencing factor showed higher area proportions in the Songhua River and Liaohe River Basin, Huaihe River Basin and Southwest River Basin at T7, T9 and T12 time scales.
3.2 Comparison of the lag times of vegetation response to different drought indices
We compared the lag times of vegetation response to different drought indices (new drought index(VDCI) and traditional drought indices (SPEI and SSMI)) in China (Fig.5).In general, the VDCI mainly had lag times of 2 and 3 months with the NDVI.The SSMI mainly had a lag time of 4 months with the NDVI, and the SPEI mainly had lag times of 9 and 11 months with the NDVI.Based on the gamma distribution fitting curve, the lag times of vegetation response to drought among different drought indices from short to long time sales were the VDCI, SSMI and SPEI, in which the VDCI showed the shortest lag time.In general, the VDCI and SSMI might be sensitive to short-term drought and more suitable for short-term vegetation drought warnings in China,whereas the SPEI might be sensitive to long-term drought and more suitable for long-term vegetation drought warnings.We also calculated the lag times of vegetation response to drought in different river basins (Fig.6).Specifically, the VDCI had the shortest lag time in most river basins, except for the Southwest River Basin.The SPEI had a relatively longer lag time than the VDCIS and SMI.
3.3 Performance estimation of the VDCI
3.3.1 Performance of the VDCI in monitoring vegetation drought
As shown in Figure 7, the correlation coefficients between the VDCI and NDVI at T1-T7 time scales were higher in the Songhua River and Liaohe River Basin, Haihe River Basin, Yellow
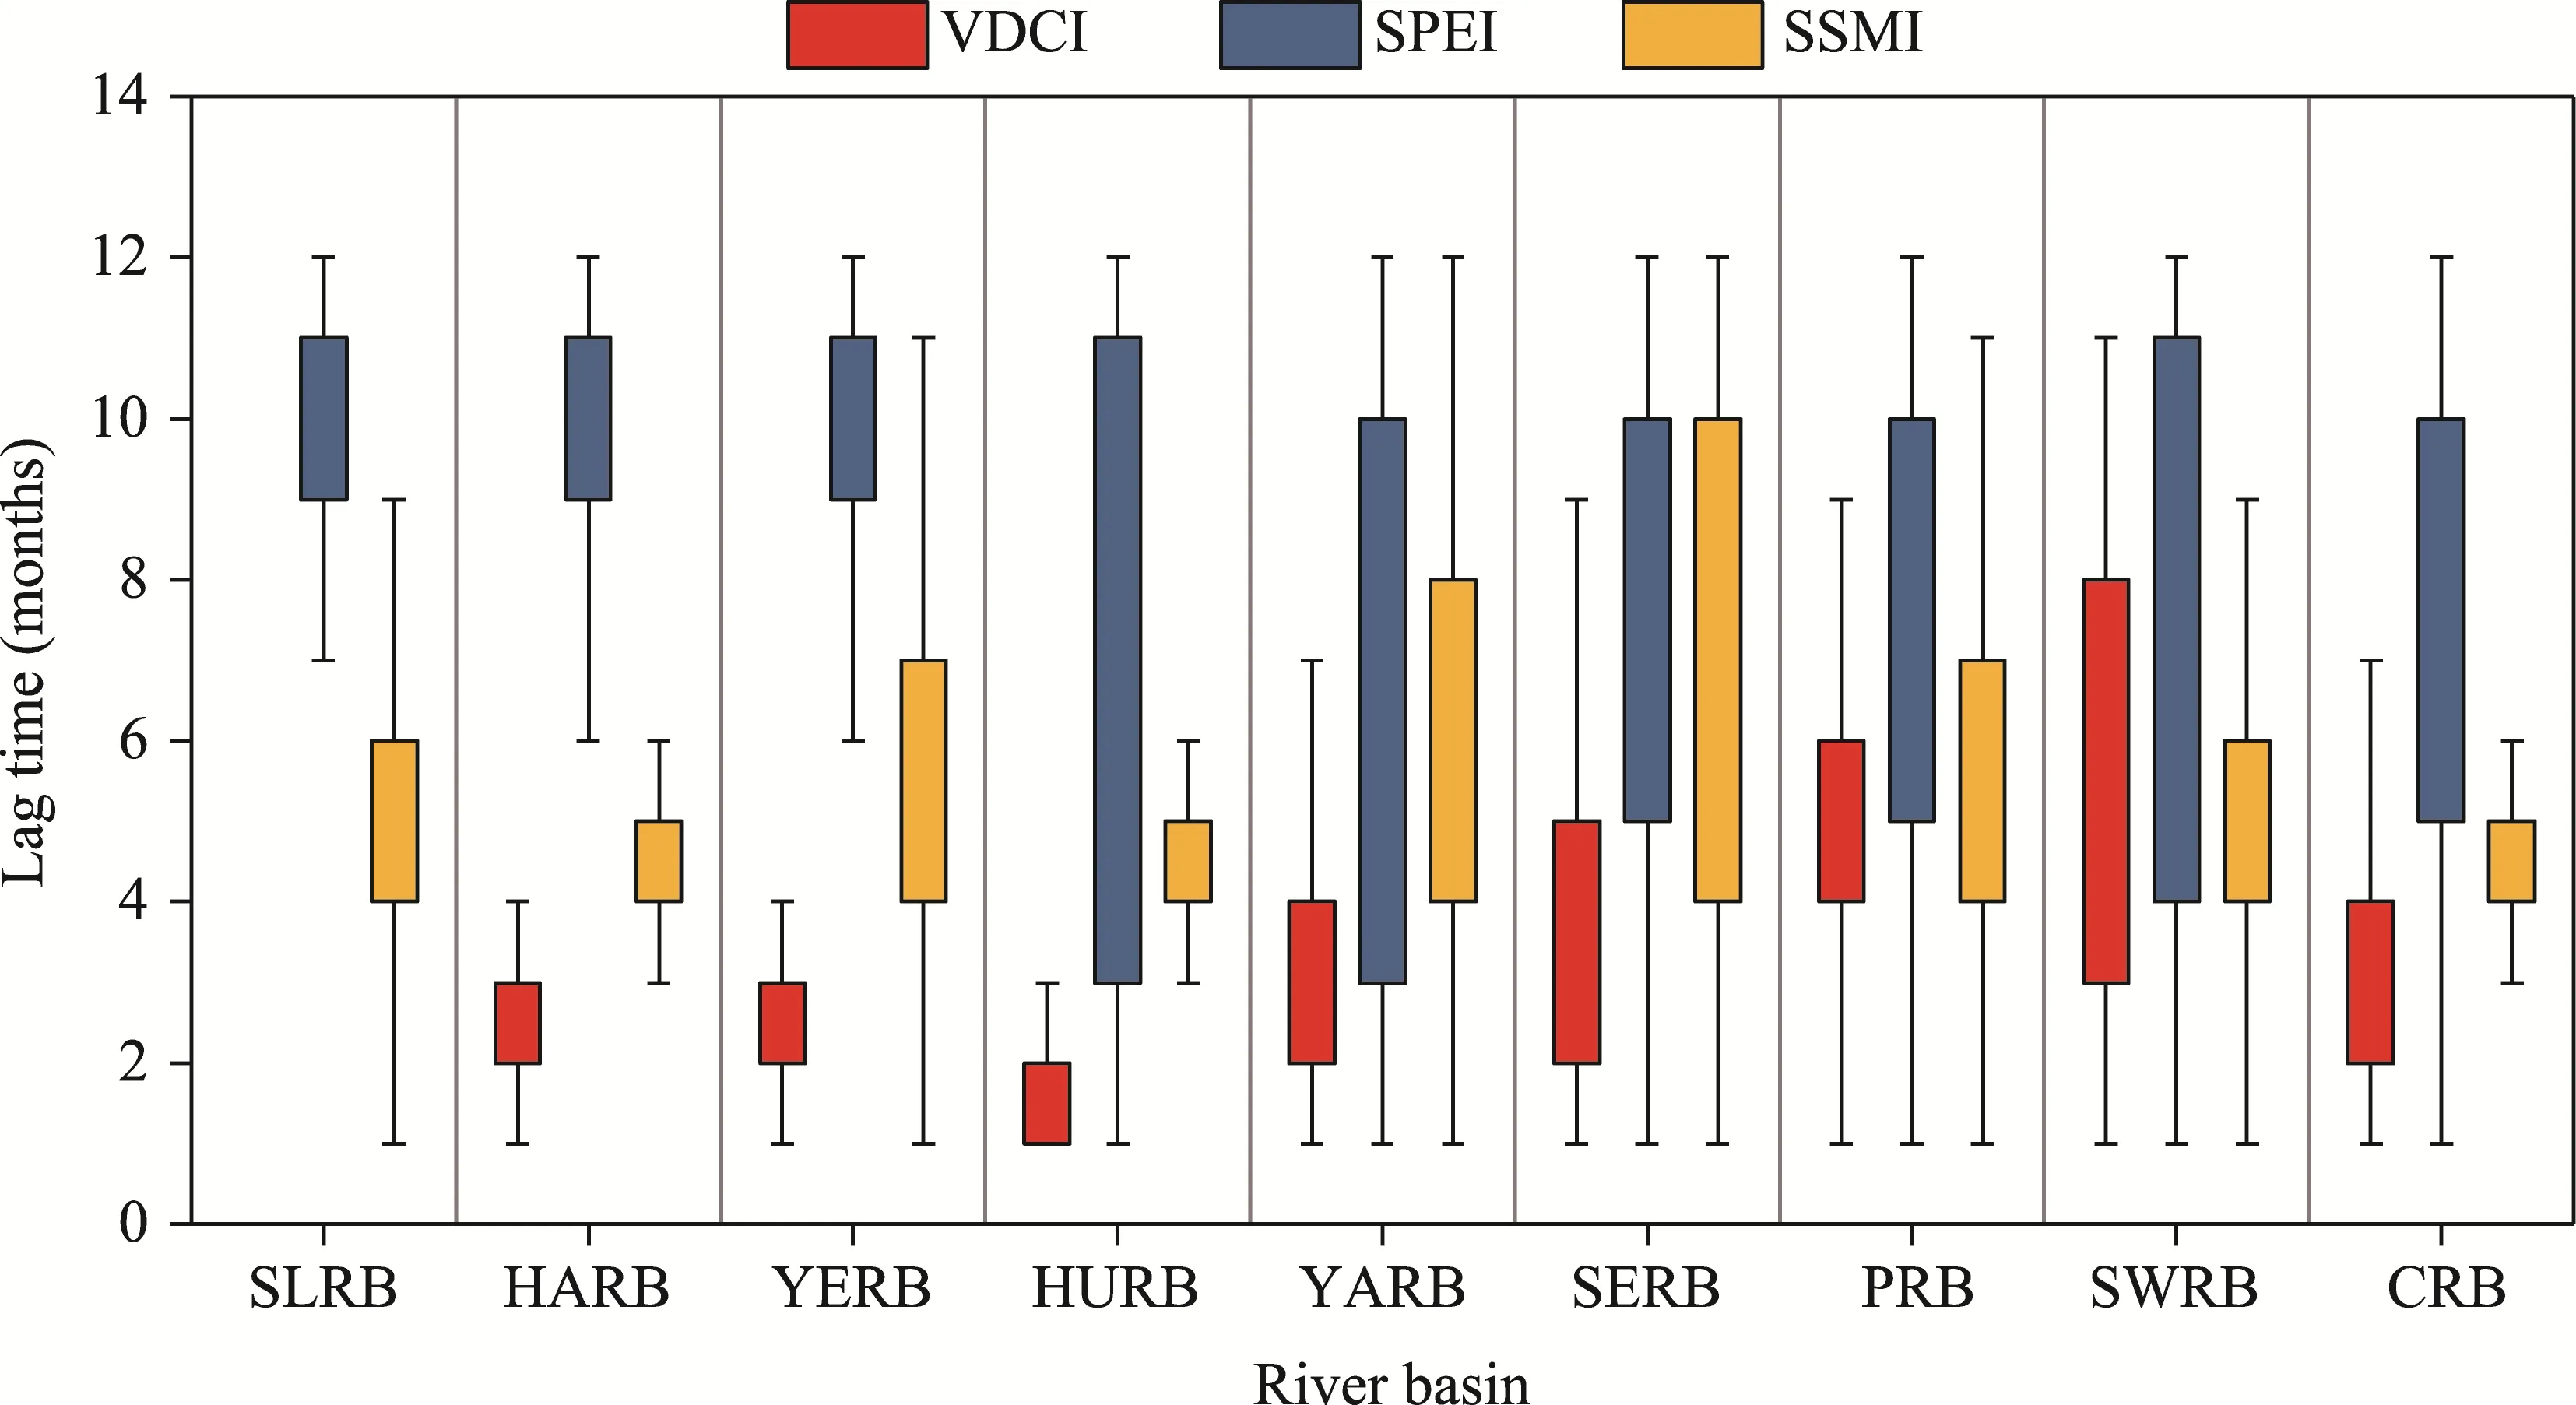
Fig.6 Comparison of the lag times of vegetation (indicated by the NDVI) response to different drought indices(VDCI, SPEI and SSMI) in the nine major river basins.Box boundaries indicate the 25th and 75th percentiles,respectively; whiskers below and above the box indicate the 10th and 90th percentiles, respectively.SLRB,Songhua River and Liaohe River Basin; HARB, Haihe River Basin; YERB, Yellow River Basin; HURB, Huaihe River Basin; YARB, Yangtze River Basin; SERB, Southeast River Basin; PRB, Pearl River Basin; SWRB,Southwest River Basin; CRB, Continental River Basin.
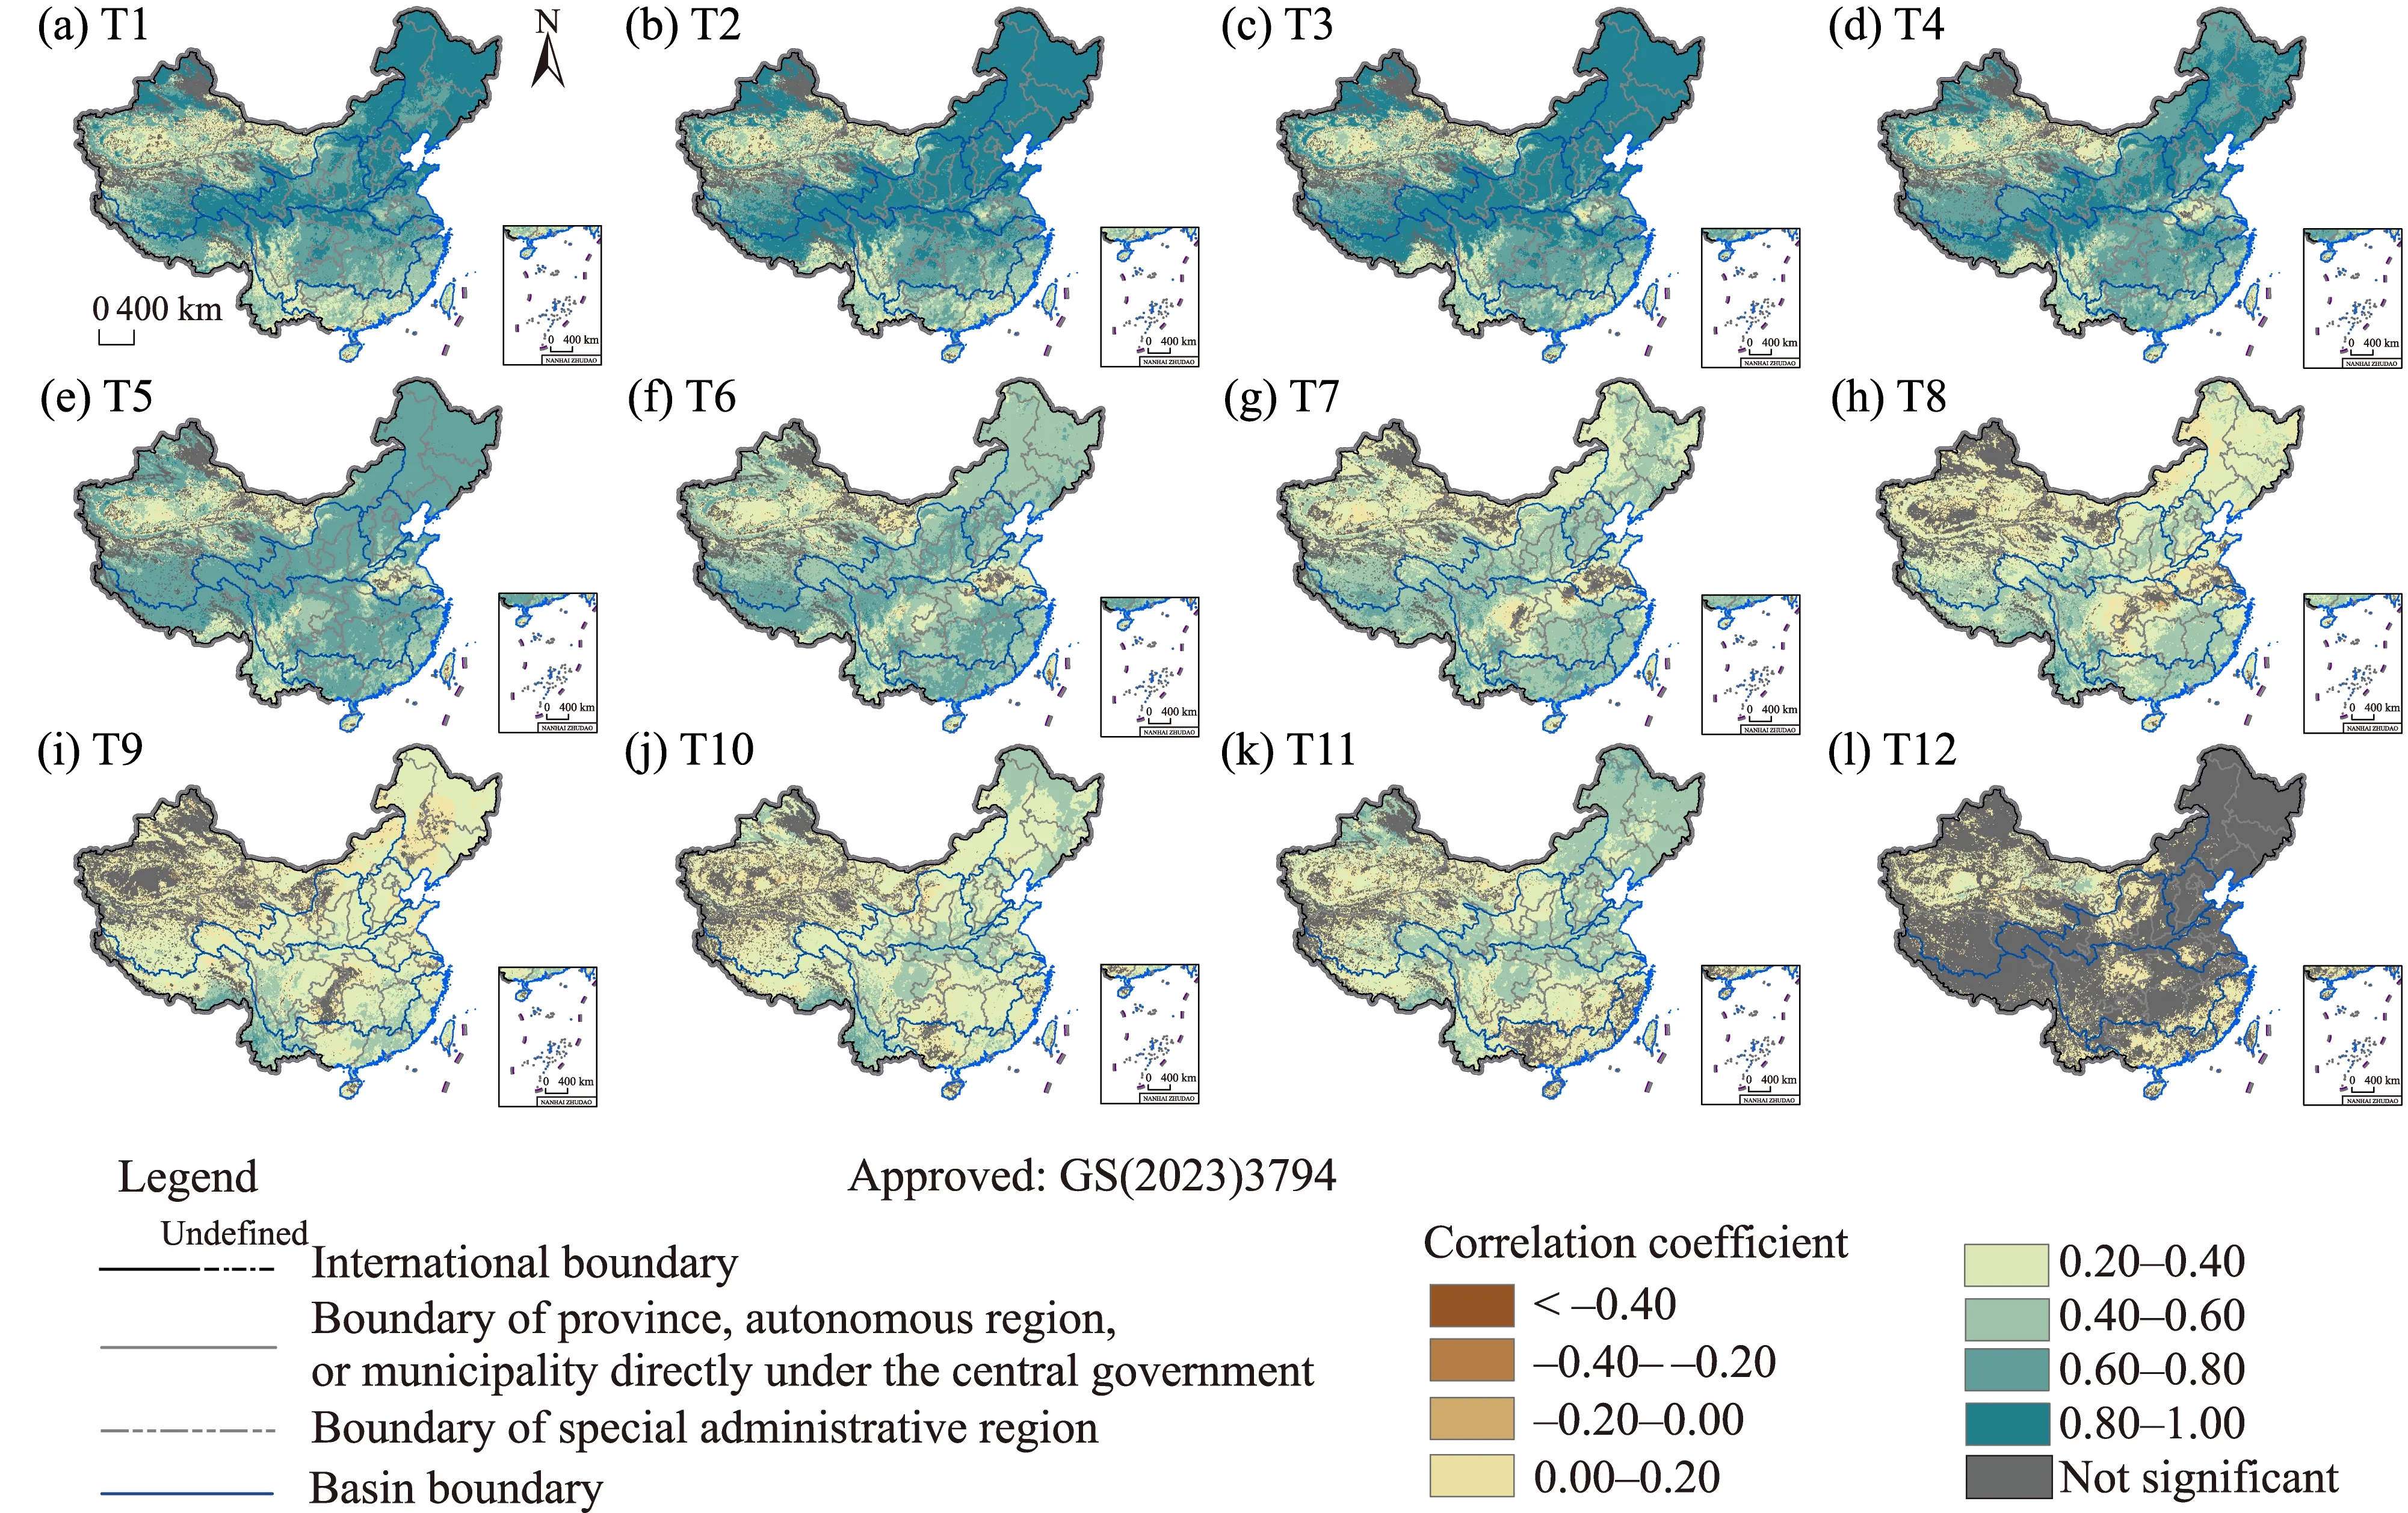
Fig.7 Spatial distribution of the correlation coefficients between the VDCI and NDVI at T1 (a), T2 (b), T3 (c),T4 (d), T5 (e), T6 (f), T7 (g), T8 (h), T9 (i), T10 (j), T11 (k), and T12 (l) time scales."Not significant" indicates that the correlation coefficient did not pass the significance test (P>0.05).
River Basin, Huaihe River Basin, Yangtze River Basin, northern of the Southwest River Basin,and northern of the Continental River Basin.The VDCI indicated high performance in monitoring vegetation drought in the Songhua River and Liaohe River Basin, Haihe River Basin, Yellow River Basin, Huaihe River Basin, Yangtze River Basin, and northern of the Southwest River Basin.However, the VDCI had poor performance in the central of the Continental River Basin.
The correlation coefficients between the VDCI and NDVI at T1-T4 time scales were highest among all the time scales in the nine major river basins (Fig.8).The correlation coefficients in the Songhua River and Liaohe River Basin, Haihe River Basin and Yellow River Basin first increased and then decreased from T1 to T4 time scales, with the values between 0.75 and 0.95.The correlation coefficients in the Huaihe River Basin showed a decreasing trend from T1 to T4 time scales, which mainly fluctuated between 0.40 and 0.90.The correlation coefficients in the Pearl River Basin showed an increasing trend from T1 to T4 time scales, ranging from 0.35 to 0.70.Generally speaking, the correlation coefficients between the VDCI and NDVI showed a decreasing trend from T1 to T12 time scales, and the VDCI showed better performance(correlation coefficients>0.40) at T1-T6 time scales.
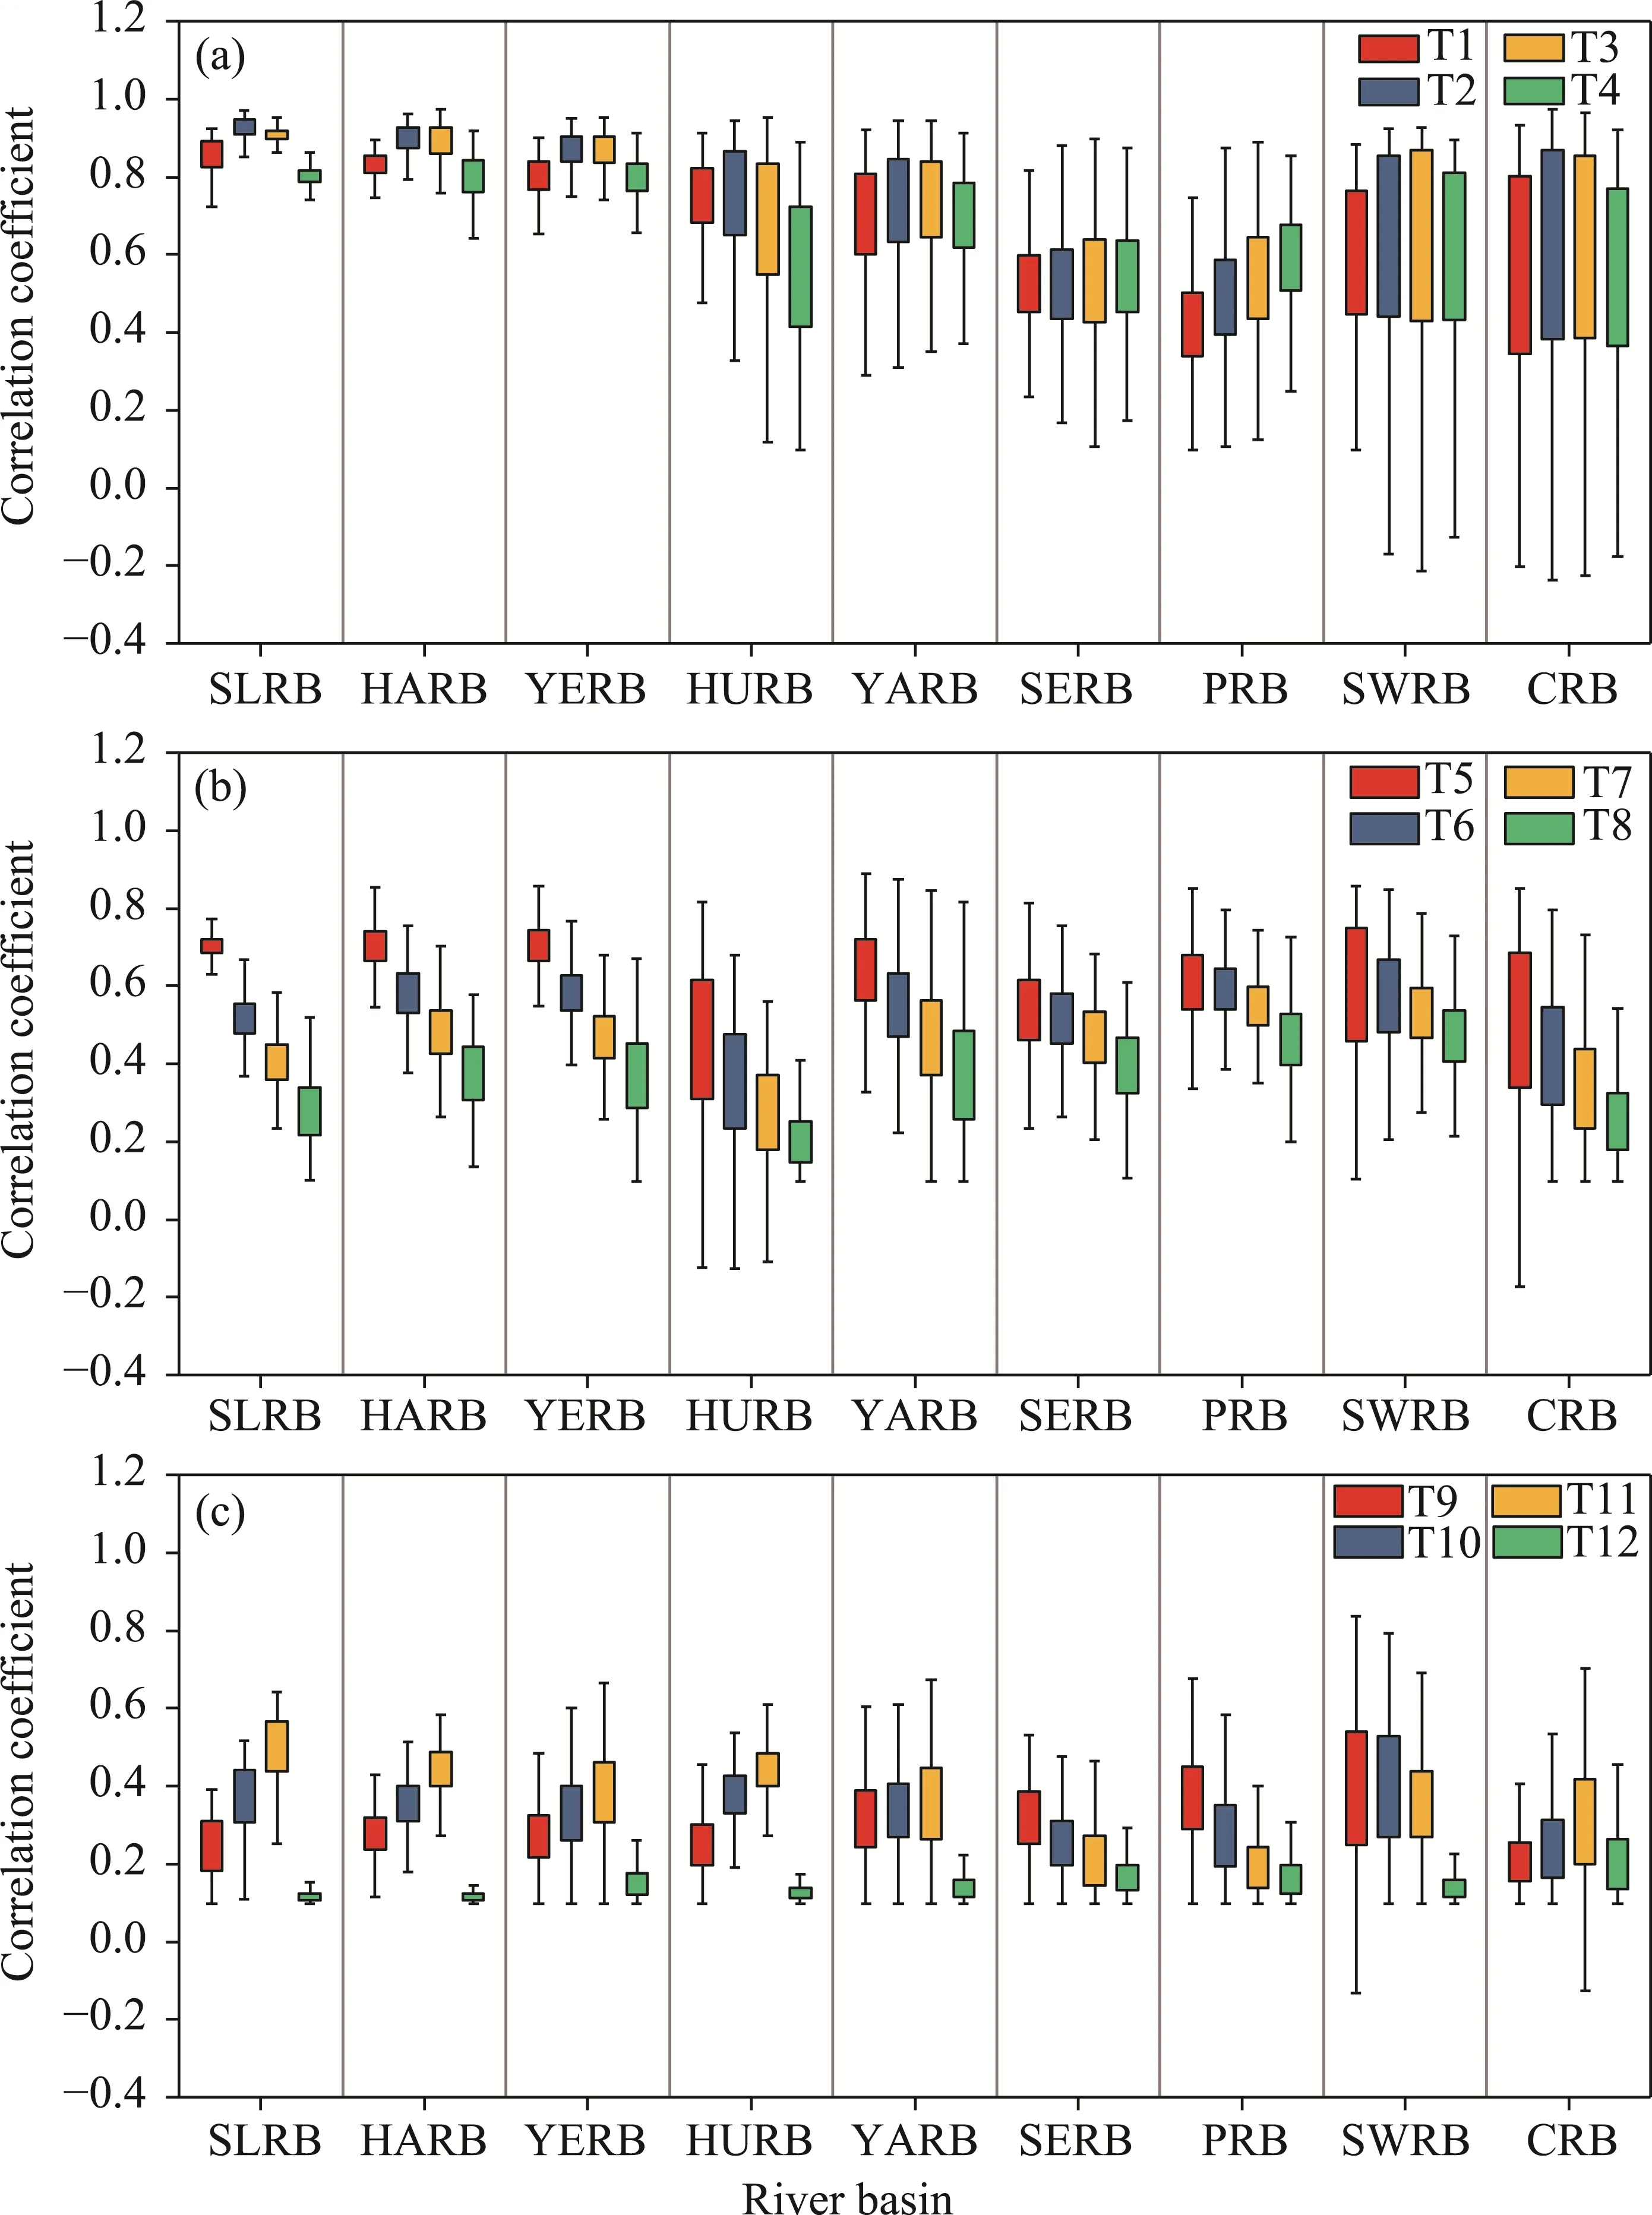
Fig.8 Correlation coefficients between the VDCI and NDVI in the nine major river basins at T1-T4 (a), T5-T8(b) and T9-T12 (c) time scales.Box boundaries indicate the 25th and 75th percentiles, respectively; whiskers below and above the box indicate the 10th and 90th percentiles, respectively.SLRB, Songhua River and Liaohe River Basin; HARB, Haihe River Basin; YERB, Yellow River Basin; HURB, Huaihe River Basin; YARB,Yangtze River Basin; SERB, Southeast River Basin; PRB, Pearl River Basin; SWRB, Southwest River Basin;CRB, Continental River Basin.
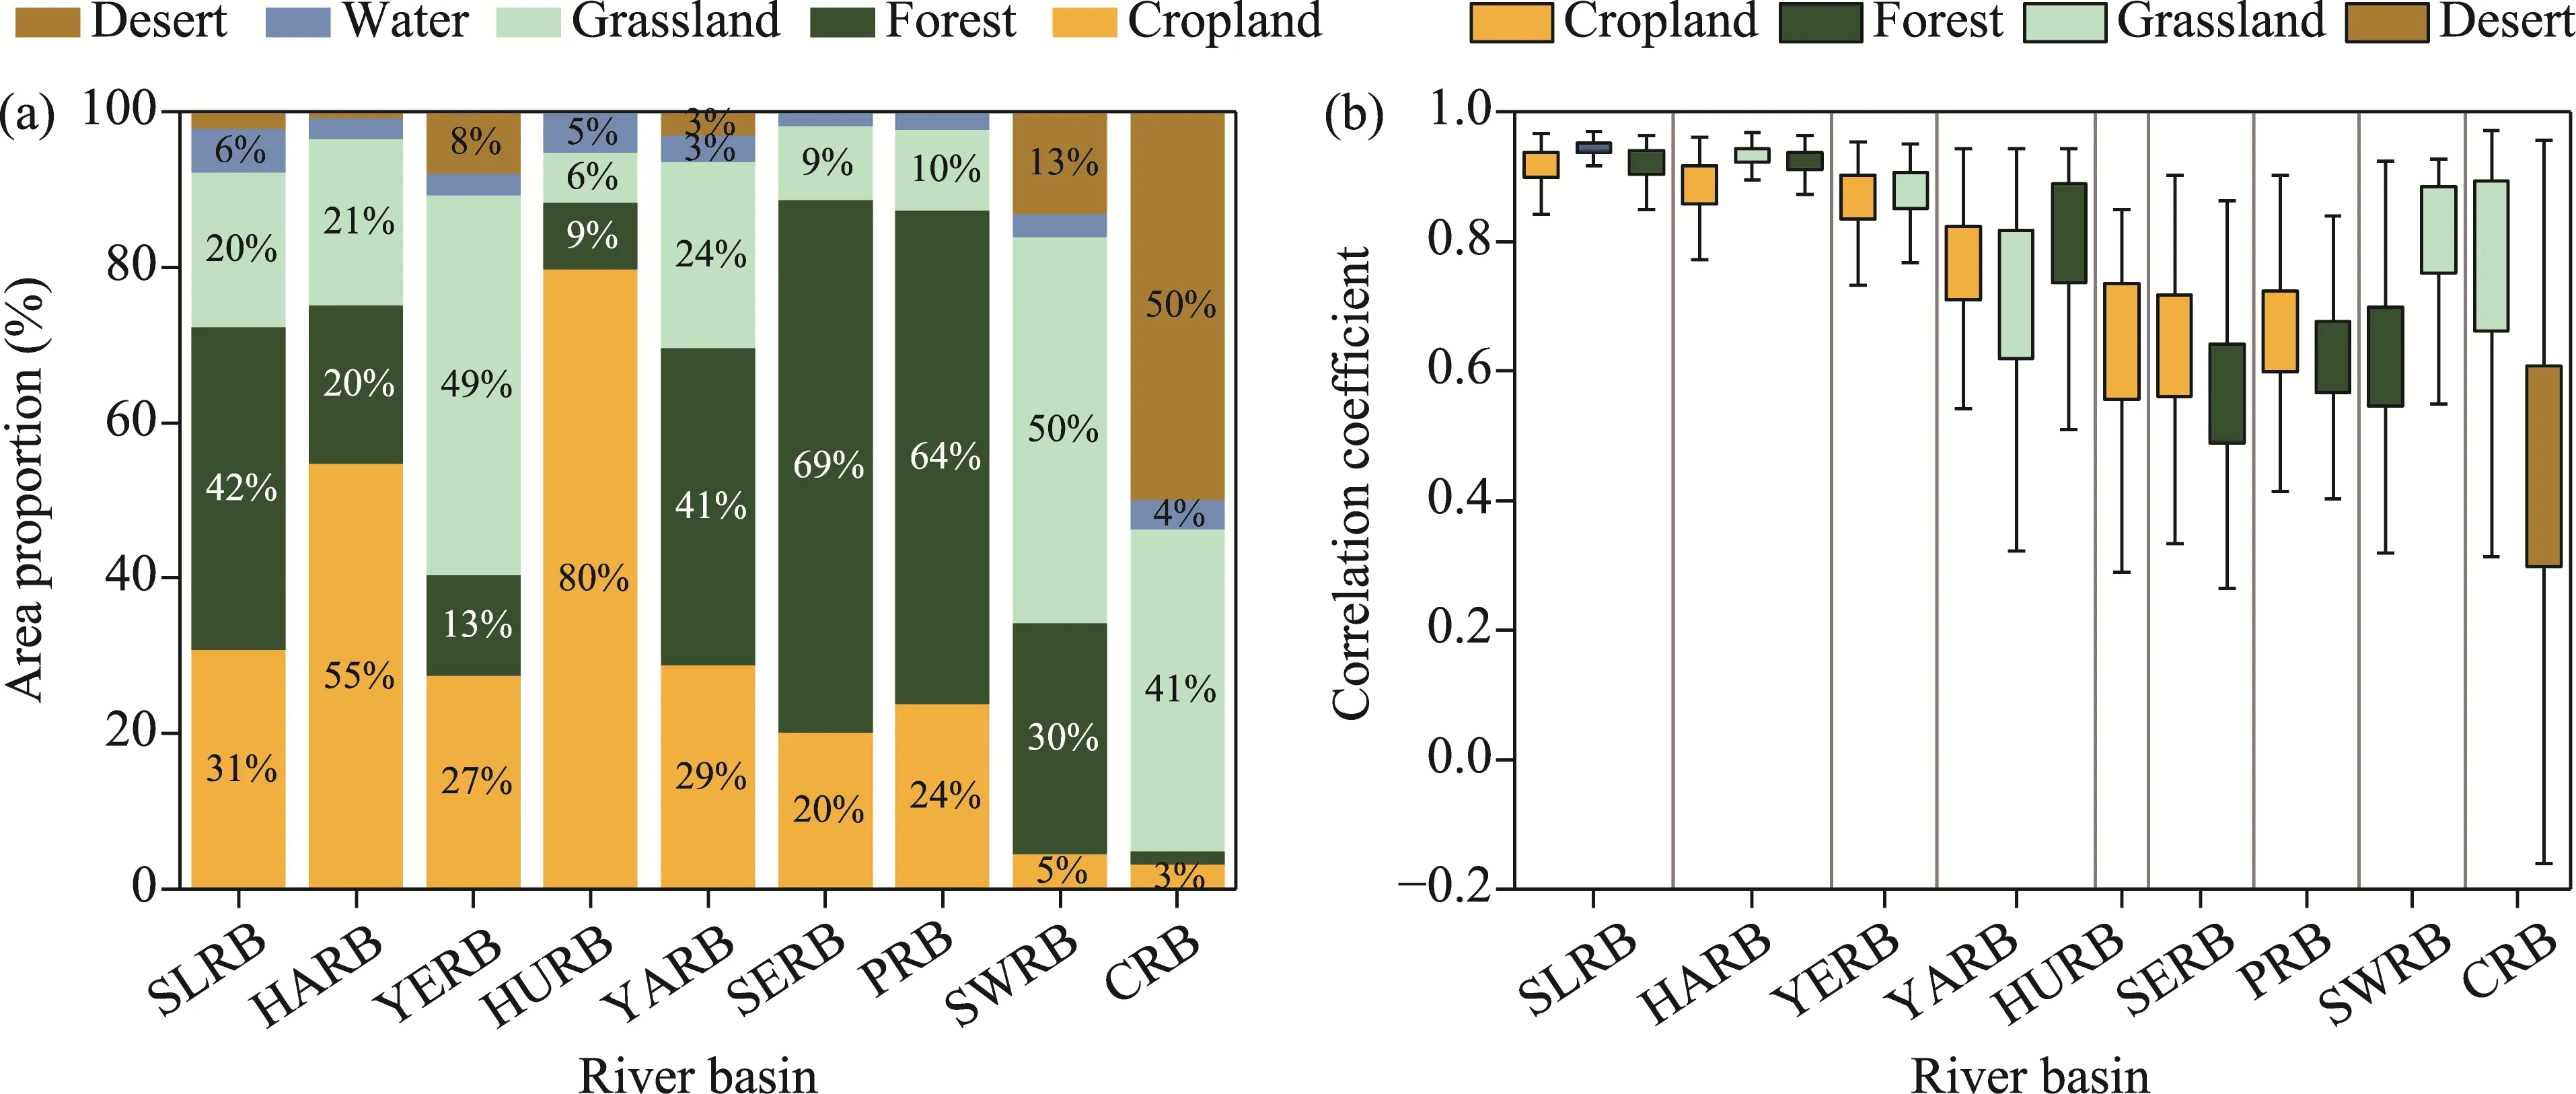
Fig.9 Area proportions of different land cover types (with the exception of construction land; a) and the correlation coefficients between the VDCI and NDVI at T1 time scale for the major land cover types (b) in the nine major river basins.SLRB, Songhua River and Liaohe River Basin; HARB, Haihe River Basin; YERB,Yellow River Basin; HURB, Huaihe River Basin; YARB, Yangtze River Basin; SERB, Southeast River Basin;PRB, Pearl River Basin; SWRB, Southwest River Basin; CRB, Continental River Basin.For the left panel, area proportion values lower than 3% are not marked in the figure; for the right panel, the major land cover types for each river basin mean that their area proportions in the corresponding river basin are greater than 20%.Box boundaries indicate the 25th and 75th percentiles, respectively; whiskers below and above the box indicate the 10th and 90th percentiles, respectively.
We further estimated the performance of the VDCI in monitoring vegetation drought for the major land cover types in the nine major river basins (Fig.9).The VDCI showed the best performance for cropland, grassland and forest in the Songhua River and Liaohe River Basin, and Haihe River Basin, followed by the Yangtze River Basin.In the Yellow River Basin, the VDCI showed the best performance for grassland and cropland.The VDCI had higher sensitivity to cropland and forest in the Southeast River Basin and Pearl River Basin.In the Southwest River Basin and Continental River Basin, the VDCI showed better performance for grassland.However,the VDCI exhibited relatively poor performance for desert, which is the major land cover type in the Continental River Basin.
3.3.2 Comparison of the performance between the VDCI and traditional drought indices in monitoring vegetation drought
The correlation coefficients between the VDCI and NDVI showed a generally decreasing trend from T1 to T12 time scales (Fig.10a).The correlation coefficients between the VDCI and NDVI were higher in the Songhua River and Liaohe River Basin, Haihe River Basin, Yellow River Basin and Huaihe River Basin at T1-T5 time scales.The correlation coefficients at T7-T9 time scales were higher in the Pearl River Basin and Southwest River Basin.In general, the mean correlation coefficients between the SPEI and NDVI were positive in the Yangtze River Basin,Southeast River Basin, Pearl River Basin and Southwest River Basin (Fig.10b); while the values were negative in the Songhua River and Liaohe River Basin, Haihe River Basin, Yellow River Basin, Huaihe River Basin and Continental River Basin.Generally speaking, the mean correlation coefficients between the SSMI and NDVI were positive in the Yangtze River Basin, Southeast River Basin, Pearl River Basin, Southwest River Basin and Continental River Basin (Fig.10c);and the values were negative in the Songhua River and Liaohe River Basin, Haihe River Basin,Yellow River Basin and Huaihe River Basin.Statistical analysis showed that the area proportions of regions with the correlation coefficients between the drought indices (the VDCI, SPEI and SSMI) and NDVI that passed the significance test (P<0.05) showed a decreasing trend from T1 to T12 time scales (Fig.10d).For the three drought indices, the area proportions of regions with the correlation coefficients passing the significance test were ranked as: VDCI>SPEI>SSMI.The area proportions were 85%-100% at T1-T11 time scales for the VDCI.
As shown in Figure 11, the correlation coefficients between the VDCI and NDVI had similar ranges (0.50-0.90) at T1, T2 and T3 time scales; the correlation coefficients showed a decreasing trend from T4 to T9 time scales; and the main ranges of correlation coefficients were 0.25-0.40,0.30-0.50 and 0.10-0.20 at T10, T11 and T12 time scales, respectively.In general, the correlation coefficients between the VDCI and NDVI were higher (more than 0.40) at T1-T6 time scales.The correlation coefficients between the traditional drought indices (SPEI and SSMI) and the NDVI were lower at different time scales.Therefore, the VDCI might have better performance than the SPEI in monitoring vegetation drought at shorter time scales (T1-T6).
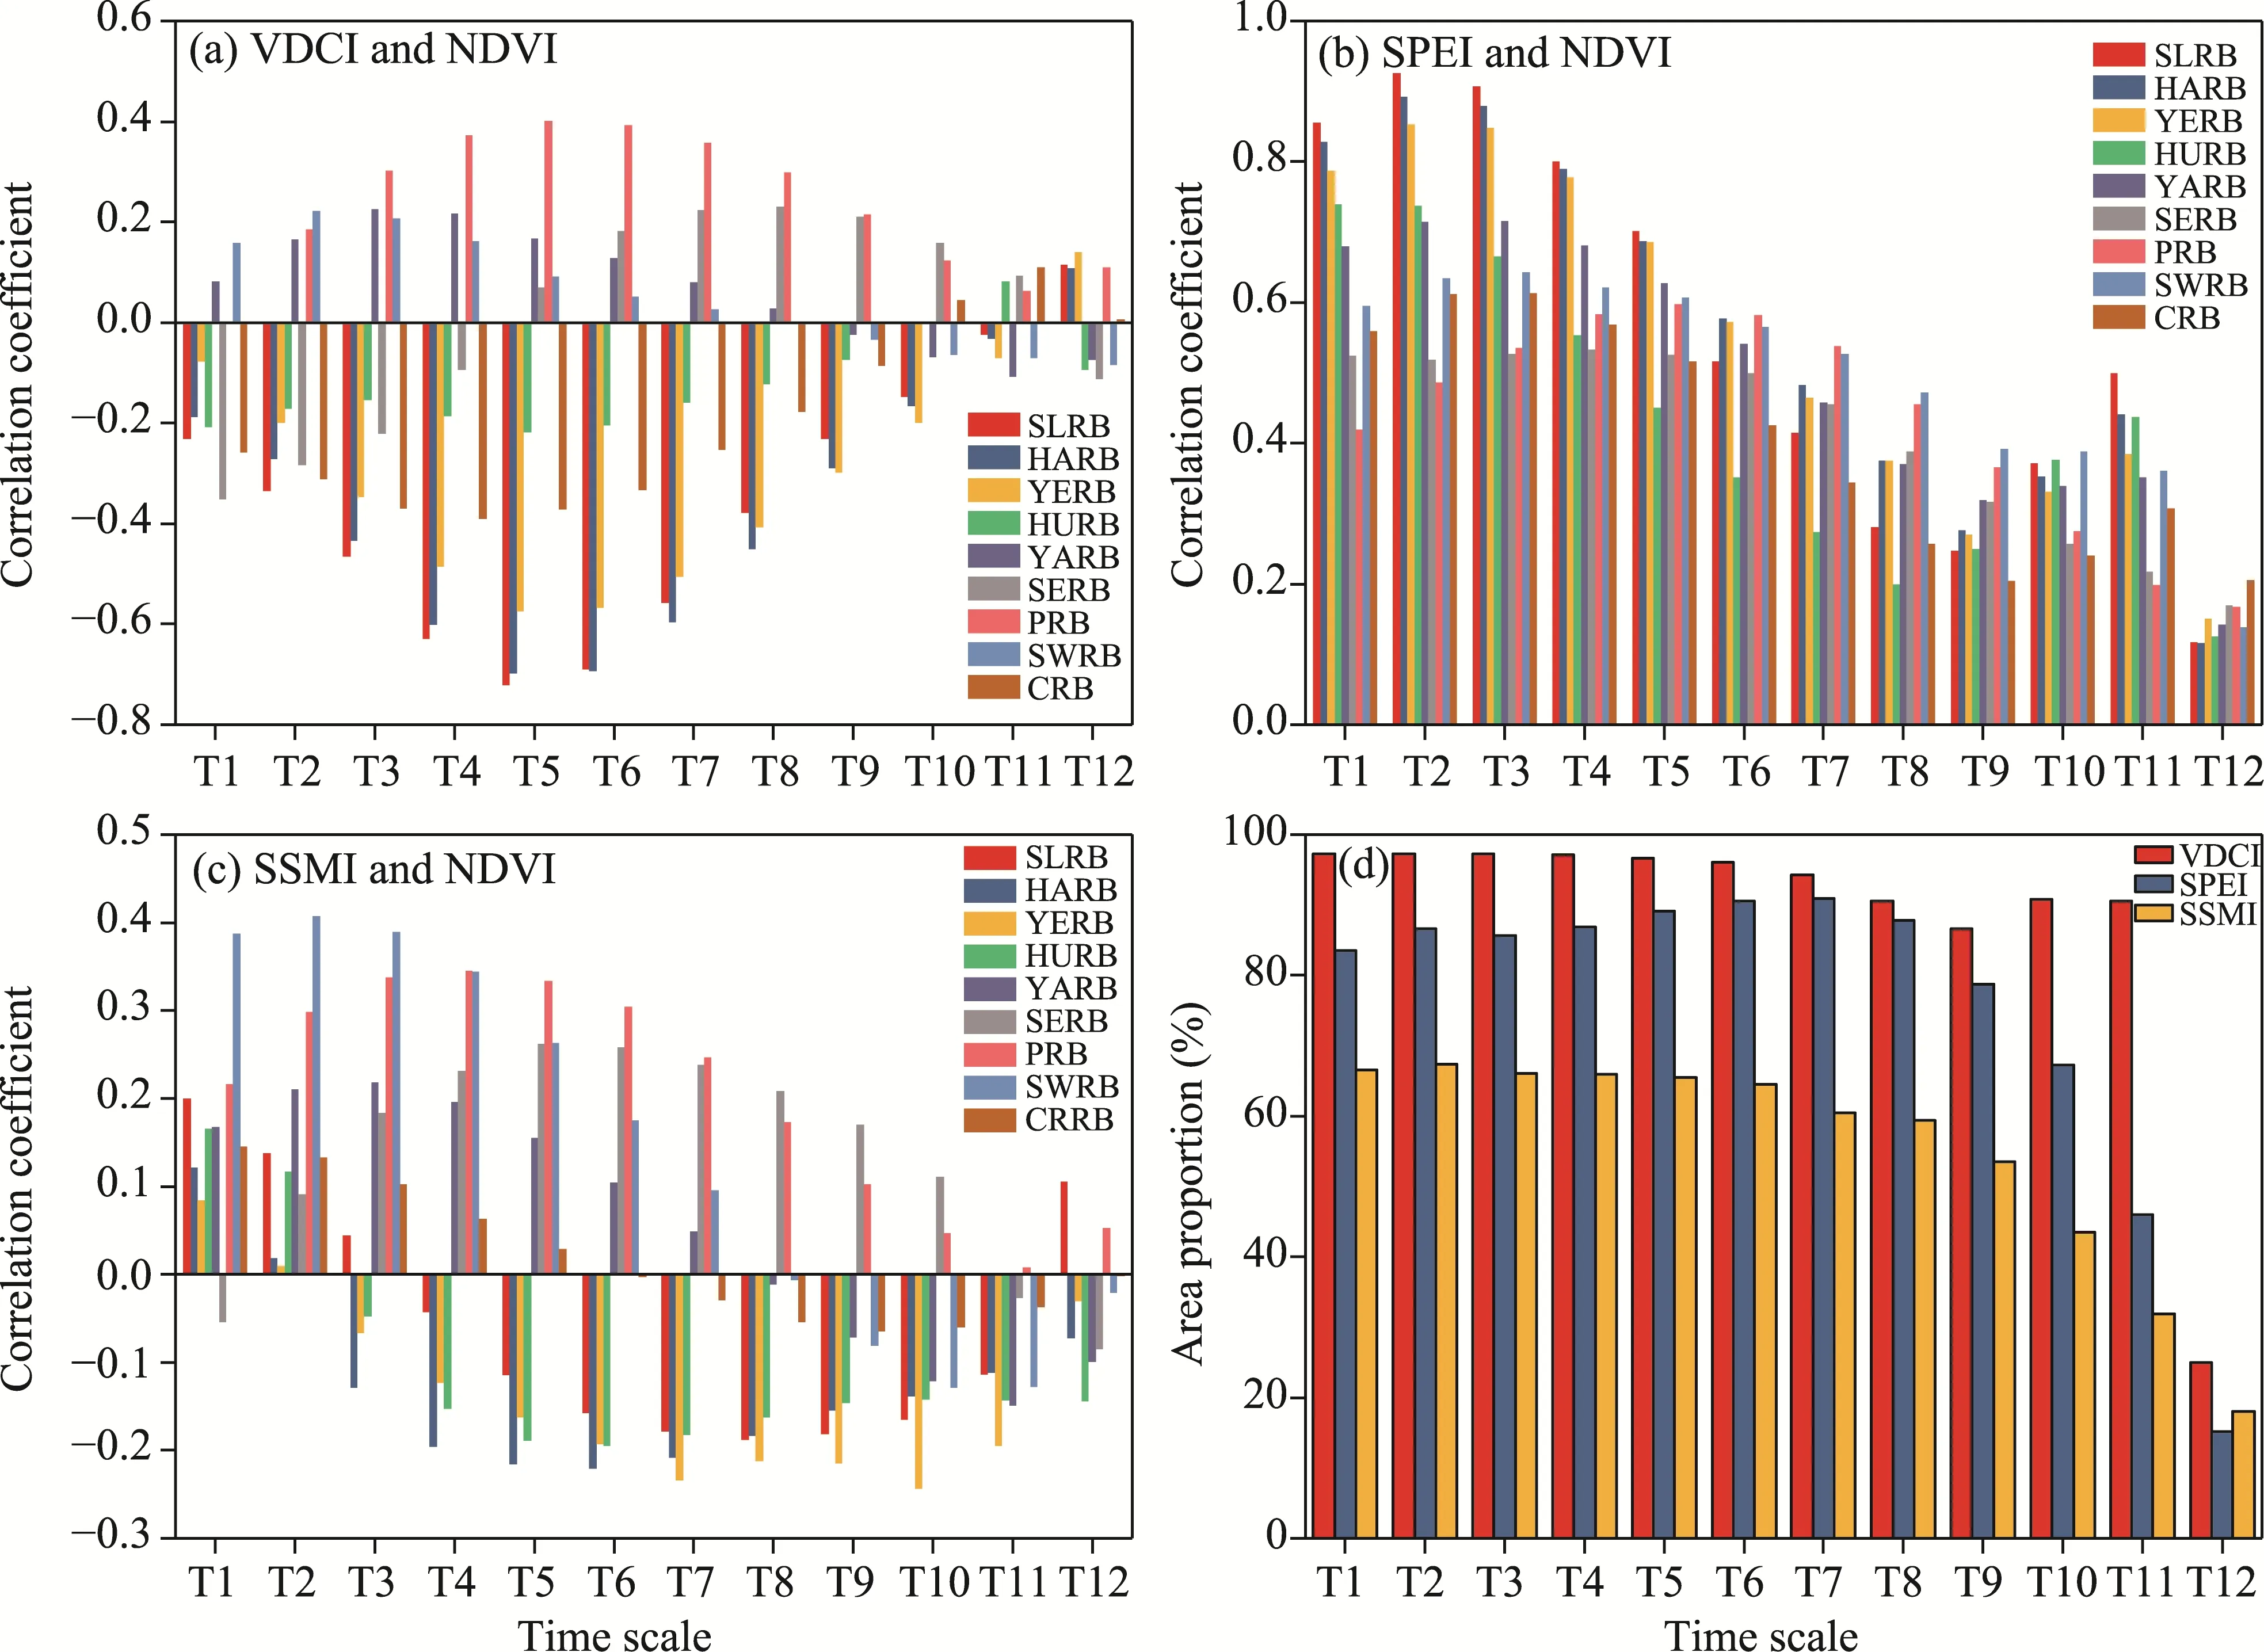
Fig.10 Variations in the mean correlation coefficients between the drought indices (VDCI, SPEI and SSMI) and NDVI in the nine major river basins at T1-T12 time scales (a-c), and the area proportions of regions with the correlation coefficients between the drought indices (VDCI, SPEI and SSMI) and NDVI passing the significance test (P<0.05) at T1-T12 time scales (d).SLRB, Songhua River and Liaohe River Basin; HARB, Haihe River Basin; YERB, Yellow River Basin; HURB, Huaihe River Basin; YARB, Yangtze River Basin; SERB, Southeast River Basin; PRB, Pearl River Basin; SWRB, Southwest River Basin; CRB, Continental River Basin.
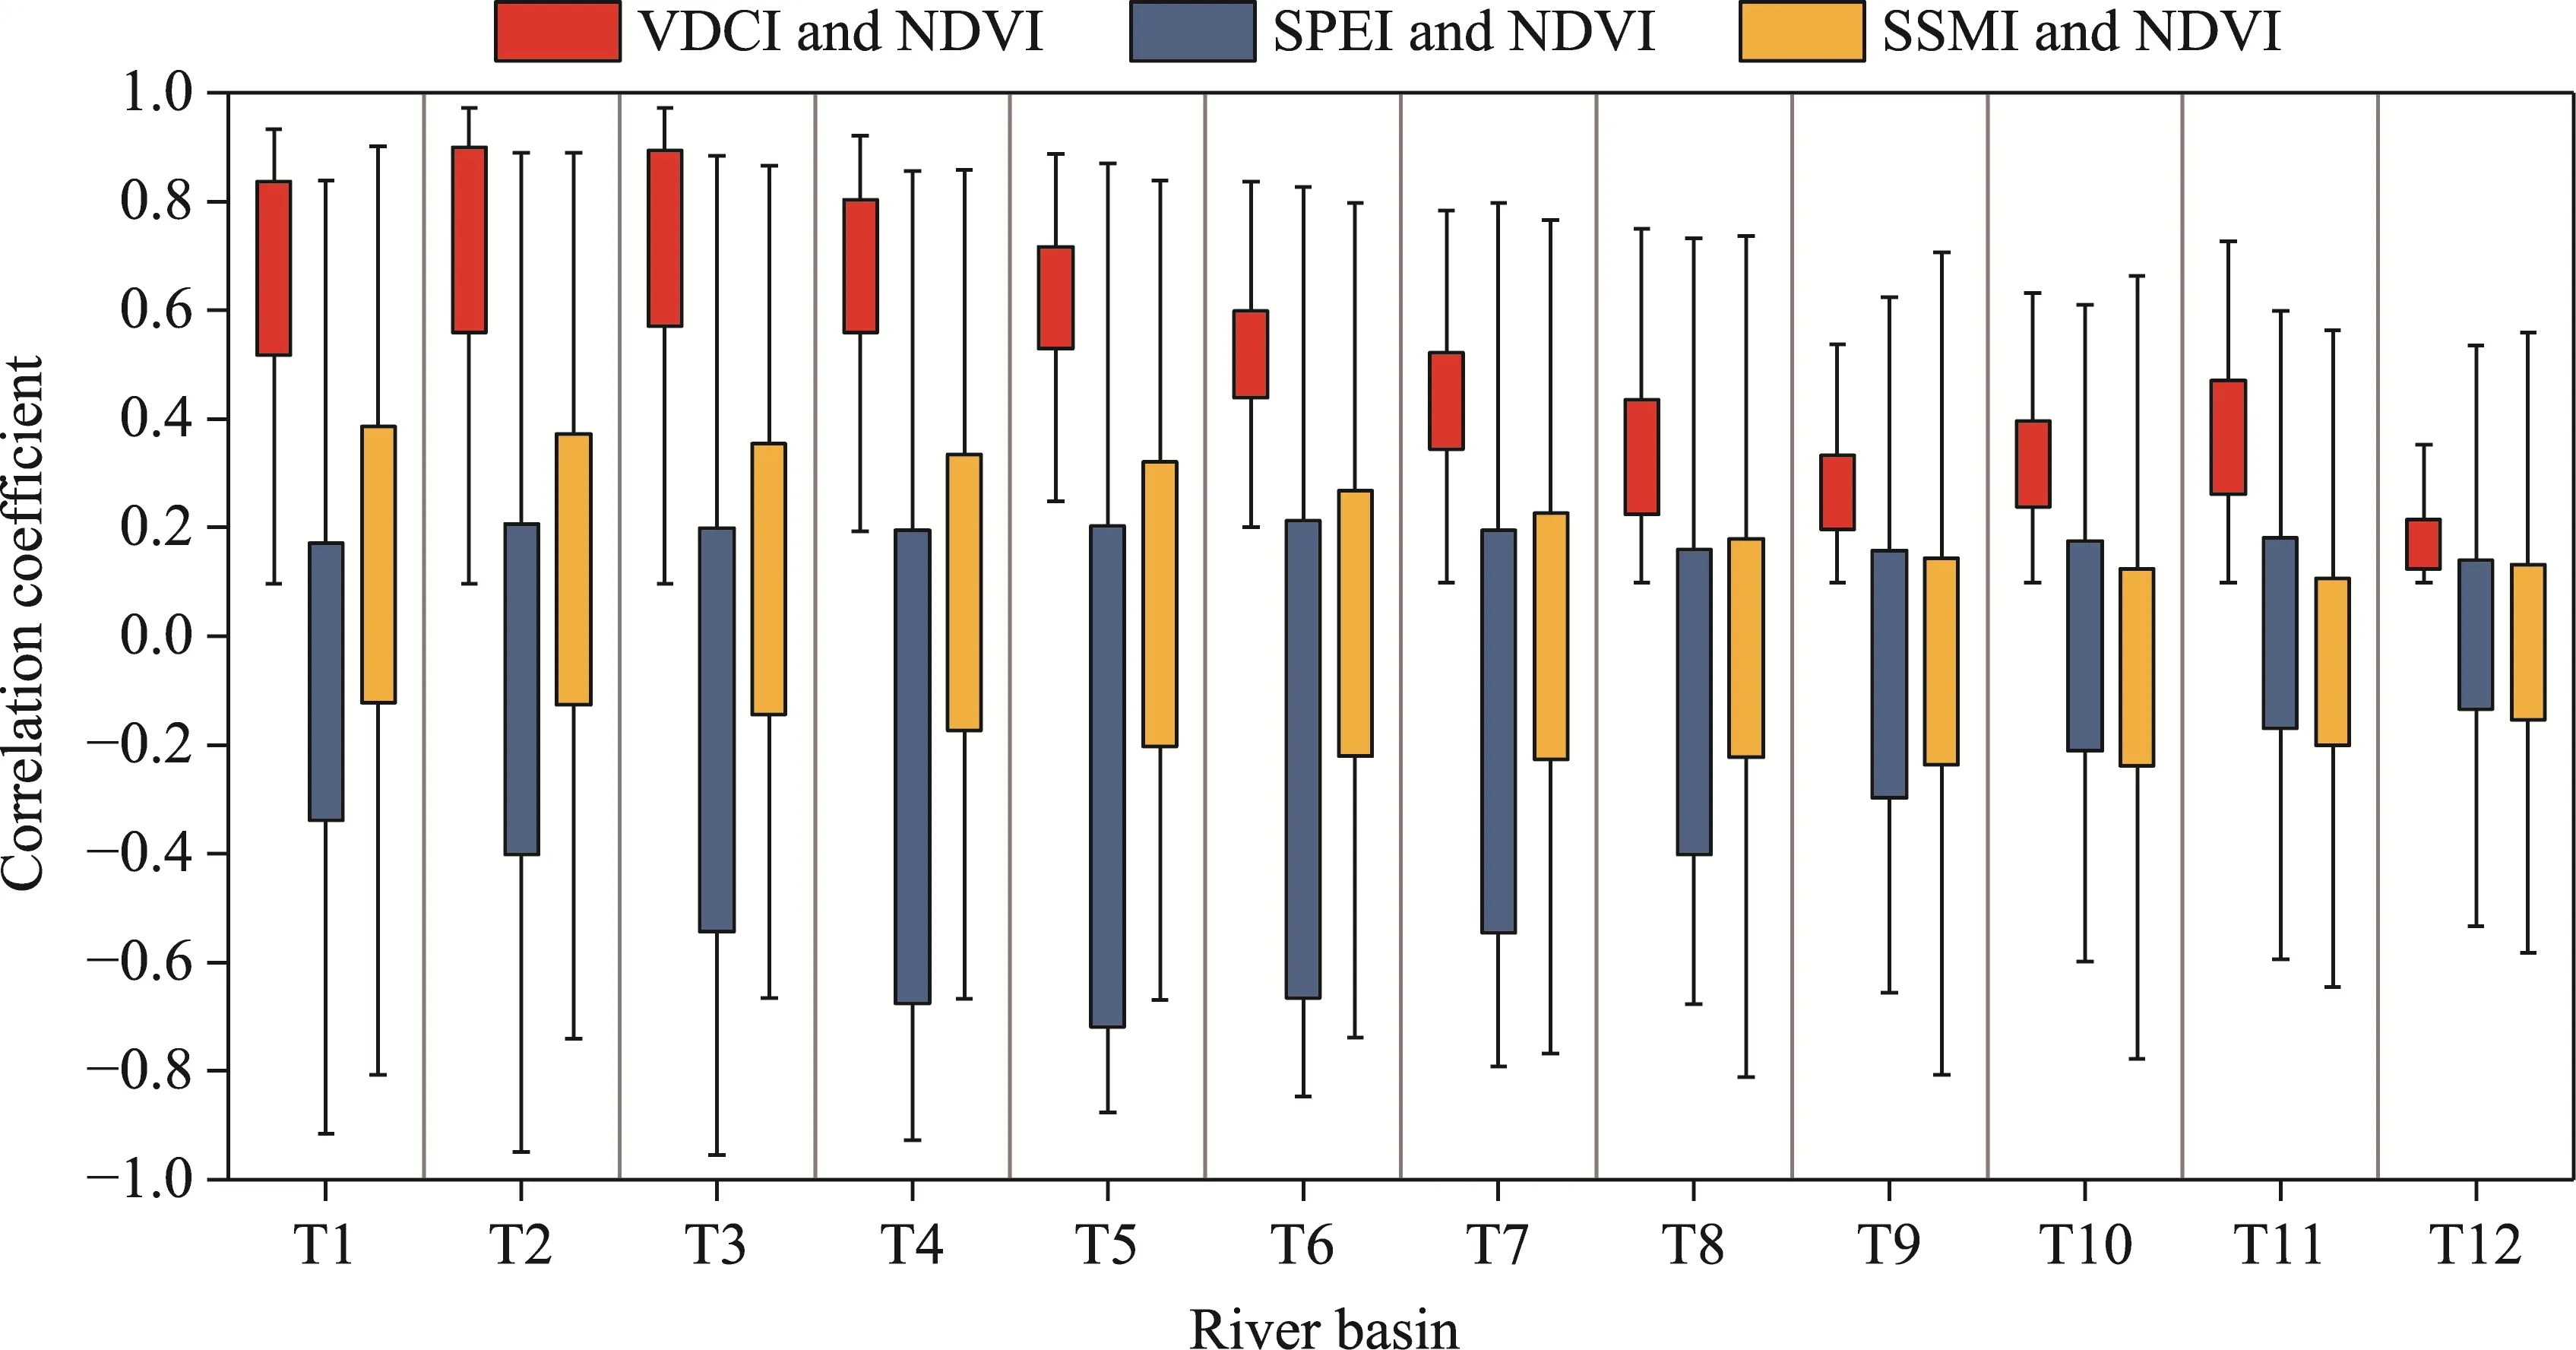
Fig.11 Correlation coefficients between the drought indices (VDCI, SPEI and SSMI) and NDVI at T1-T12 time scales.Box boundaries indicate the 25th and 75th percentiles, respectively; whiskers below and above the box indicate the 10th and 90th percentiles, respectively.
Both the VDCI and scPDSI used the same variables (precipitation, potential evapotranspiration and soil moisture) in their calculation (Zhang et al., 2019b).Therefore, we compared the performance of the VDCI and scPDSI in monitoring vegetation drought.As shown in Figure 12,most correlation coefficients between the VDCI and NDVI passed the significance test (with higher area proportions than those between the scPDSI and NDVI) in different seasons.Therefore, the VDCI had higher reliability than the scPDSI in monitoring vegetation drought in different seasons.
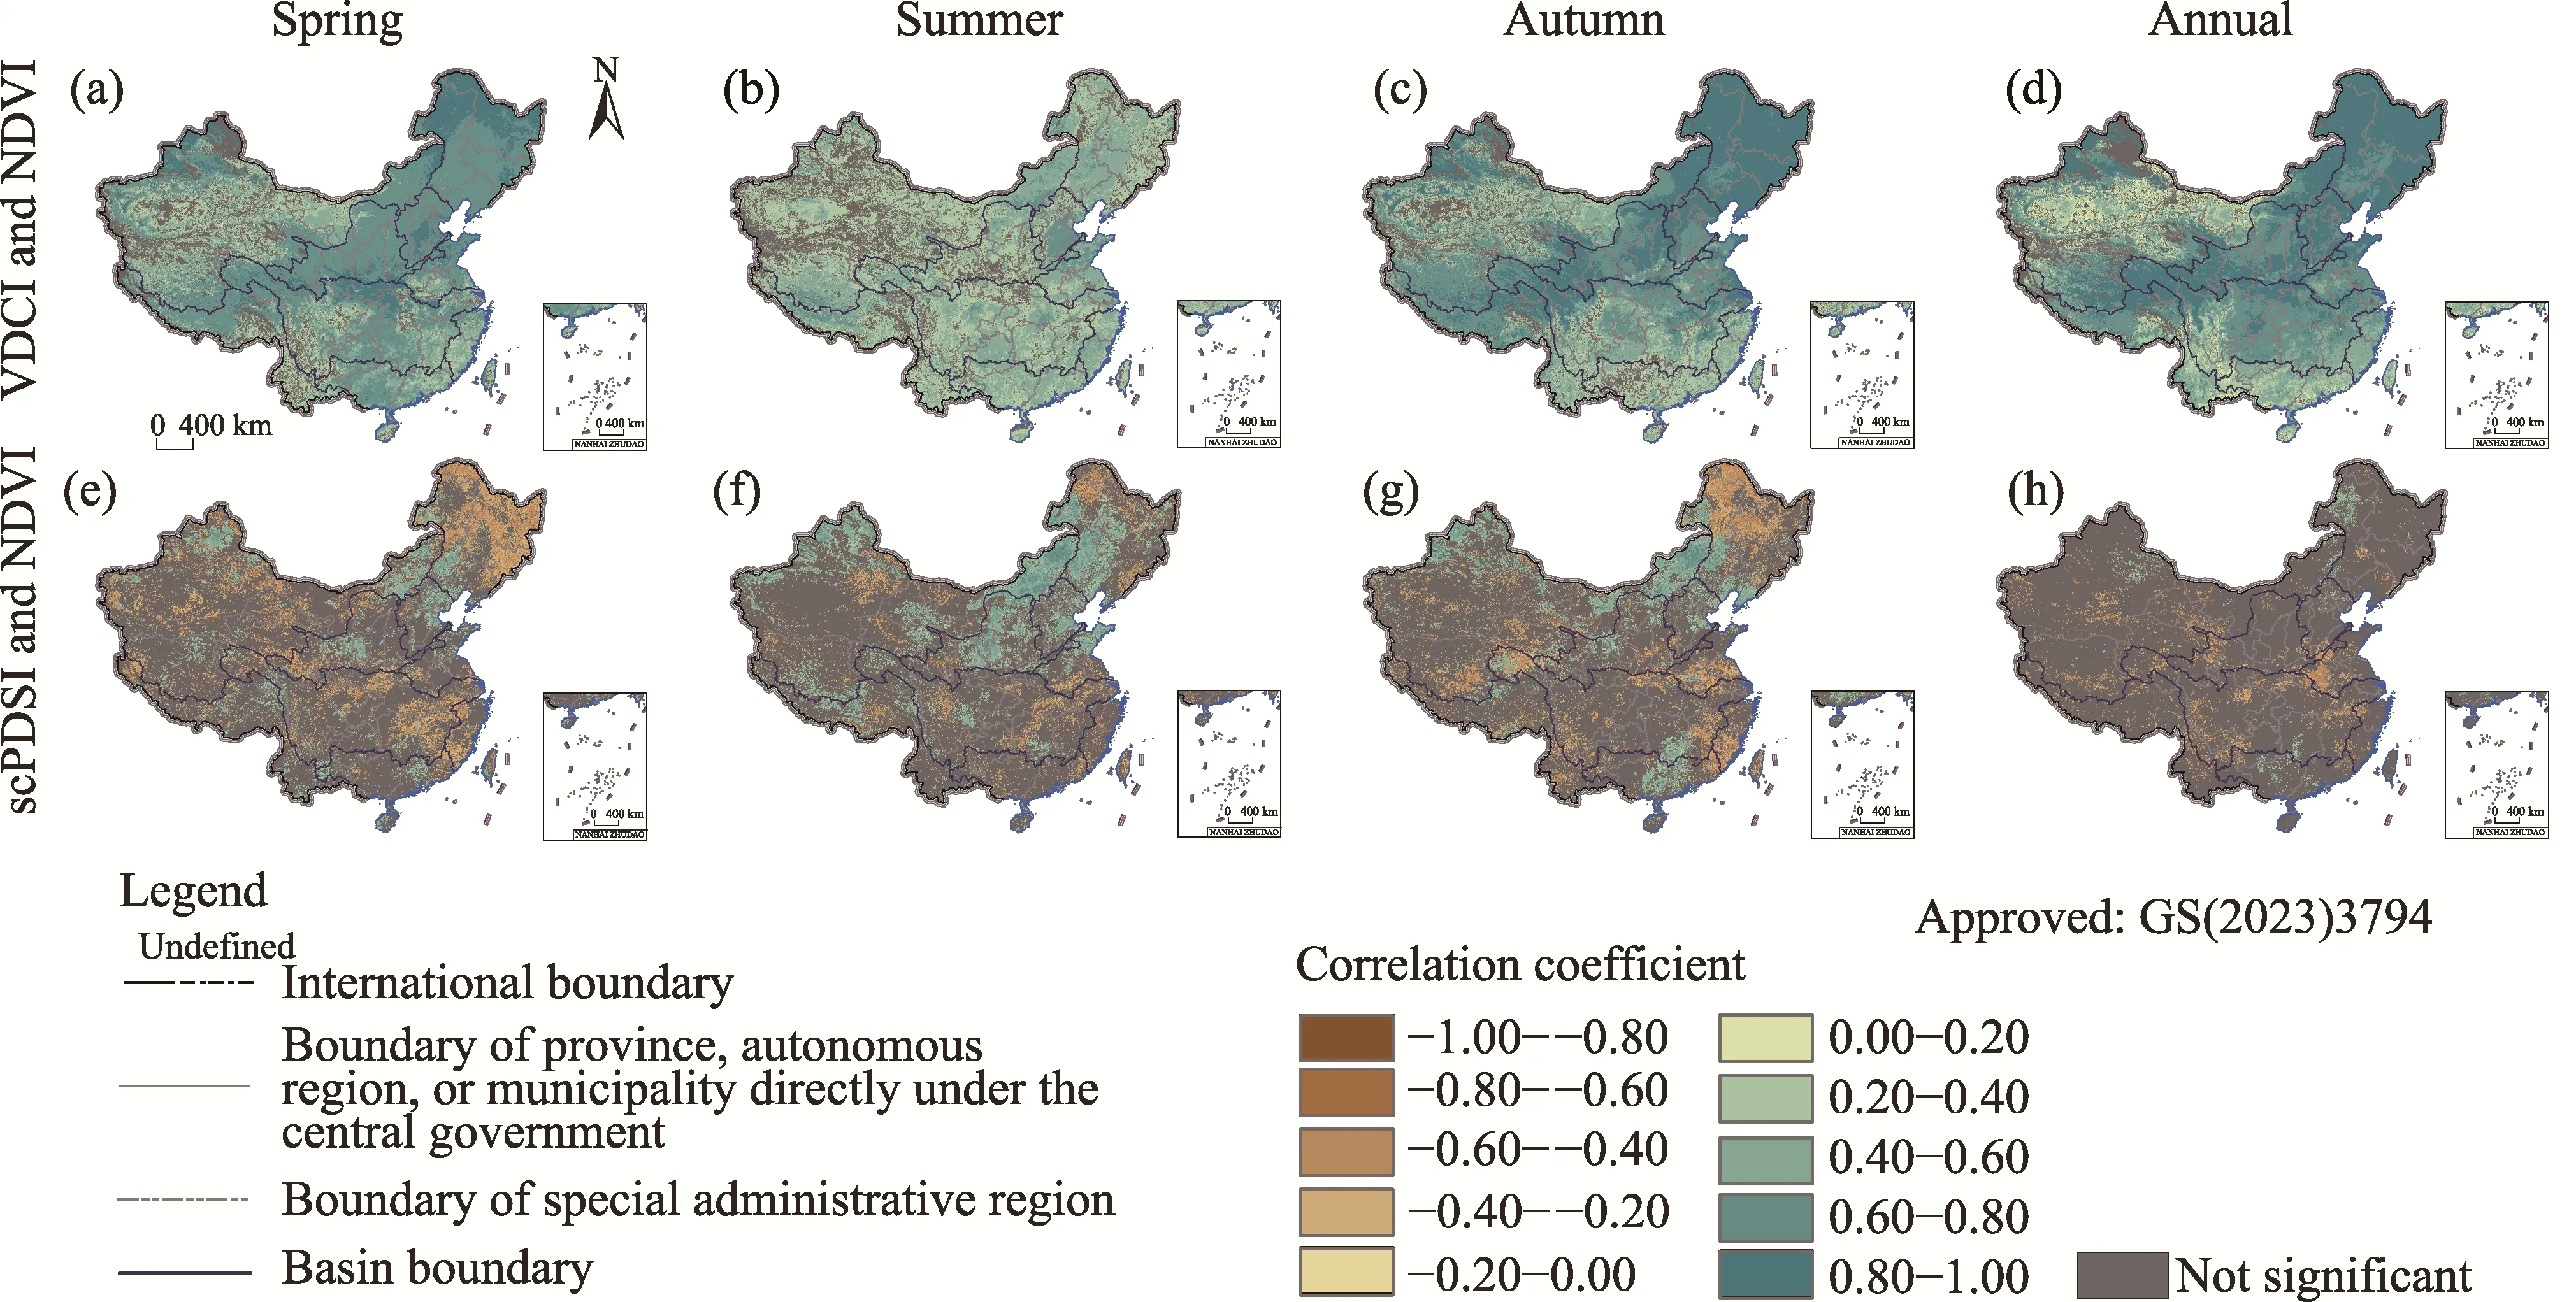
Fig.12 Spatial distribution of the correlation coefficients between the VDCI and NDVI as well as between the scPDSI and NDVI in spring (a and e), summer (b and f) and autumn (c and g), as well as at the annual scale (d and h).scPDSI, Self-calibrating Palmer Drought Severity Index."Not significant" indicates that the correlation coefficient did not pass the significance test (P>0.05).
4 Discussion
4.1 Main factors influencing vegetation in different river basins
We analyzed the influence weights of precipitation, potential evapotranspiration and soil moisture at different time scales in the nine major river basins in China.The results showed that precipitation and potential evapotranspiration generally have stronger influences on vegetation,which is consistent with the findings in previous research (Huang et al., 2017; Shi et al., 2020;Zhou et al., 2020a).Vegetation also undergoes phenological changes in response to seasonal temperature and precipitation changes (Jeong et al., 2017; Asse et al., 2018; Zhou et al., 2020b).Different vegetation types have different depths in roots (Fan et al., 2016a) and can absorb water from different soil depths (Sahaar and Niemann, 2020).When water stress occurs in a region,vegetation roots at different depths show different water absorbing capabilities (Fan et al., 2016b).Compared with grasslands and croplands, forests have higher resistance to water stress due to their longer roots (Zhang and Zhang, 2019).When the water supply from the atmosphere is insufficient, vegetation evapotranspiration is generated by vegetation canopy evaporation and root interception of soil (Gitelson et al., 2021; Nguyen et al., 2021), in which process soil moisture is consumed (Zhou et al., 2021b) while vegetation grows.Thus, soil moisture consumption and vegetation growth might lead to a negative influence of soil moisture on vegetation in China (Fig.3).However, soil moisture had small changes in different months in the nine major river basins(Fig.5c).Zhou et al.(2021a) found that soil moisture shows weak seasonal variation in China,which is contrary to the vegetation with strong seasonal variation (Ye et al., 2021).Therefore, soil moisture might be less effective than precipitation and potential evapotranspiration in demonstrating the seasonal variation of vegetation at the river-basin scale.
Potential evapotranspiration and precipitation can influence vegetation dynamics from two aspects.On the one hand, based on water balance, water deficit can alter the spatiotemporal characteristics of meteorological drought (Xu et al., 2018; Zhou et al., 2020a), which in turn influences vegetation dynamics.On the other hand, precipitation and potential evapotranspiration directly influence the physiological characteristics of vegetation.For example, high potential evapotranspiration might lead to blade shrinkage and a decreasing vertical projected area of the vegetation canopy (Gitelson et al., 2021; Yu et al., 2021).Extreme precipitation leads to waterlogging in soil and slows vegetation growth (Coumou and Rahmstorf, 2012).Figure 3 shows that the influence weights of potential evapotranspiration were slightly higher than those of precipitation at different time scales.The influence weights of precipitation were higher in the Songhua River and Liaohe River Basin, Haihe River Basin, Yellow River Basin and Continental River Basin at T1 time scale (Fig.3).Northern China generally showed higher levels of water deficit and drought than southern China (Figs.3 and 4) (Zhang and Zhang, 2019; Ding et al.,2021b).Therefore, vegetation in northern China is more sensitive to precipitation than that in southern China because drought conditions in northern China are more severe than those in southern China (Zhang and Zhang, 2019; Ding et al., 2020).
4.2 Advantages and limitations of the VDCI
Previous studies have found that climate types (Ding et al., 2021b), vegetation types (Ding et al.,2020) and human activity levels (Shi et al., 2020) vary in different regions of China, which might lead to different responses of vegetation to potential evapotranspiration and precipitation (Ding et al., 2020).Ding et al.(2020) indicated that vegetation in northern China has a stronger response to drought than that in southern China.Xu et al.(2018) and Ding et al.(2020) found that desert has weaker sensitivity to drought because this ecosystem exhibits a higher ability to resist drought.These findings are consistent with the results in this study, where the NDVI of cropland,grassland and forest showed higher correlation coefficients with the VDCI in the river basins of northern China than in the river basins of southern China, and the NDVI of desert had a lower correlation coefficient with the VDCI in the Continental River Basin.
In this study, we compared the performance between the VDCI and traditional drought indices(SPEI, SSMI and scPDSI) in monitoring vegetation drought.The results showed that the VDCI might be effective in monitoring vegetation drought, especially short-term drought.The advantage of the VDCI might be its excellent adaptability to many regional environmental characteristics.Moreover, the framework of the VDCI might be interesting to expand in other drought propagation fields, such as meteorological drought (Yao et al., 2020), hydrological drought (Leng et al., 2015) and agricultural drought (Ding et al., 2021a).
However, the VDCI also has some limitations.First, the VDCI is constructed based on large historical precipitation, potential evapotranspiration, soil moisture and NDVI data (Guo et al.,2019b), which are not easy to prepare and obtain.Second, the VDCI has a more complex calculation process than the SPEI (Xu et al., 2018).Third, the VDCI lacks sufficient theoretical support because it is based on the statistical law of historical data (Guo et al., 2019b; Gong et al.,2021).Therefore, the VDCI is still limited by large historical data, a relatively complex calculation process, and a lack of a relatively sufficient theoretical basis for the mechanism.
We further explored the performance of the VDCI in climate-vegetation subregions in China,and found that the VDCI has great performance in cold temperate coniferous forest, temperate coniferous and deciduous broad-leaved mixed forest, warm temperate deciduous broad-leaved forest, and temperate grassland (Fig.13).Moreover, the VDCI has poor performance in tropical monsoon forest and rainforest, as well as temperate desert.Tropical monsoon forest and rainforest as well as temperate desert have higher and lower vegetation cover, respectively (Zhou et al.,2020a).Therefore, the VDCI might show poor performance in regions with too high or too low vegetation cover on a global scale, such as in North Africa, Central Asia, and around the equator(Ye et al., 2021).

Fig.13 Performance of the VDCI in climate-vegetation subregions in China (indicated by the correlation coefficients between the VDCI and NDVI).A, cold temperate coniferous forest; B, temperate coniferous and deciduous broad-leaved mixed forest; C, warm temperate deciduous broad-leaved forest; D, subtropical evergreen broad-leaved forest; E, tropical monsoon forest and rainforest; F, temperate grassland; G, temperate desert; H,alpine vegetation on the Qinghai-Tibet Plateau.Box boundaries indicate the 25th and 75th percentiles,respectively; whiskers below and above the box indicate the 10th and 90th percentiles, respectively.
5 Conclusions
Based on precipitation, potential evapotranspiration, soil moisture and NDVI, we developed a new index (i.e., the VDCI) to monitor vegetation drought in the nine major river basins in China.We further determined the main influencing factors that impacted the vegetation over in different river basins and estimated the applicability of the VDCI.The main conclusions are described as follows:
(1) Potential evapotranspiration shows a higher degree of positive influence on vegetation, and it acts as the primary influencing factor with higher area proportion at multiple time scales in different river basins.Soil moisture exhibits a lower degree of negative influence on vegetation at multiple time scales in different river basins.
(2) The VDCI shows a higher correlation with the NDVI than the traditional drought indices(SPEI, scPDSI and SSMI) at T1-T12 time scales.This index generally exhibits high sensitivity in monitoring vegetation drought than the traditional drought indices.
(3) The correlation coefficients between the VDCI and NDVI are higher (more than 0.40) at T1-T6 time scales.The VDCI in the Songhua River and Liaohe River Basin, Haihe River Basin,Yellow River Basin, Huaihe River Basin and Yangtze River Basin shows a greater correlation with the NDVI at T1-T4 time scales.
The calculation framework of the VDCI is based on large historical statistical data, which could compensate for the current lack of understanding of the mechanisms between vegetation and climate.Moreover, this calculation framework might be applied in many fields, such as drought propagation.
Conflict of interest
The authors declare that they have no known competing financial interests or personal relationships that could have appeared to influence the work reported in this paper.
Acknowledgements
This study was funded by the National Natural Science Foundation of China (52179015, 42301024), the Key Technologies Research & Development and Promotion Program of Henan (232102110025) and the Cultivation Plan of Innovative Scientific and Technological Team of Water Conservancy Engineering Discipline of North China University of Water Resources and Electric Power (CXTDPY-9).
Author contributions
Conceptualization: ZHAO Lili; Methodology: ZHONG Huayu, DING Yibo; Formal analysis: ZHANG Fang,ZHU Junzhen; Writing - original draft preparation: ZHAO Lili; Writing - review and editing: ZHAO Lili;Funding acquisition: LI Yanbin, ZHAO Lili; Resources: ZHAO Lili; Supervision: LI Lusheng.
- Journal of Arid Land的其它文章
- Integrating stable isotopes and factor analysis to delineate the groundwater provenance and pollution sources in the northwestern part of the Amman-Al Zarqa Basin, Jordan
- Estimation and inter-comparison of infiltration models in the agricultural area of the Mitidja Plain,Algeria
- Evaluation of the water conservation function in the Ili River Delta of Central Asia based on the InVEST model
- Soil seed bank is affected by transferred soil thickness and properties in the reclaimed coal mine in the Qilian Mountains, China
- Effects of degradation and species composition on soil seed density in the alpine grasslands, China
- Analyzing environmental flow supply in the semi-arid area through integrating drought analysis and optimal operation of reservoir