
THE COMPARATIVE STUDY OF VENTILATED SUPER CAVITY SHAPE IN WATER TUNNEL AND INFINITE FLOW FIELD*
2010-05-06 08:22:23ZHOUJingjunYUKaipingMINJingxinYANGMing
水動(dòng)力學(xué)研究與進(jìn)展 B輯 2010年5期
ZHOU Jing-jun, YU Kai-ping, MIN Jing-xin ,YANG Ming
School of Astronautics, Harbin Institute of Technology, Harbin 150001, China, E-mail: jingjun4866@163.com
THE COMPARATIVE STUDY OF VENTILATED SUPER CAVITY SHAPE IN WATER TUNNEL AND INFINITE FLOW FIELD*
ZHOU Jing-jun, YU Kai-ping, MIN Jing-xin ,YANG Ming
School of Astronautics, Harbin Institute of Technology, Harbin 150001, China, E-mail: jingjun4866@163.com
(Received January 24, 2010, Revised April 1, 2010)
In order to understand the difference of ventilated supercavity in water tunnel and infinite flow field, 3-D numerical simulations are carried out to obtain the ventilated supercavity in above mentioned conditions based on RANS equations, using the finite volume method and SST turbulence model in the framework of the two fluid multiphase flow model. The numerical method adopted in this article for the infinite flow field and water tunnel experiments is validated by comparing results with those of empirical formulas and experimental data. On this basis the difference between water tunnel experiments and infinite flow field is studied, including the influence of the route loss and the blocking effect in the water tunnel. Finally, some suggestions are made for water tunnel experiments.
ventilated supercavity, two fluid multiphase model, ambient pressure, viscous effect, blocking effect, cavitation number
1. Introduction
Supercavitation occurs when a submerged, moving body is enveloped by a large, continuous cavity. It provides a means of significantly reducing the drag of an underwater body, thus enabling a dramatic increase in its maximum speed. For its generation, the “Artifical Injection of Gases”[1,2]has been proved to be a very effective approach to obtain the supercavity at a relatively low velocity. Currently, the supercavity was studied mostly by numerical simulations and water-tunnel experiments. When the free stream velocity keeps constant, the parameters of the flow field are theoretically considered to be the same when the inertial coordinate system is adopted for underwater vehicles in the infinite flow field or for earth in a water tunnel without considering other influencing factors. Nevertheless, many experimental conditions affect water-tunnel experiments in a complicated way. One of the most important influencing factors is the wall effect of the water tunnel including the viscous and blocking effects. According to the water-tunnel test data in this article, the obtained ventilated cavitation number depends greatly on the pressure sensor installation position, and in general, it is relatively larger than what would be obtained by the empirical formula. Cavitation number is a very significant similarity parameter which is related to the drag coefficient, the ventilation coefficient, the scale of supercavity among the others. The water tunnel experiment is important in the investigation of ventilated supercavity and its results should be able to extend to the infinite flow field, therefore, the difference of results between a water tunnel and the infinite flow field would be an issue.
In many water tunnel experiments[3-8], although the influence of the wall was observed on the flow field as compared with the infinite flow field, no general corrections were made. Liu and Liu[9]investigates the blocking effect on the drag measurement in the water tunnel with numerical simulations, but with the experimental model in the whole wet condition and without further analysis. Chen et al.[10]uses the isotropic mixture multiphase model to study the influence of wall effect on the supercavity scale and the drag coefficient, but without further analysis of the mechanism. On the other hand, in various numerical simulations for ventilatedsupercavity, the homogeneous multiphase model is mostly adopted[11-14]and the results in water tunnels are difficult to be extended to the infinite flow field without duly considering the influencing factors.
This article studies the influence of the wall on the ventilated supercavity in water tunnels using 3-D numerical simulations. The empirical formula and the water tunnel experimental data are used to show the feasibility of numerical methods for the infinite flow field and the water tunnel. On this basis, the difference between water tunnel experiments and the infinite flow field is studied, focusing on the effect of the route loss and the blocking effect on the supercavity shape in a water tunnel. This study would provide some guidance to the design of the water tunnel experiments and would help to extend the results to the infinite flow field.
2. Numerical models
Because of large natural cavitation number related with the low free stream velocity (6 m/s -9 m/s) , the natural cavitation can be totally ignored. The temperature of water and air are 25oC The basic approach to simulate the ventilated cavitation flows consists of solving the standard 3-D viscous flow N-S equations, the energy equation, the turbulence equations, the gas state equation and the volume fraction equation[15]. The continuity equation for the single phase is:

wherekP is the production rate of turbulence. The model constants are given by
The main problem of Wilcox model is its sensitivity to free stream conditions.With different values specified for ω at the inlet, a significant variation of the results of the model could be obtained. Obviously, this is not desirable. Menter developed a blending between the k?ω model near the surface and the k?ε model in the outer region. Wilcox model is thereby multiplied by a blending function F1and the transformed k?ε model by a function 1? F1. F1is equal to unity near the surface and decreases to zero outside the boundary layer. That is BSLk?ω model .
The coefficients of the BSL model are a linear combination of the corresponding coefficients of the underlying models:
The BSL model combines the advantages of the Wilcox and the k?ε models, but still fails to properly predict the onset and the amount of flow separation from smooth surfaces, mainly because both models do not consider the transport of the turbulence shear stress, which would result in an overprediction of the eddy-viscosity. The proper transport behavior could be accounted by a limiter in the formulation of the eddy-viscosity.
The SST model considers the transport of the turbulence shear stress and gives highly accurate predictions of the onset and the amount of flow separation under adverse pressure gradients.
Again, F2is also a blending function as F1, while S is an invariant measure of the strain rate.
The choice of blending functions is critical to the success of the method.
where y is the distance to the nearest wall and ν is the kinematic viscosity.
3. Physical models and boundary conditions
3.1 Physical models
Two physical models are used in this article. The single cavitator as shown in Fig.1 is used to investigate the ventilated supercavity in both the infinite flow field and a water tunnel; the other model is the slender rod for water tunnel experiments as shown in Fig.2. The diameter of the two models is 10 mm and 12 mm, respectively. The number of structural elements in simulations in each working condition is in the range of 1 900 000 to 2 100 000 varying with the size of flow fields.
Fig.1 Cavitator used in the simulation
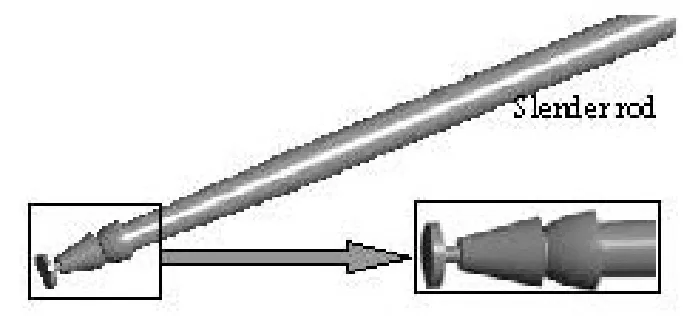
Fig.2 Slender rod
3.2 Boundary conditions
Boundary and boundary conditions are shown in Fig.3. The velocity components, the volume fractions, the turbulence intensity and the length scale are specified at the velocity inlet boundary and extrapolated at the pressure outlet boundaries. The mass inlet boundary is defined at the blowhole. The pressure distribution is specified at the pressure outlet boundary (including the pressure opening if the infinite flow field is considered) and extrapolated atthe inlet boundaries. At walls, the pressure and volume fractions are extrapolated and the no-slip boundary condition or free-slip boundary is specified. For the sake of comparison, in all simulations in this article , the unified absolute pressure is assumed on the outlet.
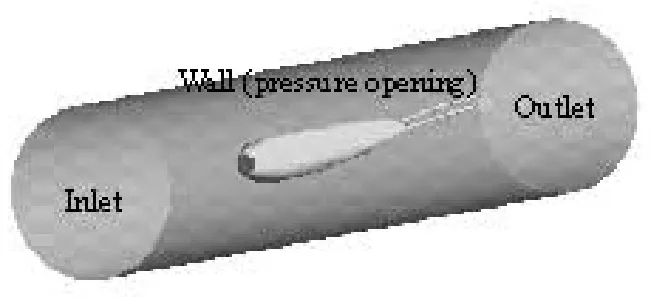
Fig.3 Boundary conditions
All simulations are carried out in High Performance Computing Center, Harbin Institute of Technology.
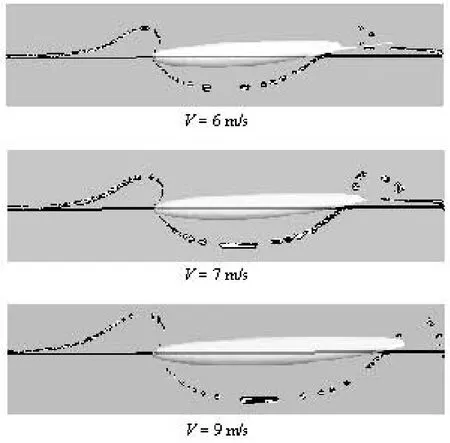
Fig.4 The reasonablep∞position as indicated by empirical formulas
4. Simulations and results
4.1 The results of infinite flow field
The best method to simulate the motion of underwater vehicles in a real infinite flow field is to use the moving mesh technology. However, it involves many problems. Most important of all is the great calculation complexity arisen from its unsteady nature. For the problems in this article, however, due to the uniform motion, if the inertial coordinate system is set on the vehicle, the moving mesh technology is not necessary for both water tunnel or wind tunnel. In order to test the accuracy of the numerical method including the boundary conditions, the empirical formulas are used. Three different working conditions are considered with different free velocities 6 m/s, 7 m/s and 9 m/s. The absolute pressure on the outlet and the opening are p0+ ρg h, a function of water depth. In Fig.4, the thick curves show the reasonable p∞position by combining simulation results with empirical Eqs.(14) and (15). The length of supercavity is calculated in the numerical simulation, the cavitation number is obtained from Eq.(14) and the ambient pressure is obtained from Eq.(15). It can be seen that the stable reasonable position of p∞is distributed in the front of the cavitator and at the horizontal line with the cavitator center on it, as is consistent with the real infinite flow field. So, p∞obtained from Eq.(15) means the undisturbed pressure which is also the pressure of the infinite flow field.
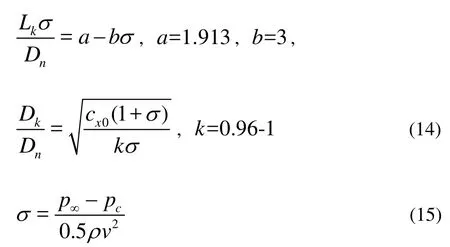
where Lkis the length of the cavity,Dkis the maximal diameter of the cavity, and Dnis the diameter of the cavitator.
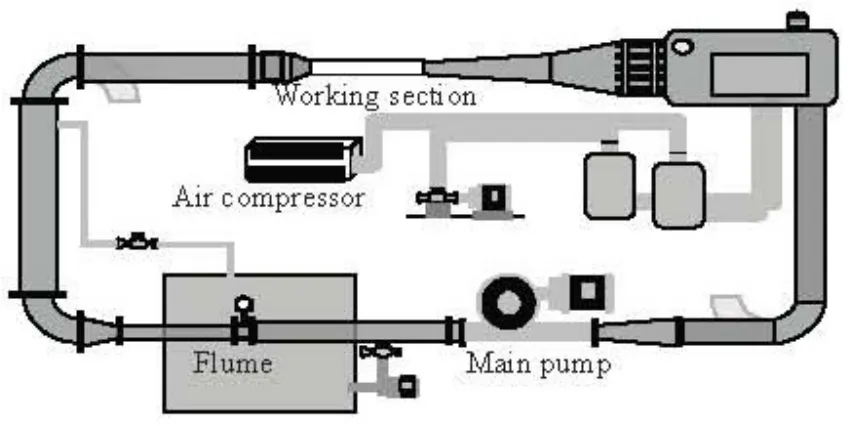
Fig.5 Schematic diagram of water tunnel
4.2 The results of water tunnel
Experiments were carried out in the cavitation water tunnel of Harbin Institute of Technology, as shown in Fig.5. The water tunnel is a recirculating facility with the absolute pressure regulation and the maximal free stream velocity can reach up to 25 m/s. The design of the water tunnel allows for the removal of the air during the ventilated experiments and the tunnel is equipped with static pressure ports and miniature pressure transducers for measuring the pressure around the models and within the cavity. One high speed camera is used to observe the cavity. Theworking section is a cylinder of 0.2 m in diameter and 2 m in length.
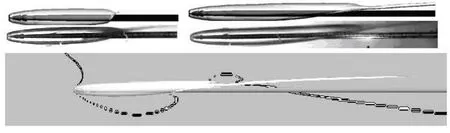
Fig.6 Supercavity shape in simulations and experiments
The model used in the water tunnel is as shown in Fig.2, which is a slender rod. In order to keep the cavity undisturbed as far as possible, the rear-supporting method is adopted and the diameter of the rod is designed to be as small as the structure strength is guaranteed. Finally, the diameter of the cavitator is 12 mm and the diameter of the rod is 14 mm.
It is difficult to guarantee that all conditions in the simulations are consistent with those in the water tunnel. Some parameters are specified for the consistency, including the ventilation volume and the pressure in the cavity. It is found that the error of the supercavity length of both methods is within 10%. Figure 6 shows the results of experiments and simulations with the same ventilation volume and pressure in the cavity and it can be seen that the reasonable position of the ambient pressure is not on the centerline of the model. In Fig.6, the upper part is the simulation results, the other parts are the experimental results.
4.3 The water tunnel blocking effect on the supercavity scale
The water tunnel is more complicated than the infinite flow field due to the viscous effect of wall and its blocking effect. The viscous effect could not be avoided in a water tunnel so that the two influencing factors can not be investigated separately in experiments. However, that can be done in numerical simulations. It must be emphasized that in this article, the static pressure on the “outlet” in the following four working conditions takes the same value p0+ ρg h and the viscous effect of the wall is not considered.
Figure 7 shows the variation of the supercavity scale when the blocking effect becomes more and more serious, where D is the diameter of the water tunnel. L is supercavity length,Dmaxis the maximal diameter of cavity, β is the slenderness ratio. When the diameter of the water tunnel is 0.20 m, the blocking effect of the wall can almost be ignored. It can be seen that the length of the supercavity increases gradually and the diameter decreases when the water tunnel becomes more slender. It is obvious that the blocking effect increases the slenderness ratio.
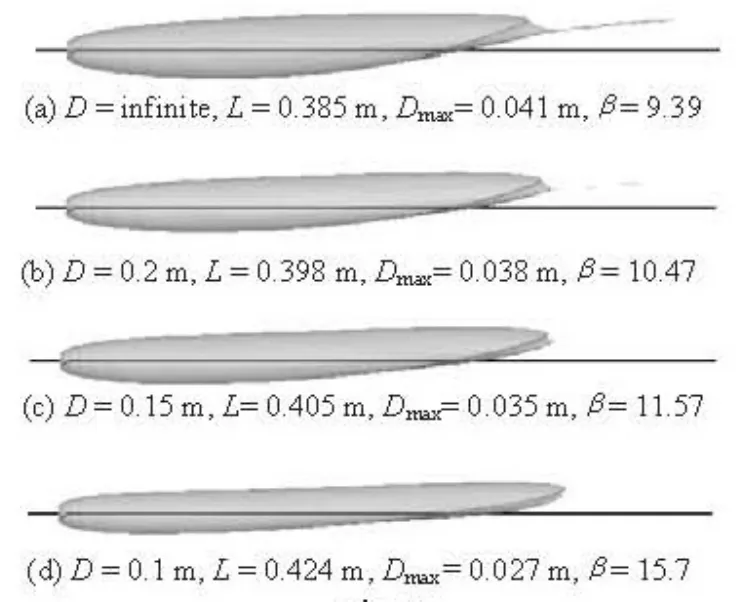
Fig.7 Supercavity shape and relative parameters for blocking effect
Figure 8 shows the absolute pressure distribution on the centerline of the water tunnel. The affected pressure distribution area almost all locates behind the cavitator where the supercavity develops. And the pressure in the supercavity decreases with the decrease of the water tunnel diameter. It can be seen that the blocking effect affects not only the diameter of the supercavity but also its length.
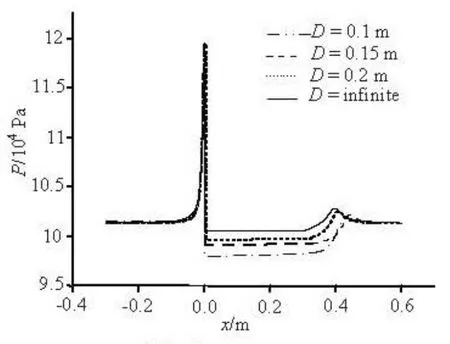
Fig.8 Pressure distribution on the centerline of the water tunnel
4.4 The influence of water tunnel viscous effect on supercavity scale
In water tunnel experiments, the viscous effect of the wall is always there. Unlike the infinite flow field,the viscous effect of the wall affects the static pressure distribution, and in its turns, the cavitation number and the supercavity scale.
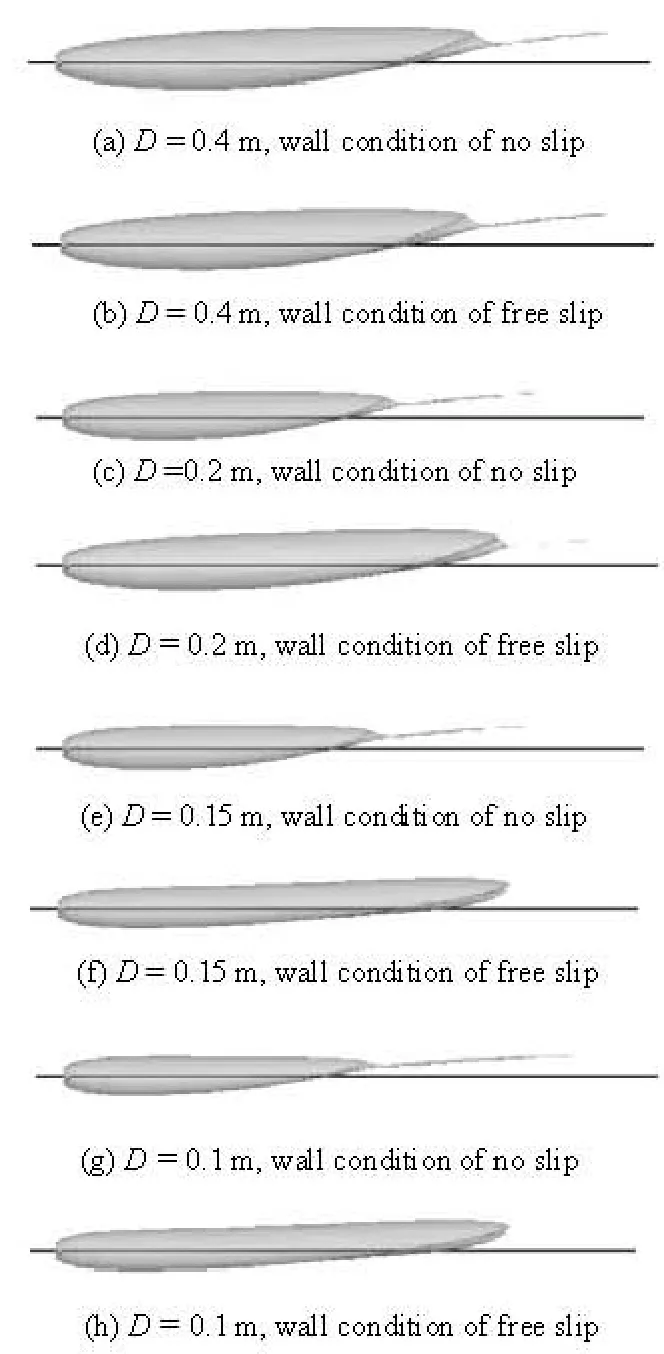
Fig.9 Supercavity shape with or without viscous effect of wall
Figure 9 shows the influence of the viscous effect of the wall on the supercavity shape. It can be seen that the viscous effect decreases the supercavity scale, and with a diameter of 0.40 m, the viscous effect is small as compared with that in the infinite flow field. The scale of the supercavity decreases with the decrease of the diameter of the water tunnel. The up-floating phenomena of cavity becomes weak and the position of the maximal diameter moves forward. The assumption that under all working conditions, we will have the same pressure distributions at the“outlet” should be emphasized again.
The phenomenon may be explained by Figs.10 and 11 combining with Eqs.(16)-(18). The explanation comes from the pressure drop due to the viscous effect of the wall. The flow in the water tunnel is turbulent due to the high Reynold number in this article. And the route loss in the water tunnel can be calculated as follows.
where λ is the route coefficient.

Fig.10 Influence of viscous effect of the wall on the pressure distribution on the centerline of the water tunnel
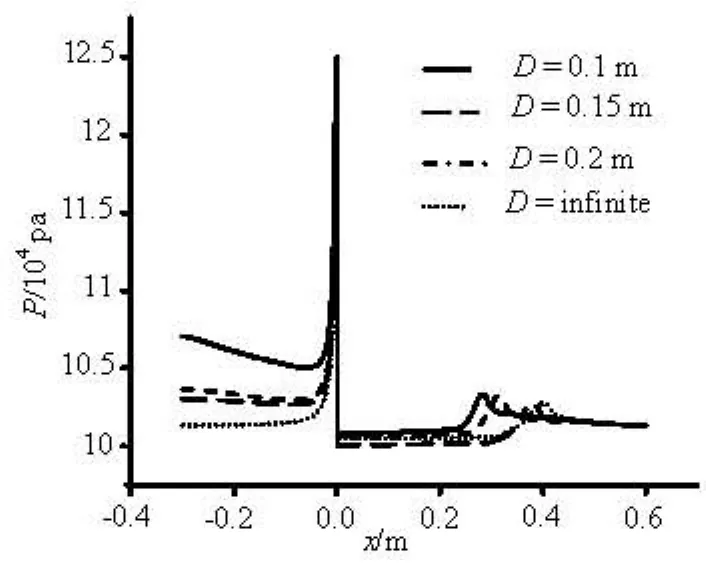
Fig.11 Pressure distribution on the pressure centerline of water tunnel with different diameters of water tunnel
When the velocity and the pressure at the outlet keep unchanged, the value of hfincreases with the decrease of the diameter of the water tunnel so that the pressure increases along the adverse direction of the free velocity thus enhancing the local pressure. It can be speculated similarly that the static pressure will decrease along the direction of the free stream velocity keeping the static pressure constant on the inlet and the supercavity scale increases with the decrease of the diameter of the water tunnel.
Figure 12 shows the reasonable p∞positions obtained from empirical formula. The positions deviate from the centerline of the cavitator more and more with the increase of the diameter of the water tunnel. When the diameter is large enough, the blocking effect could be ignored and the viscous effect of the wall is relatively weak, the supercavity becomes sharper and the parameters of the flow fieldare similar with those in the infinite flow field. The cavitation number could be obtained by Eq.(14) combining with the length or the maximal diameter of the cavity obtained from simulation results. On the other hand, the reasonable pressure detecting point is difficult to determine because the position varies with the different water tunnel diameters and flow field conditions.
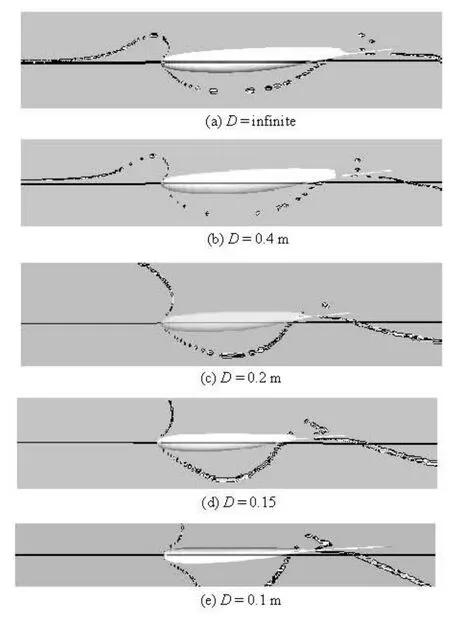
Fig.12 The reasonablep∞positions obtained from empirical formula
In fact, the viscous effect not only results in the variation of the local pressure in the water tunnel but also enhances the blocking effect because of the existence of a turbulent boundary layer.
5. Conclusions
In this article, the differences of supercavity shape in a water tunnel and in the infinite flow field are investigated by utilizing the 3-D numerical simulations. The numerical method is validated by empirical formulas and water tunnel experiments. In simulations, the blocking effect can be studied separately.
A water tunnel may be characterized by two facts: the viscous effect of the wall and the blocking effect due to the small diameter.
The blocking effect affects the supercavity shape seriously including the cavity length and diameter and with different variation laws. The obvious result is the slenderness ratio increases with the extent of the blocking effect. The maximal diameter of the supercavity decreases with the decrease of the water tunnel diameter. On the other hand, the up-floating phenomena of supercavity disappears gradually when the blocking effect becomes serious.
The viscous effect makes the local pressure change rapidly especially for a water tunnel of a small diameter, mainly due to the route loss of the water tunnel. The supercavity scale decreases with the decrease of the water tunnel diameter because the local pressure increase results in an increase of the cavitation number. In all working conditions, it is assumed that the absolute pressure on the outlet would keep the same. On the other hand, the supercavity scale increases when in all working conditions, a uniform pressure is kept on the inlet.
Therefore, the wall of the water tunnel should be smooth to reduce the pressure drop as far as possible, a large diameter reduces not only the blocking effect but also the pressure drop. Without considering the blocking effect, the pressure drop can be avoided by using the water tunnel with an expansion angle. The further investigations are necessary to be carried out in all kinds of working conditions to give the right corrections.
[1] ZHANG Xue-wei, WEI Ying-jie and ZHANG Jia-zhong. Experimental research of the shape of the shape characters of natural and ventilated supercavitation[J]. Journal of Hydrodynamics, Ser. B, 2007, 19(5): 564-571.
[2] JIA Li-ping, WANG Cong and WEI Ying-jie et al. Numerical simulation of aitificial ventilated cavity[J]. Journal of Hydrodynamics, Ser. B, 2006, 18(3): 273-279.
[3] FENG Xue-mei, LU Chuan-jing and HU Tian-qun. Experimental research on a supercavitating slender body of revolution with ventilation[J]. Journal of Hydrodynamics, Ser. B, 2002, 14(2): 17-23.
[4] JIANG Zeng-hui, YU Kai-ping and ZHANG Jia-zhong et al. Research on strut mounting position on experimental model for hydrodynamic character investigation of the aft section of underwater supercavitating bodies[J]. Mechanical Science and Technology, 2007, 26(12): 1648-1651(in Chinese).
[5] WOSNIK M., SCHAUER T. J. and ARNDT E. A. Experimental study of a ventilated supercavitating vehicle[C]. Fifth International Symposium on Cavitation (CAV2003). Osaka, Japan 2003, Cav03-OS-7-008.
[6] LEE Qi-tao, XUE Lei-ping and HE You-sheng. Experimental study of ventilated supercavities with a dynamic pitching model[J]. Journal of Hydrodynamics, 2008, 20(4): 456-460.
[7] JIANG Zeng-hui, YU Kai-ping and ZHANG Jia-zhong. Experimental research on shape and drag character ofventilated supercavity on underwater bodies[J]. Engineering Mechanics, 2007, 24(4): 152-158(in Chinese).
[8] WEI Ying-jie, ZHANG Jia-zhong and Wang Cong et al. Experimental research on the shape characters of natural and ventilated supercavitation[J]. Journal of Hydrodynamics, Ser. B, 2007, 19(5): 564-571.
[9] LIU Yan-Wei, LIU Ying. Numerical simulation of the effect of blockage ratio on drag measurement in water tunel test[J]. Experimental Technology and Management, 24(12): 44-47(in Chinese).
[10] CHEN Xin, LU Chuan-jing and LI Jie et al. The wall effect on ventilated cavitating flows in closed cavitation tunnels[J]. Journal of Hydrodynamics, 2008, 20(5): 561-566.
[11] LIU Yu-qiu, YU Kai-ping and ZHANG Jia-zhong. Numerical simulation and comparison on drag reduction of non-streamline submerged body[J]. Engineering Mechanics, 2007, 24(2): 178-182(in Chinese).
[12] FU Hui-ping, LU Chuan-jing and WU Lei. Research on characteristics of flow around cavitating body of revolution[J]. Journal of Hydrodynamics, Ser. A, 2005, 20(1): 84-89(in Chinese).
[13] JIANG Zeng-hui, YU Kai- ping and ZHANG Jia-zhong et al. Numerical simulation on character of the cavity wake region[J]. Journal of Ship Mechanics, 2008, 12(2): 225-230(in Chinese).
[14] CHEN Xin, LU Chuan-Jing. Numerical investigation of ventilated cavitating flow around a 2D symmetry foil[J]. Journal of Hydrodynamics, Ser. A, 2006, 21(1): 62-68(in Chinese).
[15] KUNZ R. F., GIBEKING H. H. and MAXEY M. R. et al. Validation of two-fluid Eulerian CFD modeling for microbubble drag reduction across a wide range of Reynolds numbers[J]. ASME, 2007, 129(66): 66-79.
[16] MENTER F. R. Ten years of industrial experience with the SST turbulence model[C] Proc. of the 4th International Symposium on Turbulence, Heat and Mass Transfer. New York, USA: Begell House, Inc., 2003, 4: 625-632.
10.1016/S1001-6058(09)60104-9
* Project supported by the Major National Natural Science Foundation of China (Grant No. 10832007).
Biography: ZHOU Jing-jun (1981-), Male, Ph. D.
 水動(dòng)力學(xué)研究與進(jìn)展 B輯2010年5期
- 水動(dòng)力學(xué)研究與進(jìn)展 B輯的其它文章
- NUMERICAL SIMULATION OF THE ENERGY DISSIPATION CHARACTERISTICS IN STILLING BASIN OF MULTI-HORIZONTAL SUBMERGED JETS*
- ANALYSIS OF EDL EFFECTS ON THE FLOW AND FLOW STABILITY IN MICROCHANNELS*
- EXPERIMENTAL INVESTIGATION ON THE DRAG REDUCTION CHARACTERISTICS OF TRAVELING WAVY WALL AT HIGH REYNOLDS NUMBER IN WIND TUNNEL*
- NUMERICAL MODELING PURIFICATION PERFORMANCE OF POT TEST*
- NUMERICAL STUDY OF CAVITATION ON THE SURFACE OF THE GUIDE VANE IN THREE GORGES HYDROPOWER UNIT*
- A NEW METHOD FOR NUMERICAL SIMULATION OF TWO TRAINS PASSING BY EACH OTHER AT THE SAME SPEED*