
PRE-CORROSION FATIGUE NOTCH FACTOR
2011-10-08 12:10:00ZhangChuanYaoWeixingYuJianhang
Zhang Chuan,Yao Weixing,Yu Jianhang
(1.Collegeof Aerospace Engineering,NUAA,29 Yudao Street,Nanjing,210016,P.R.China;2.Department of Mechanism,Army Aviation Insititute of PLA,Beijing,101116,P.R.China)
INTRODUCTION
Aluminum alloy has become themain materials of aircraft structure due to its inherent high specific strength,specific stiffness and superior fatigue property.Although the ratio of titanium alloy and compositehas increased in the new generation aircraft,aluminum alloy has remained the main structure material.As the problem of calendar lifeof aircraft structure has become morecritical,corrosion and corrosion fatigue of aluminum alloy have becomeone of the key problems on the life assessment of aircraft structure.
A large amount of research on corrosion and corrosion fatigue behavior of aluminum alloy are conducted[1-3].A seven-stage model of corrosion fatigue process which is proposed by Pan and Mahadevan Sankaran[4]is pit nucleation,pit growth,transition from pitting to fatigue crack nucleation,short crack grow th,transition from short crack to long crack,long crack growth,and fracture.Yanlin Hu[5]explained the evolvement of pitting attack damage by occluded cell autocatalytic principle.Additionally,Z Khan and M Younas[6]predicted the corrosion fatigue life for notched components based on the local strain and linear elastic fracture mechanics concepts.However,there is little literature about pre-corrosion fatigue notch factor.
The stages of corrosion failure of aluminum alloy LC4CSin the atmospheric environment are pitting,intergranular corrosion and denudation.Because the specimens of aluminum alloy LC4CS soaked in EXCO solution could reappear this corrosion damage mode better,we adopt EXCO solution to research the variation of fatigue notch factor with corrosion time.Based on experimental observation,we explain the mechanism of variation of pre-corrosion fatigue notch factor with time,and then,identify a model of pre-corrosion fatigue notch factor verified by experiment.
1 EXPERIMENT
1.1 Specimen
The specimen is LC4CSaluminum sheet with thickness 2 mm.Specimen size is shown in Fig.1 and Table 1.The clamping segment and transition segment are protected by silica.The surface of the experimental segment is cleaned by ethanol.
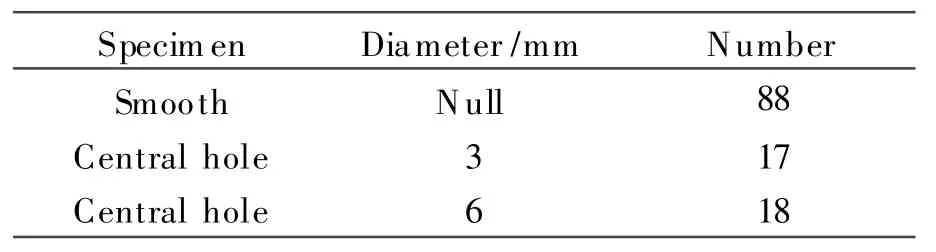
Table 1 Specimen specification
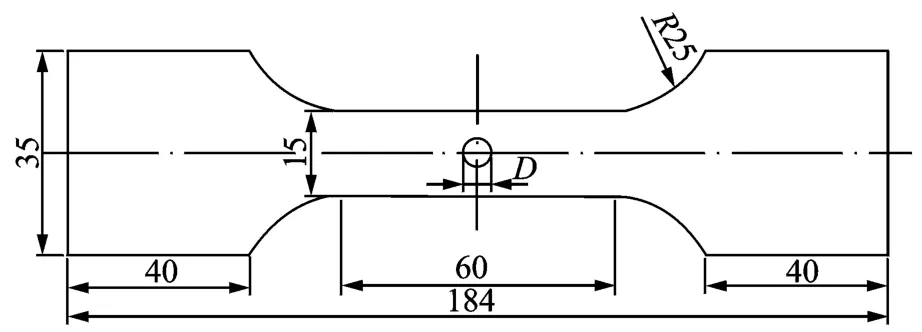
Fig.1 Specimen size
1.2 EXCO solution
EXCO solution is prepared according to HB5455-90.The ratio of solution volume and specimen surface area is 20 ml/cm2.Due to the long corrosion time,check the concentration of solution every 48 h and add proper amount of HNO3 to insure that p His 0.4.
1.3 Experimental process
Smooth specimens are tested by the MTS809 fatigue test machine after being soaked in EXCO solution and the pre-corrosion S-N curves of aluminum alloy LC4CSare determined.Fatigue life of pre-corrosion notched specimens under one stress level is also determined.
2 EXPERIMENTAL RESULT AND DISCUSSION
2.1 LC4CScorrosion process
The corrosion process of specimens in EXCO solution is similar to the description in Ref.[7].After specimens are soaked in EXCO solution,air bubbles appear on the surface and then,the surface slightly changes color.However,due to the protection of passive film,thereis no appearance of pitting and denudation.Then,as the failure of passive film,corrosion pitting appears and the edge of notch upswells slightly.The corrosion pitting expands along the directions which are parallel and perpendicular to surface and then,it makes the surface serrated.At this stage,because the corrosion pitting is shallow and the corrosion medium is adequate,corrosion rate is relatively high(Fig.2(a)).With additional soaking time,the corrosion rate declines,and bubbles on the surface of specimens appear and then ruptures.There is a denudation layer on the surface of the specimen after the bubbles ruptured.After specimens soaked for a specific period of time,the surface of the specimen is clearly delaminated and the color is clearly changed.Corrosion extends to the interior of matrix,and the surface metal completely denudes while serration is not obvious(Fig.2(b)).
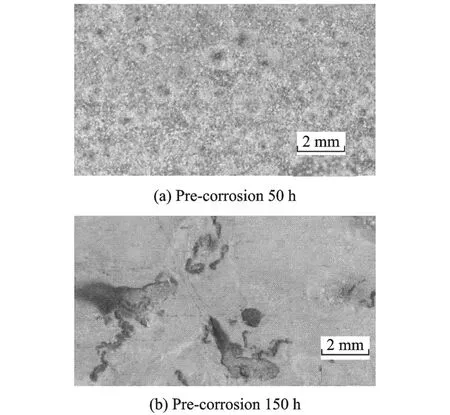
Fig.2 LC4CSspecimen after pre-corrosion
2.2 Variation of stress distribution in root of notch due to corrosion
Pre-corrosion fatigue notch factor K fC is defined as
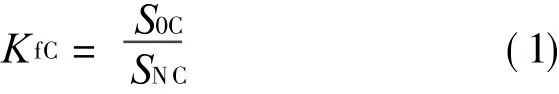
where S0C is the pre-corrosion fatigue strength of smooth specimen and S NC the pre-corrosion fatigue strength of notch specimen.
It is assumed that there is a corrosion pitting i near the notch,and the coupling effect is neglected because the pitting is rather small.This corrosion pitting i would cause a local stress field(Fig.3).Based on force balance,we can get

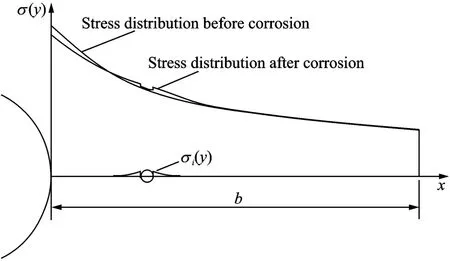
Fig.3 Stress distribution when pitting near notch
For specimen without corrosion pitting,its force balance equation is where e i(y)is the stress distribution in y=0 caused by corrosion pitting i,n the number of corrosion pitting,e(y)the stress distribution in y=0 caused by load P beforecorrosion,and b the ligament width.
Deduced from Eq.(3),if external load P is kept constant,the maximum stress value of the notch would decrease because corrosion pitting would lead to the increase of its ambient stress.Therefore,the stress concentration factor of notch specimen after corrosion would reduce with the increasing of number and depth of corrosion pitting.
In the stage of denudation,surface of specimen tends to smooth and the weaken effect of maximum stress value caused by corrosion pitting will decrease.So,the maximum stress value of notch will increase and finally tends to the maximum stress value of smooth specimen.
2.3 Experimental result
Four S-N curves,in which pre-corrosion time is different,are obtained based on the fatigue experiment.In this paper,the model of S-N curve found in Ref.[8]is used to fit the experimental data(Fig.4).
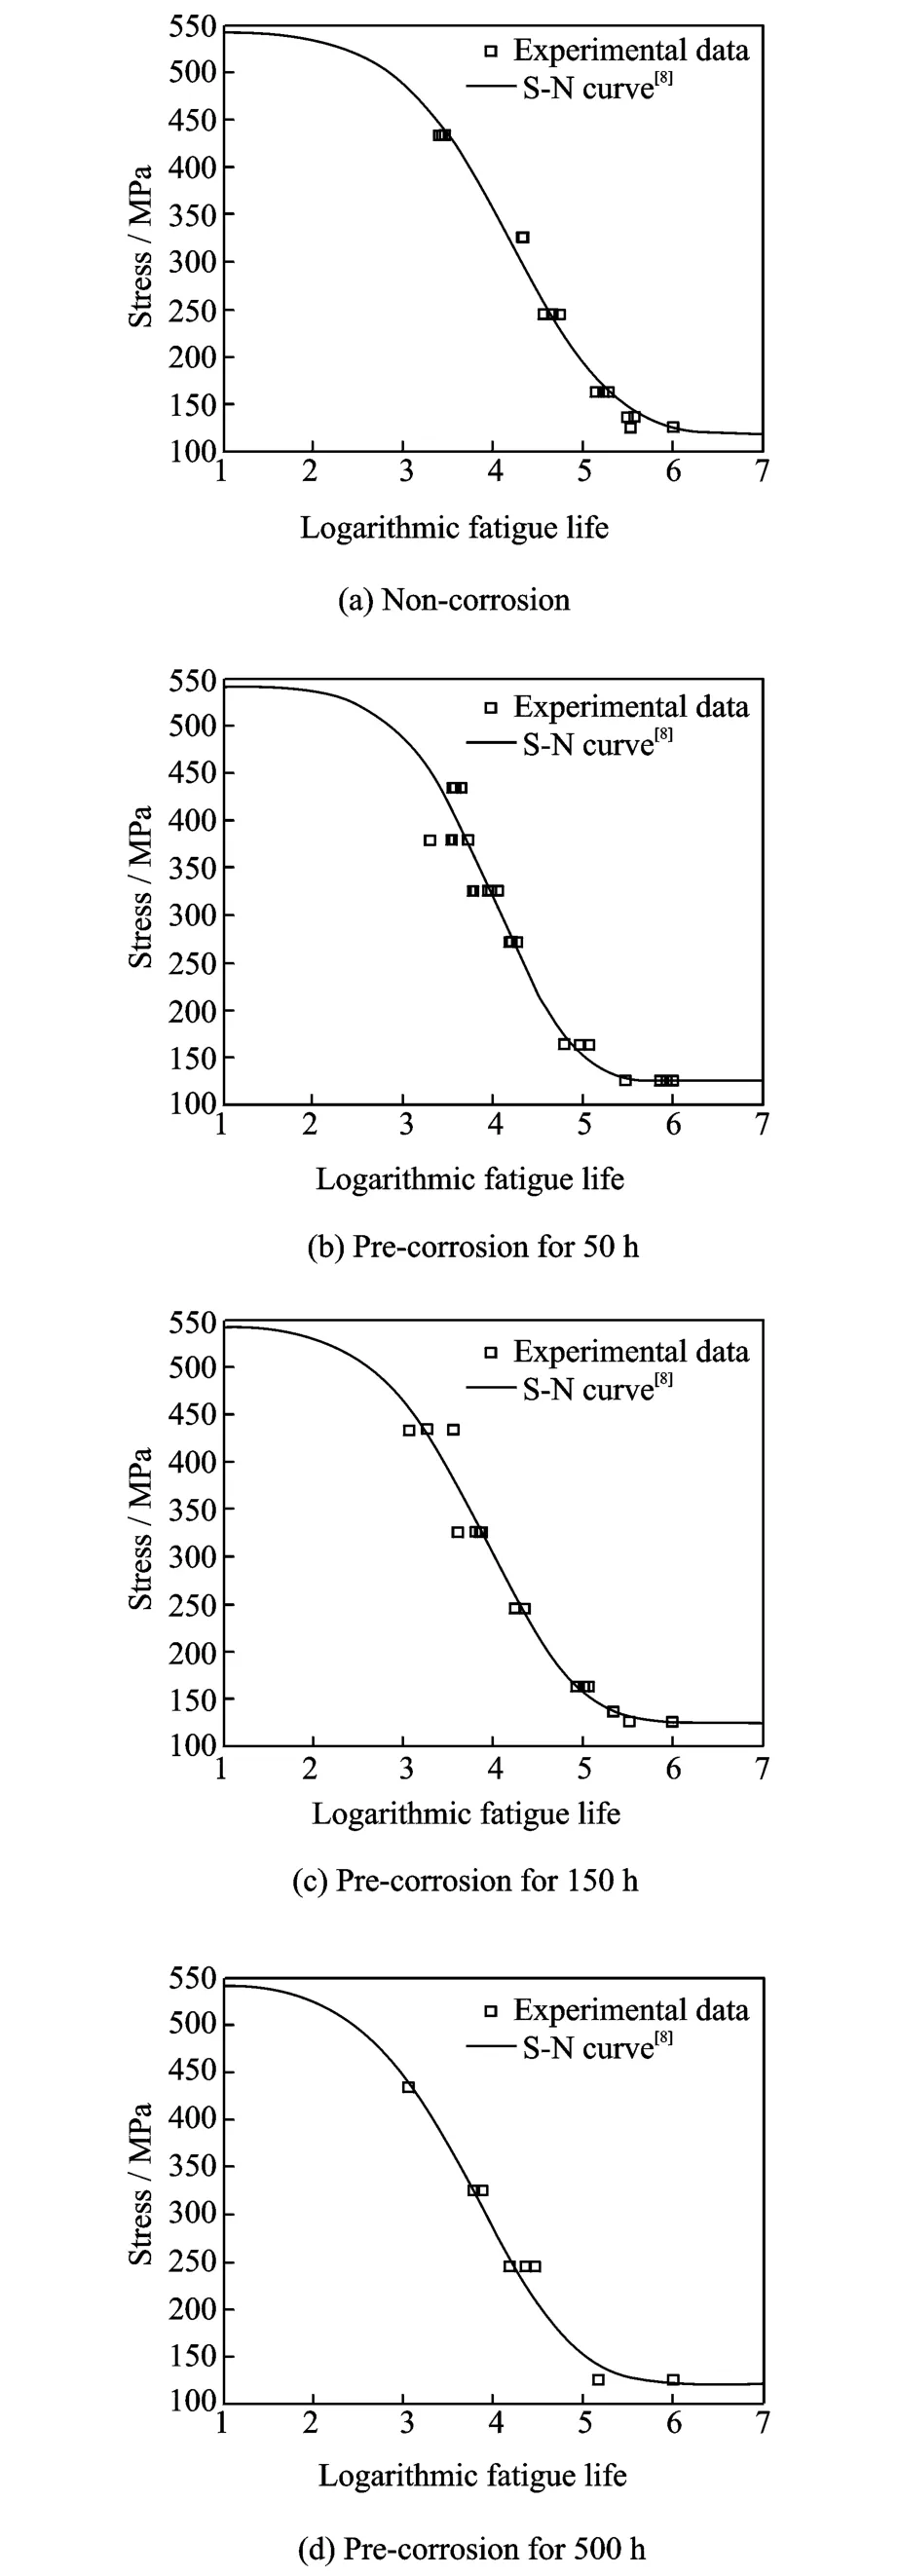
Fig.4 S-N curves with different pre-corrosion time
Fatigue strength of notch specimen SNCand its corresponding mean life N C are obtained by experiment.From Fig.4,we obtain corrosion fatigue strength S0C relative to mean life N C.Then,pre-corrosion fatigue notch factor is calculated by Eq.(1).Experimental values of pre-corrosion fatigue notch factor of specimen with central hole are shown in Table 2.
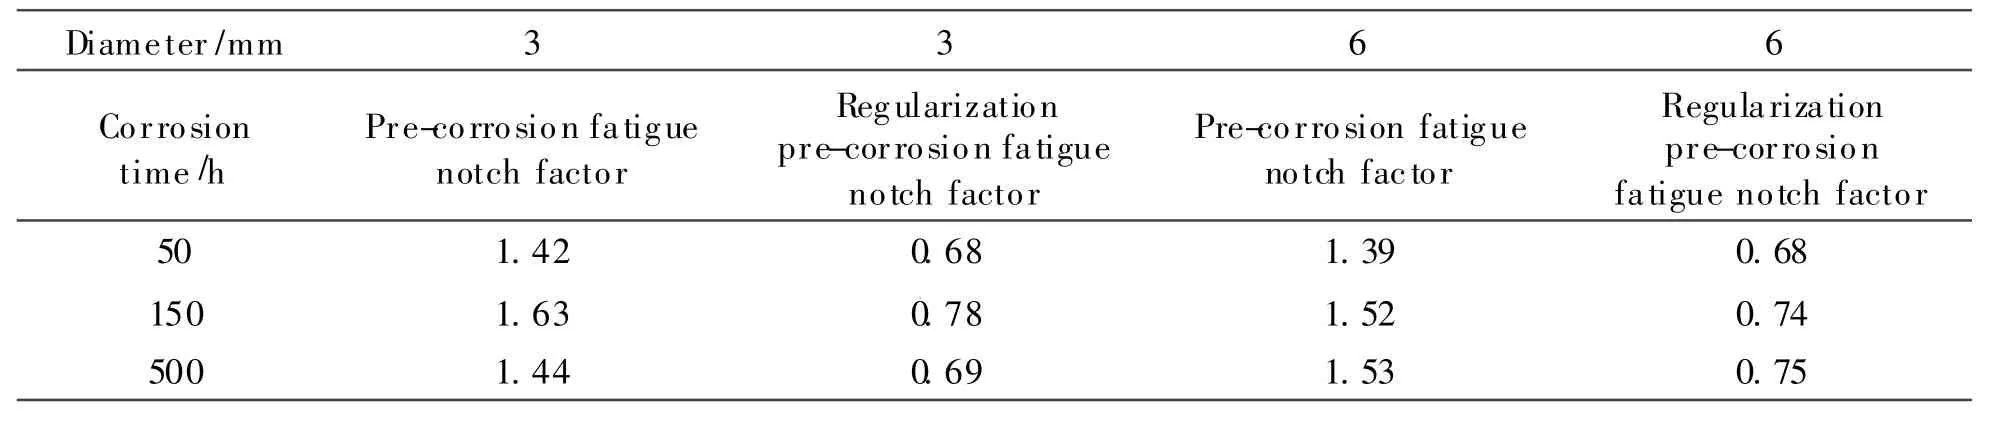
Table 2 Pre-corrosion f atigue notch f actor of specimen with central hole
2.4 Pre-corrosion fatigue notch f actor model
Field intensity method[9]is based on the idea that fatigue notch factor depends on stress distribution of notch root.The pre-corrosion fatigue notch factor K fC of specimens does not decrease obviously at the beginning of corrosion.However,its value declines quickly when a large number of corrosion pittings appear.At the stage of denudation,pre-corrosion fatigue notch factor K fC increases slowly and tends to pre-corrosion fatigue notch factor K f C of the smooth specimen.So,pre-corrosion fatigue notch factor KfC(t)is the function of time t,it meets three basic conditions:
(1)K f C(0)=K f,non-corrosion fatigue notch factor;
(2)K f C(∞)=K f,ideal uniform corrosion fatigue notch factor;
(3)K f C(t)<K f.
where K f is conventional fatigue notch factor.
According to the corrosion mechanism of aluminum alloy,the regularization pre-corrosion fatigue notch factor model is
where C(t)is the regularization pre-corrosion fatigue notch factor,K f Cminthe minimum of pre-corrosion fatigue notch factor,b the position parameter,which mainly relates to corrosion sensitivity of material and is determined by the time that pitting transformed into denudation,c the change rate of K fC and influenced mainly by corrosion character of material.
3 EXPERIMENTAL VERIFICATION
In order to verify the applicability of this model for different notch geometries simultaneously,we chose LC4CSaluminum sheet with slot and its thickness is 2 mm.The total number is 18.Geometry size of specimen is shown in Fig.5.
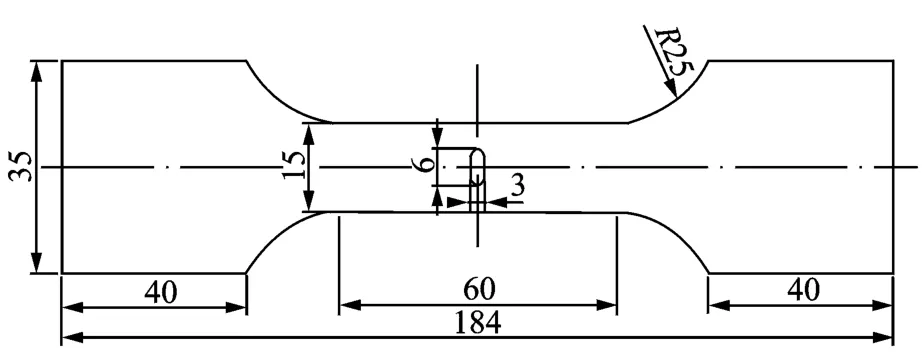
Fig.5 Geometry sizeof specimen with slot
The experimental values of pre-corrosion fatigue notch factor of specimens with slot are obtained by the same way as in Section 2.3.Precorrosion fatigue notch factor and regularization pre-corrosion fatigue notch factor of specimens with slot in three different corrosion time are shown in Table 3.The fatigue notch factor,which is calculated according to the Peterson formula,is 2.43.The values of b,c and K fCminof three different notch specimens are shown in Table 4.The change curve of pre-corrosion fatigue notch factor of specimens with slot and central hole are shown in Fig.6.
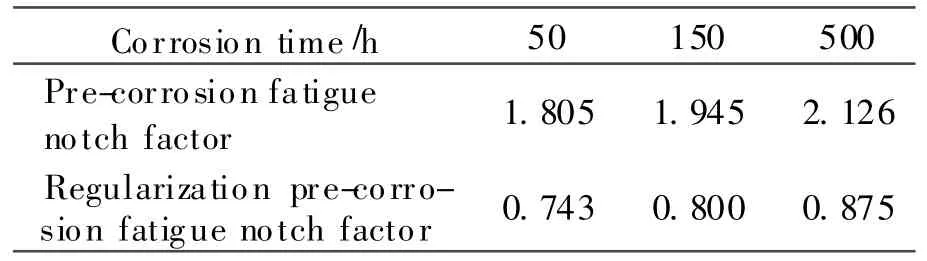
Table 3 Precorrosion fatigue notch f actor of specimens with slot
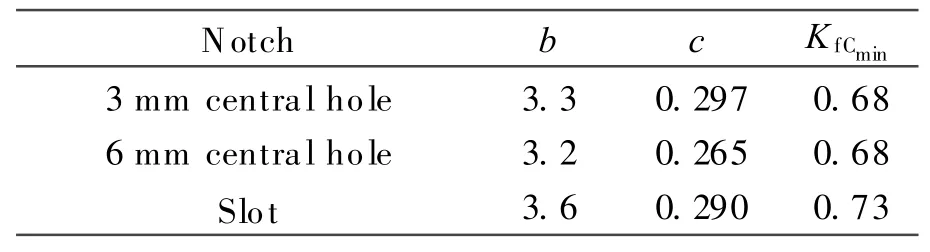
Table 4 Parameter value of regularization pre-corrosion fatiguenotch factor
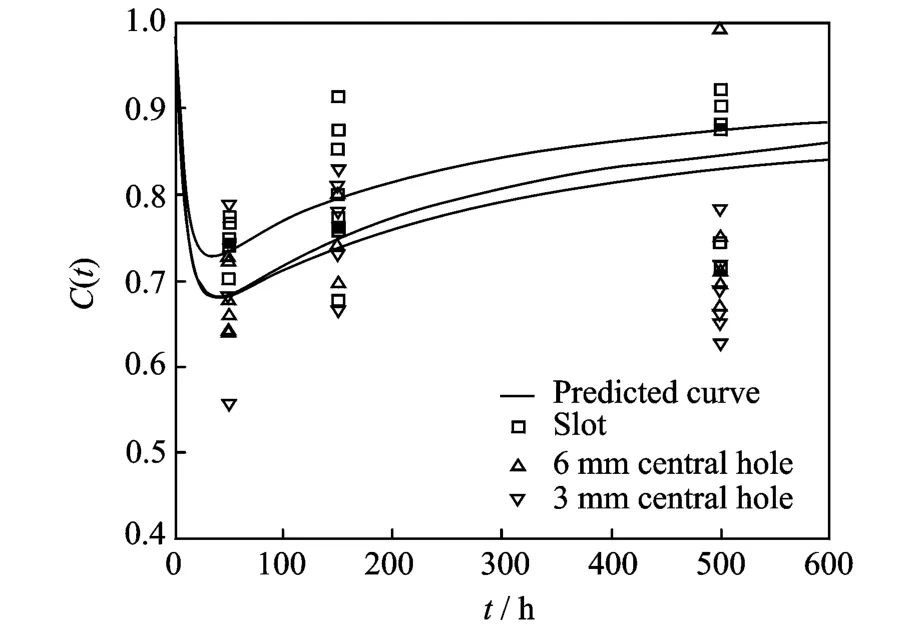
Fig.6 Comparison between experimental result and prediction result
The curve of specimens with slot is in good agreement with experimental data.However,the curves of specimens with central hole are not in good agreement with experimental data at the point of 500 h.This result might be caused by dispersion of corrosion and fatigue experiment.
The coefficients of variation of pre-corrosion fatigue notch factor of specimens are shown in Table 5.The data are all large and do not have any law.So,we cannot give any definite conclusion about dispersion of pre-corrosion fatigue notch factor as the function of time.
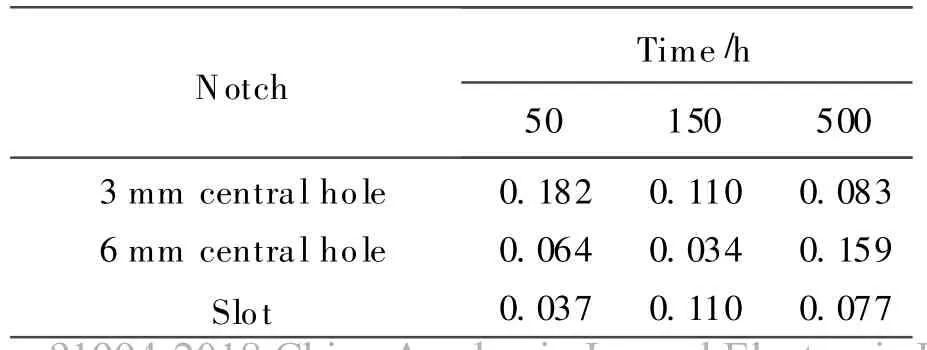
Table 5 Coefficient of variation of pre-corrosion f atigue notch factor
4 CONCLUSIONS
The pre-corrosion fatigue notch factor model describes the variation of fatigue notch factor that decreases at first and then increases with the increasing pre-corrosion time.Finally,this model is verified by experiment.The results show that:
(1)Variation of model fits the actual corrosion process and interprets the change mechanism very well;
(2)This model could be obtained by a few experimental data;
(3)This model demonstrates that the precorrosion fatigue notch factor reaches the lowest point at the significant pitting stage when the number of corrosion pitting reaches the maximum.However,the significant pitting stage is just a conceptive time and does not have a precise definition.So,the definite time that pre-corrosion fatigue notch factor reaches the lowest point needs further research.
[1] Nguyen T H,Foley R T.On the mechanism of pitting of aluminum[J].Journal of the Electrochemical Society,1979,126(11):1855-1860.
[2] Szklarska-Smialowska Z.Pitting corrosion of aluminum[J].Corrosion Science,1999,41(9):1743-1767.
[3] Dolley E J,Lee B,Wei R P.The effect of pitting corrosion on fatigue life[J].Fatigue&Fracture of Engineering Materials& Structures,2000,23(7):555-560.
[4] Pan Shi,Sankaran M.Probabilistic estimation of pitting corrosion fatigue life[R].A00-24751,2000.
[5] Hu Yanling,Li Di,Guo Baolan.Statistical study of corrosion dynamics law and method to predict calendar life for LY12CZ aluminum alloy[J].Journal of Aeronautics,2000,21(S):53-57.(in Chinese)
[6] Khan Z,Younas M.Corrosion-fatigue life prediction for notched components based on the local strain and linear elastic fracture mechanics concepts[J].International Journal of Fatigue,1996,18(7):491-498.
[7] Cao Fahe,Cheng Yingliang,Zhang Zhao,et al.Features of electrochemical noise during pitting corrosion of LC4aluminum alloy in 2.0%NaCl solution[J].The Chinese Journal of Nonferrous Metals,2002,12(S1):245-249.(in Chinese)
[8] Wu Fuqiang,Yao Weixing.A new model of the fatigue life curve of materials[J].China Mechanical Engineering,2008,19(13):1634-1637.(in Chinese)
[9] Yao Weixing.Stress field intensity approach for predicting fatigue life[J].International Journal of Fatigue,1993,15(3):243-245.
 Transactions of Nanjing University of Aeronautics and Astronautics2011年4期
- Transactions of Nanjing University of Aeronautics and Astronautics的其它文章
- VOLUMETRIC-SWEPT DISPLAY SYSTEM BASED ON HELIX ROTATING SCREEN AND DMD
- OPTIMIZATION DESIGN METHOD FOR INPUT IMPEDANCE MATCHING NETWORK OF LOWNOISE AMPLIFIER
- MODELING AND SIMULATION OF E1784K MUTATION AND SODIUM IONIC CHANNEL DISEASES
- DIRECT SELF-REPAIRING CONTROL FOR HELICOPTER VIA QUANTUM CONTROL AND ADAPTIVE COMPENSATOR
- CHARACTERISTICSOF FAN STALLING BASED ON CORRELATED DIMENSIONS
- HYBRID SCHEME FOR COMPRESSIBLE TURBULENT FLOW AROUND CURVED SURFACE BODY