
CHARACTERISTICSOF FAN STALLING BASED ON CORRELATED DIMENSIONS
2011-10-08 12:10:02GuYongxiaZhouZhongningLiYimin
Gu Yongxia,Zhou Zhongning,Li Yimin
(1.College of Mechanical Engineering,Beijing Technology and Business University,Beijing,100037,P.R.China;2.College of Electric Power Engineering,China University of Mining and Technology,Xuzhou,221008,P.R.China)
INTRODUCTION
The fan flowing with a contra-rotating axis owns a complex non-linear system.It has been a challenge for a long time to observe the fan running state and to diagnose if it runs wrong or smoothly. Pressure signal in this kind of fans consists of rich state information,which is valuable for monitoring the fan running state.With the chaos and fractal theory to study nonlinear dynamic systems,we can grasp the law[1].In this paper,the method for non-linear dynamics analysis is used to analyze pressure data and to calculate correlated dimensions[2]in normal state and in stalling state.
1 FRACTAL THEORY
1.1 Phase-space reconstruction based on time sequences
Phase-space reconstruction, a method for time sequences with a single variable,is applied in this paper.For discrete time sequences which delay for time f,its auto-correlated function can be expressed as[3]
Time delay is f and y(t),y(t+f),y(t+2f),…,y(t+ (m-1)f)are chosen as coordinates.An m-dimensional space is constructed.The situation showing how the trajectories are distributed and indicating that their structures(attractors)of this reconstructed phase space can reflect the system movement.Because three is the maximum dimension drawn out visually,chose the symbol m to be 2 or 3 in that we need to scratch the surface how the system feature varies according to the performance of the attractor of the phase space.When the system features are analyzed,we can see that the attractors in the 2-Dphase plane which is represented as[y(t),y(t+f)]or in thd 3-D phase space which is represented as[y(t),y(t+f),y(t+ 2f)]reconstructed are similar to the ones in the phase plane represented as(y,?y)or the phase space represented as(y,?y ,¨y).First of all,when the trajectories of the reconstructed phase space tend to a point at last(That is,the attractor mentioned above is a point),it means that the system is stable.Secondly,if the trajectories eventually form a curve which is able to close down(The attractor is such a curve),it indicates that the system is in a periodic motion.Again,if the trajectories finally accumulate mussily into a limited confine,it means that the system is in a random motion.Furthermore,if there are some special structures(so-called strangeattractors)in the distribution of trajectories,the system movement will be chaotic[4].
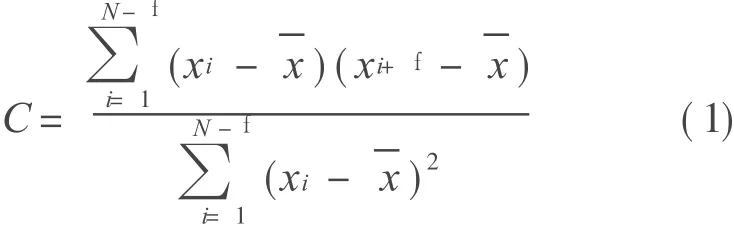
1.2 Correlated dimension
In fractal theory,many scholars define the concept of fractal dimension from many different angles.However,correlated dimension,having a clearer sense of time sequences,is a method which can calculate much moreaccurate and easy.
Let′s take a pair of points in an m-D phase space for instance

Euclidean distance between them is X ij(m)

A critical distance X(X is a small positive number)is given and it is the radius of a super ball in the m-D space.We get thenumber of pairs of points,whose distance between each other is less than X,and it is recorded as follows what proportion these pairs accounted for in all pairs
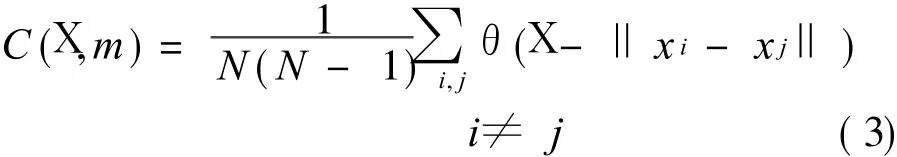
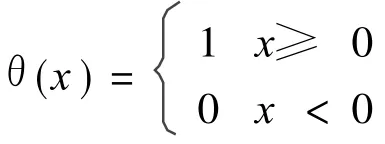
In the equations above,N=n-(m-1),f means the phase point,andθmeans Haiweisaide(Heaviside)function and it meets
Select a proper radius X of a super ball,and in scale-scale zones there exist

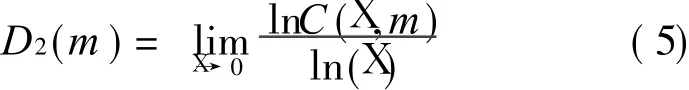
where D 2(m)means the correlated dimension.
2 TEST RESULTSAND NONLINEAR ANALYSIS
2.1 Acquisition of pressure data of f low fields[5]
A KDF-5 fan which flows with a contrarotating axis and low no iseis used in this paper.The of the fluid-solid coupling test rig of the impeller system is shown in Fig.1.The dynamic pressure sensors are used to measure the pressure fluctuation of the fan in different conditions and to acquire basic experimental data,as shown in Fig.2.The main parameters of the fan are that the fan flows at a speed varing from 125 m3/min to 250 m3/min,the total pressure varing from 300 Pa to 2 800 Pa,the rated power 2*5.5 kW,and the rated speed 2 940 r/min.In addition,the main parameters of the fan in the first stage are eight blades,variable cross section of distortion curve.On the other hand,the main parameters of the fan in the second stage are six blades,variable cross section of trapezoidal distortion.
UTek L V2007 system for the dynamic signals collection is used.Sample frequency is chosen as 5 120 Hz,which is a littlehigher for satisfying the needs of anti-mixed and digital filtering of data preprocessing in thefuture.To ensure accurate measurement,we set the sample data to be 1 024 or 2 048 and the sample time is set to be 3.41 min and 6.83 min.In the test,the speed of the fan is 2 940 r/min and thesamplefrequency is 5 120 Hz.The 3 072 sample data areequivalent to the information of the fan that rotates for 30 times.The analysis result can fully characterize the fan running information.

Fig.1 Test device
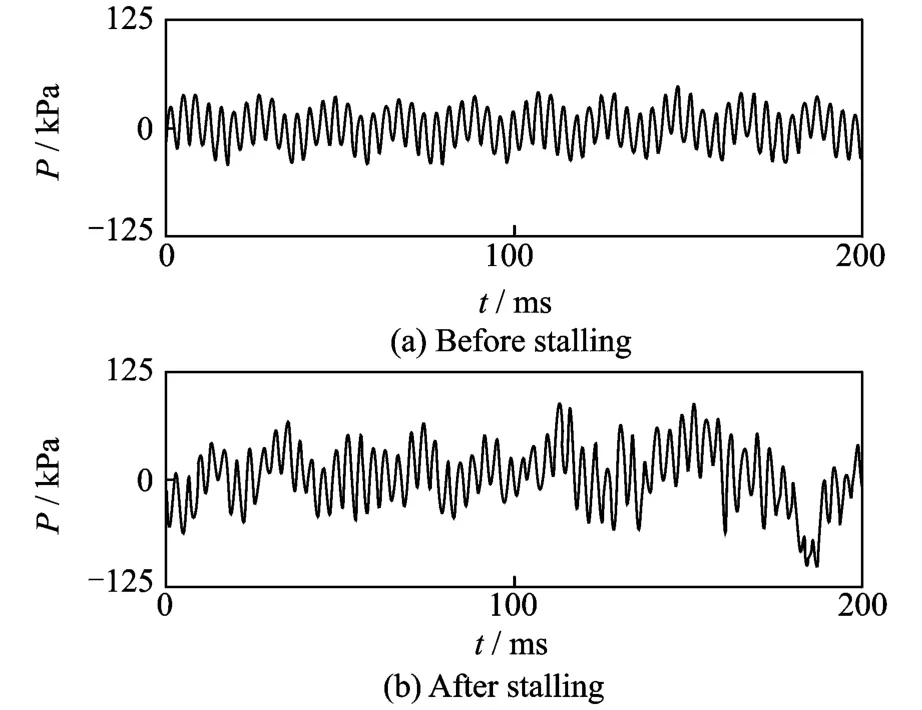
Fig.2 Pulse signal of air flow
2.2 Phase space reconstruction
The experimental method for analyzing the fan impeller system needs special methods to cope with because it may have many freedoms,and noise may have bad effects on it. To verify whether the system is chaotic,at first,we must get its attractor.However,what we get are just some data of time sequences of the pressure fluctuation in the flow field between the two levels of the impellers.If we had only such data,we would have inevitably lost a lot of information about the attractor evolution.Therefore,it is necessary to use the data of time sequences to reconstruct higher-dimensional phase space[6].
In this paper,the method to delay for a certain time is used to process the pressure data of the flow field between the fans which flow with two-level rotating axis and to reconstruct the phase spaceof the fan impeller system and attractors[7].When the delayed time is taken as 2,10,15,18,the attractor characters are given in Fig.3.
2.3 Selection of delay time based on correlated function
Auto-correlated function is used to analyze the collected pressure data,and f is set to be 18.
2.4 Correlated dimensions of impeller system attractors
Actual measured signal is often interfered with a great deal of other useless information and these noise signals having impact on the calculation of correlated dimensions[8],may lead to correlated dimensions that cannot converge to a stable value.Therefore,there will be a method to denoise for the signals which areabout to bemeasured before correlated dimensions arecalculated.Because wavelet analysis of the method to denoise for non-stationary signals has advantages that don′t exist in Fourier analysis at all,a soft threshold wavelet denoising method is chosen.The measured signals are firstly denoised,then the correlated dimensions are calculated.

Fig.3 Phase space and attractor
The value of X cannot be too large or the distances between all points and the point(xi,x j)cannot exceed it,so the equation C(X,m)=1 is not able to reflect thedynamic characteristics.At the same time,the value cannot be too small,or incidental noise will appear.According to plentiful analysis and calculation,the value of X ought to accord with the following equation:X=Xij(m)min+ 2(Xij(m)max-Xij標(m)min)/3.We chose a curve which can be drawn in accordance with the following formula:ln X-ln C(X,m).If we chose this kind of curve,the slope will not increase any longer with the increasing embedded dimensions.Then we could acquire correlated dimensions in different conditions.On the other hand,m should be chosen critically as well,when the curve is drawn according to the formula ln X-ln C(X,m).If m is too small,it may not be able to gain the saturated part of its slope.m ranges from 1 to 25 in this paper.This curve expressed by the formula ln X-ln C(X,m)has a saturated part in all conditions which are different from each other,that is,its slopeis a constant which will notvary with the change of m any more.
In order to distinguish correlated dimensions between the normal state of the fan and the stalling state of the attractors,and to analyze the data of the two states respectively,the following steps are performed.First of all,the correlated dimensions of the attractors of the pressuresignal before the stalling state must be obtained.Then the curves of the related integration ln C and the natural logarithm ln X of ultra-sphere radius are drawn,as shown in Fig.4.What′s more,curves of different dimensions are used to obtain their correlated dimensions and curves with embedded dimension in the same Cartesian coordinate system are drawn,as shown in Fig.5.In the normal working state of the fan,with the embedded dimensions increasing,the correlated dimensions of the pressure signals gradually tend to a fixed value,which is thecorrelated dimension of the pressure signal in the flow filed among the fans.
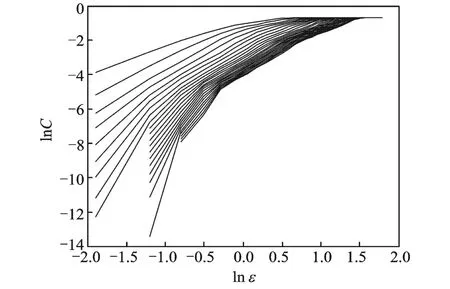
Fig.4 Lines drawn according to ln X-ln C before stalling
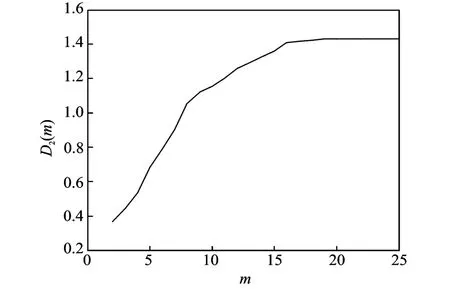
Fig.5 Embedded dimension and correlated dimension before stalling
The same method is used to calculate the correlated dimensions after the fan stalling so that the fractal characteristics of the stalling signals are studied.As shown in Figs.6-7,the correlated dimension decreases a little compared with the state before stalling.We can conclude that the correlated dimension drops from 1.428 before stalling to 1.198 after stalling.

Fig.6 Lines drawn according to ln X-ln C af ter stalling

Fig.7 Embedded dimension and correlated dimension af ter stalling
3 CONCLUSIONS
(1)Through the analysis of the pressure signals of the flow field before the fan stalling and the reconstruction of the phase space,the correlated dimensions of the corresponding state are obtained. The correlated dimension decreases from 1.428 before stalling to 1.198 after stalling.
(2)The results show that fractal analysis theory of complex signals is effective.The correlated dimensions are sensitive to the stalling signals of the fan and can be used as an important characteristic for the detection of the fan stalling.
[1] Liu Bingzheng,Pen Jianhua.Non-linear dynamics[M].Beijing:Higher Education Press,2004.(in Chinese)
[2] Gu Yongxia.Based on non-linear theory of turbomachinery fluid coupling of the rotor system[D].Beijing:College of Mechanical Engineering,China University of Mining,2007.(in Chinese)
[3] Xin Houwen.Fractal theory and its application[M].Beijing:China University of Technology Press,1993.(in Chinese)
[4] Yu Bo,Li Yinghong,Zhang Pu.Correlated dimension and Kolmogorov entropy in the diagnosis of faults of aircraft engines[J].Aerospace,2006(1):219-224.(in Chinese)
[5] Li Linlin,Huang Qibai.Research on air-structure coupling characteristic of fan blade[J].Fluid Machinery,2006,34(4):23-27.
[6] Gu Chaohong.Study on fluid-solid coupling dynamic characteristics for the component of hydraulic turbines[J].Large Electric Machine and Hydraulic Turbine,2006,6:47-52.
[7] Yao B H.Correlation dimension in fault diagnosis of 600 MW steam turbine generator[J].Journal of Donghua University,2005,22(1):31-36.
[8] Li Yimin,Zhou Zhongning.Investigation and numerical simulation of inner-flow of an axial mine flow Fan under low flow rate conditions[J].Journal of China University of Mining& Technology,2008,18(1):107-111.
 Transactions of Nanjing University of Aeronautics and Astronautics2011年4期
- Transactions of Nanjing University of Aeronautics and Astronautics的其它文章
- VOLUMETRIC-SWEPT DISPLAY SYSTEM BASED ON HELIX ROTATING SCREEN AND DMD
- OPTIMIZATION DESIGN METHOD FOR INPUT IMPEDANCE MATCHING NETWORK OF LOWNOISE AMPLIFIER
- MODELING AND SIMULATION OF E1784K MUTATION AND SODIUM IONIC CHANNEL DISEASES
- DIRECT SELF-REPAIRING CONTROL FOR HELICOPTER VIA QUANTUM CONTROL AND ADAPTIVE COMPENSATOR
- HYBRID SCHEME FOR COMPRESSIBLE TURBULENT FLOW AROUND CURVED SURFACE BODY
- PRE-CORROSION FATIGUE NOTCH FACTOR