
Can the biliary enhancement of Gd-EOB-DTPA predict the degree of liver function?
2012-07-07 01:00:45
Osaka, Japan
Can the biliary enhancement of Gd-EOB-DTPA predict the degree of liver function?
Masahiro Okada, Kazunari Ishii, Kazushi Numata, Tomoko Hyodo, Seishi Kumano, Masayuki Kitano, Masatoshi Kudo and Takamichi Murakami
Osaka, Japan
BACKGROUND: Excretion of gadolinium-ethoxybenzyl-diethylenetriamine pentaacetic acid (Gd-EOB-DTPA) in the bile may be related to liver function, because of elimination from the liver after preferential uptake by hepatocytes. The purpose of this study was to investigate the relation between liver and biliary enhancement in patients with or without liver dysfunction, and to compare the tumor-to-liver contrast in these patients.
METHODS: Forty patients [group 1: normal liver and Child-Pugh class A in 20 patients, group 2: Child-Pugh class B in 18 patients and Child-Pugh C in 2] were evaluated. All patients underwent MR imaging of the liver using a 1.5-Tesla system. T1-weighted 3D images were obtained at 5, 10, 15 and 20 minutes after Gd-EOB-DTPA injection. The relation between group 3 (total bilirubin <1.8 mg/dL) and group 4 (total bilirubin ≥1.8 mg/dL) was investigated at 20 minutes. Liver and biliary signals were measured, and compared between groups 1 and 2 or groups 3 and 4. Tumor-to-liver ratio was also evaluated between groups 1 and 2. Scheffé'spost-hoctest after two-way repeatedmeasures ANOVA and Pearson's correlation test were used for statistical analysis.
RESULTS: Liver enhancement showed significant difference at all time points between groups 1 and 2. Biliary enhancement did not show a significant difference between groups 1 and 2 at 5 minutes, but did at 10, 15 and 20 minutes. At 20 minutes, significant differences between groups 3 and 4 were seen for liver and biliary enhancement. At all time points, liver enhancement correlated with biliary enhancement in both groups. At 5 minutes and 20 minutes, statistical differences between groups 1 and 2 were seen for tumor-to-liver ratio.
CONCLUSIONS: The degree of biliary enhancement has a close correlation to that of liver enhancement. It is especially important that insufficient liver enhancement causes lower tumor-to-liver contrast in the hepatobiliary phase of Gd-EOBDTPA.
(Hepatobiliary Pancreat Dis Int 2012;11:307-313)
magnetic resonance imaging; Gd-EOB-DTPA; liver; bile duct; hepatobiliary phase
Introduction
Gadolinium-ethoxybenzyl-diethylenetriamine pentaacetic acid (Gd-EOB-DTPA, gadoxetic acid; Primovist?, Bayer Schering Pharma AG, Berlin, Germany) is a liver-specific contrast agent which facilitates lesion detection and characterization.[1-3]Gd-EOB-DTPA is now clinically available in many countries of the European, American and Asian continents.
Gd-EOB-DTPA is administered via bolus injection and is rapidly cleared from the intravascular space to the extracellular space, thus acting as both an extracellular and hepatocyte-specific contrast agent. Interestingly, Gd-EOB-DTPA is eliminated from the body through both the renal and hepatobiliary pathways.[4,5]Hamm et al[2]stated that Gd-EOB-DTPA is eliminated dose-independently in almost equal proportions from the hepatobiliary system and the kidney in healthy volunteers, thus 50% of the Gd-EOB-DTPA is excreted in the human biliary system.
To the best of our knowledge, only limited data regarding the quality of biliary duct and liver visualization with Gd-EOB-DTPA between liver cirrhosis and normal liver parenchyma are currently available.[6-9]Tschirch et al[7]found that the biliary enhancement after Gd-EOBDTPA injection in patients with liver cirrhosis resulted in a decreased or even non-visualization of the biliary system using a three-point scale to grade biliary visualization.Excretion of Gd-EOB-DTPA in the bile may be related to liver function, because of elimination from the liver after preferential uptake by hepatocytes. Regarding the relation between liver and biliary enhancement in the hepatobiliary phase, many questions remain to be answered, although new studies have attempted to determine the transporters for the enhancement in Gd-EOB-DTPA-enhanced MR.[10,11]Thus, we should appreciate the property of Gd-EOB-DTPA to provide liver and biliary enhancement as liver function. And we think it is especially important that insufficient liver enhancement causes a lower detection rate of hepatocellular carcinoma (HCC) as a critical issue in patients with liver cirrhosis compared with those without liver cirrhosis in the hepatobiliary phase of Gd-EOB-DTPA.
Hence, the purpose of our study was to investigate whether the degree of biliary enhancement can allow the image evaluation of liver enhancement, which is necessary for the detection of liver tumors.
Methods
Patients
Between February and March 2008, forty consecutive patients underwent Gd-EOB-DTPA-enhanced MRI to evaluate focal hepatic lesions (Table 1). Thirty-five patients had chronic hepatitis or liver cirrhosis (19 had HCC), and 5 had normal liver function (3 had a hepatic metastatic lesion from colorectal cancer without chronic hepatitis or cirrhosis). None had undergone transcatheter arterial chemoembolization or radiofrequency ablation at least one month before MRI examination. None had biliary stones and biliary obstruction.
Patients were divided into two groups. Group 1 consisted of 20 patients with normal liver function and Child-Pugh class A, and group 2 consisted of 18 patients with Child-Pugh class B and 2 with Child-Pugh class C.In each group, 20 consecutive patients were analyzed.
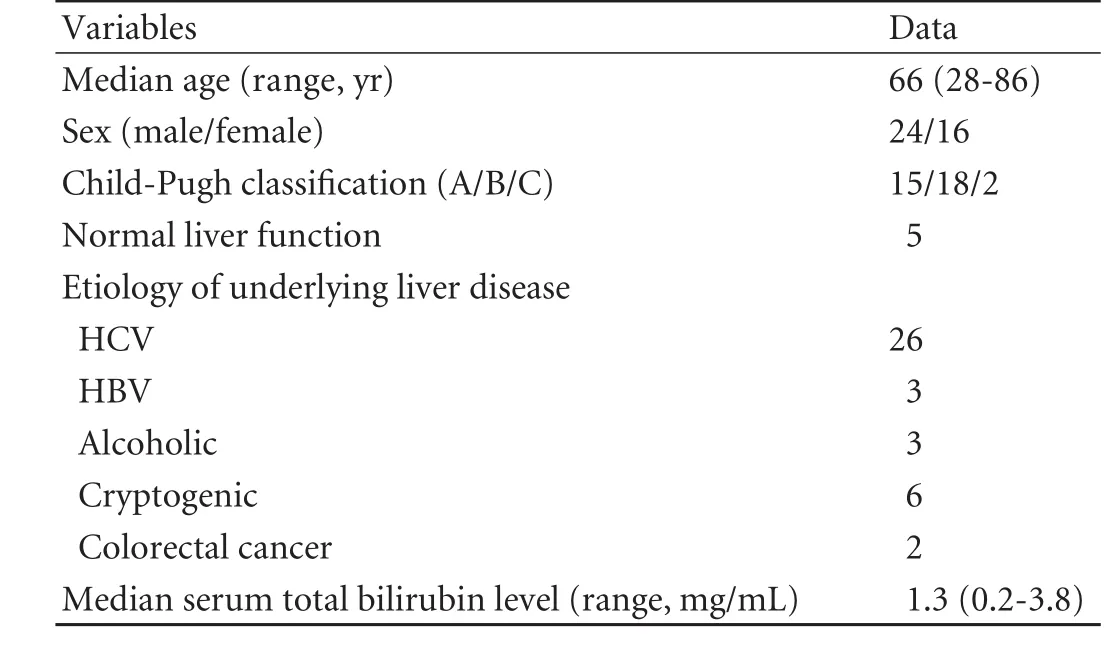
Table 1. Baseline characteristics of the 40 patients
In addition, from receiver-operating characteristics (ROC) analysis, 1.8 mg/dL of total bilirubin was adopted as the cut-off value of insufficient biliary enhancement at 20 minutes post-injection according to Tschirch et al.[7]When all patients were separated into two groups by cut-off value (group 3: total bilirubin <1.8 mg/dL and group 4: total bilirubin ≥1.8 mg/dL), liver and biliary enhancement effects were compared.
This study was conducted in accordance with the principles of theDeclaration of Helsinki.[12]The Ethics Committee at our institution deemed that approval of this study was unnecessary due to the retrospective character of the evaluation.
MR imaging
All patients underwent magnetic resonance (MR) imaging of the liver using a 1.5-Tesla system (Gyroscan NOVA, Philips Healthcare, Best, The Netherlands). An eight-channel phased-array surface coil was used and covered the whole liver. Gd-EOB-DTPA was used as a routine clinical study for detecting liver tumors. All patients received 25 μmol/kg body weight Gd-EOBDTPA, which was administered at 2 mL/sec though an IV line placed in the cubital vein and flushed with 30-36 mL of 0.9% saline at 2 mL/sec. A fat-suppressed T1-weighted gradient echo (GRE) sequence as 3D turbo field echo provided as a T1 high-resolution isotropic volume examination (THRIVE; TR/TR=2.13/4.31, flip angle 15°, field of view (FOV) 306×380 mm, matrix 512×512, thickness 5 mm, acquisition time 20 seconds) was obtained for each patient before and at 5, 10, 15, and 20 minutes after injection of Gd-EOB-DTPA. We obtained the arterial phase with the bolus tracking system to image optimal arterial enhancement of liver tumors. But this study was used for the investigation of liver and biliary enhancement, therefore the arterial phase of Gd-EOB-DTPA was not analyzed for this purpose, because no biliary enhancement was seen at this phase.
As other MR sequences in our routine clinical examination, T1-weighted images of dual echoes (in-phase and out-of-phase) were obtained before enhancement in a single breath hold. After injection of Gd-EOB-DTPA, T2-weighted images with fat suppression and diffusion weighted images were obtained at 3 to 10 minutes.
Imaging analysis
Liver enhancement
One observer (15 years of experience in abdominal radiology) measured the liver enhancement by evaluating the signal intensity (SI) change of hepatic enhancementfor all patients on a Dicom viewer (Synapse; FujiFilm Medical, Tokyo, Japan). Quantitative liver enhancement was calculated in the form of liver-to-muscle ratio (LMR). To evaluate the SI change of liver parenchyma of the T1-weighted GRE image (THRIVE), LMRs between the SI of liver parenchyma and the SI of erector spinae muscle were calculated at 5, 10, 15 and 20 minutes after injection of Gd-EOB-DTPA. The SI of liver parenchyma was calculated as the mean value of five regions of interest (ROIs; 50-100 pixels, 3 ROIs in the right lobe and 2 in the left lobe), which were taken in the liver parenchyma with exclusion of focal lesions, major branches of the portal and hepatic veins, and artifacts in the lateral segment affected by heart beat. A ROI was placed on a homogeneous area of liver parenchyma for each slice. The SI of erector spinae was calculated as the mean value of four ROIs, which were taken from 2 ROIs in the right erector spinae and two in the left with exclusion of ambient fat and artifact. Finally, liver enhancement by LMR was calculated as follows:
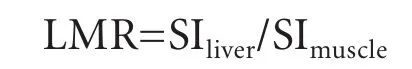
All LMRs were plotted over time, and mean and standard deviation (SD) were recorded.
Biliary enhancement
One observer (15 years of experience in abdominal radiology) measured the visualization of the common hepatic duct by evaluating the SI change of biliary enhancement for all patients on a Dicom viewer. The SI of biliary enhancement also used small ROIs within common hepatic ducts. Finally, bile duct-to-muscle ratio (BMR) was calculated as follows:
BMR=SIbileduct/SImuscle
All BMRs were plotted over time, and mean and SD were recorded.
In addition, comparison between groups 3 (total bilirubin <1.8 mg/dL) and 4 (total bilirubin ≥1.8 mg/dL) was performed to investigate the difference of liver and biliary enhancement at 20 minutes post-Gd-EOB-DTPA injection.
Tumor-to-liver ratio (TLR)
One observer (15 years of experience in abdominal radiology) measured the tumor intensity by evaluating the SI for all HCCs on a Dicom viewer. The SI of liver enhancement surrounding the HCC also used ROIs. Twenty-five HCCs (10 in group 1, 15 in group 2; >1 cm) in 19 patients were measured. Finally, TLR was calculated as follows:
TLR=SItumor/ SIliver
All TLRs were plotted over time, and mean and SD were recorded.
Estimated glomerular filtration rate (eGFR)
eGFR was measured and compared between groups 1 and 2, or groups 3 and 4. The following equations were used:
For men, eGFR (mL/min/1.73 m2)=194×Cr-1.094× age-0.287
For women, eGFR (mL/min/1.73 m2)=194×Cr-1.094× age-0.287×0.739
Cr: serum creatinine.
Statistical analysis
Scheffé's method ofpost-hoctest after two-way repeated-measures ANOVA was used to compare differences between the two groups (group 1 versus group 2, and group 3 versus group 4) in liver and biliary enhancement. The correlation between liver and biliary enhancement was investigated using Pearson's correlation test. The Statistical Package for Social Science Programming (version 11.0; SPSS, Chicago, IL) was used for analysis. APvalue <0.05 was considered statistically significant.
Results
Liver enhancement provided as LMR
Repeated-measures ANOVA showed a significant difference between groups 1 and 2 (between-groups:P=0.0005,F=14.23; time-line:P=0.0001,F=75.02; confounding factor:P=0.0001,F=14.38). The LMR showed significant differences at all time points after Gd-EOB-DTPA injection between groups 1 and 2, using Scheffé's method (Table 2). Compared with group 1, the increase in SI of the LMR over time was delayed in group 2 (Figs. 1 and 2).
Biliary enhancement provided as BMR
Patients showed almost no apparent biliary enhancement at 5 minutes post-injection of Gd-EOBDTPA. Repeated-measures ANOVA showed a significant difference between groups 1 and 2 (between-groups:P=0.0013,F=12.09; time-line:P=0.0001,F=76.24; confounding factor:P=0.0001,F=9.82). The BMR of the common hepatic duct between the two groups did not show a significant difference at 5 minutes, but didshow statistically significant differences at 10, 15 and 20 minutes by Scheffé's method (Table 3). Compared with group 1, the increase in SI of the BMR over time was delayed in group 2 (Figs. 1 and 2; Table 3).
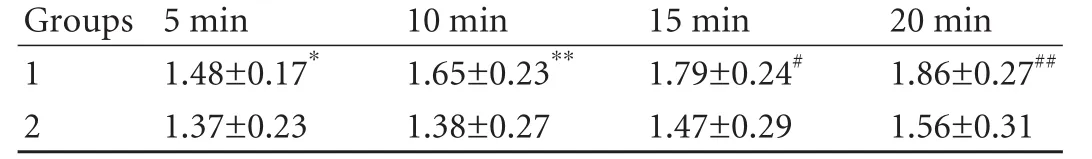
Table 2. Liver enhancement: LMR of groups 1 and 2
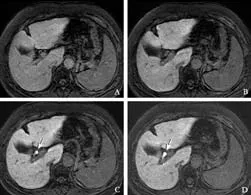
Fig. 1. Gd-EOB-DTPA-enhanced MRI from a 59-year-old woman (group 1) with hepatitis C liver cirrhosis (total bilirubin, 1.4 mg/dL). A: 5 minutes, B: 10 minutes, C: 15 minutes, D: 20 minutes post-Gd-EOB-DTPA injection. Fat-suppressed 3D T1-weighted GRE images in the transaxial plane demonstrating the liver and biliary enhancement over time. After 5 and 10 minutes (A, B), no biliary enhancement was seen. After 15 and 20 minutes (C, D), Gd-EOBDTPA-enhanced MRI showed enhancement of the common hepatic duct (arrows; BMR: 5.67 at 15 minutes and 6.73 at 20 minutes). Liver enhancement LMR: 1.52 at 5 minutes, 1.67 at 10 minutes, 1.82 at 15 minutes and 1.95 at 20 minutes) gradually increased over time (A-D).
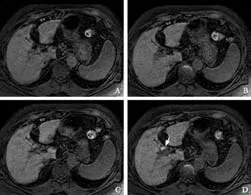
Fig. 2. Gd-EOB-DTPA enhanced MRI from a 75-year-old woman (group 2) with hepatitis C liver cirrhosis (total bilirubin, 3.6 mg/ dL). A: 5 minutes, B: 10 minutes, C: 15 minutes, D: 20 minutes post-Gd-EOB-DTPA injection. Fat-suppressed 3D T1-weighted GRE images in the transaxial plane demonstrating the liver and biliary enhancement over time. After 5, 10 and 15 minutes (A, B, C), no biliary enhancement was seen. After 20 minutes (D), Gd-EOB-DTPA-enhanced MRI showed enhancement of the common hepatic duct (arrow; BMR: 3.38 at 20 minutes). Weak liver enhancement (LMR: 1.33 at 5 minutes, 1.39 at 10 minutes, 1.50 at 15 minutes and 1.54 at 20 minutes) was seen at each time point (A-D).
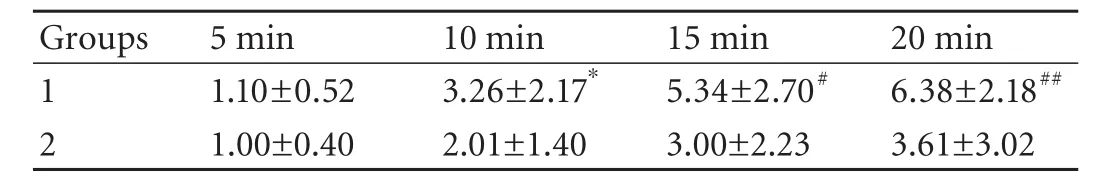
Table 3. Biliary enhancement: BMR of groups 1 and 2
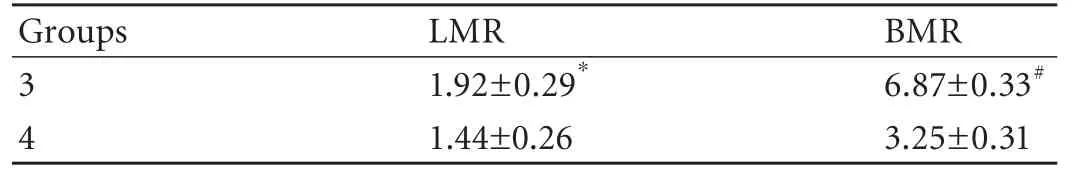
Table 4. Liver and biliary enhancement: LMR and BMR of groups 3 and 4 at 20 minutes
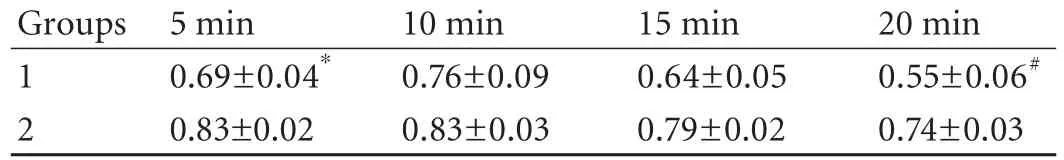
Table 5. TLR of groups 1 and 2
Comparison between groups 3 and 4
At 20 minutes post-Gd-EOB-DTPA injection, significant differences between groups 3 and 4 were seen in both LMR and BMR (Table 4).
TLR
At 5 and 20 minutes post-Gd-EOB-DTPA injection, statistical differences between groups 1 and 2 were seen for TLR (Table 5). Figs. 3 and 4 show the comparison between groups 1 and 2.
Correlation between liver enhancement and biliary enhancement
At all time points, liver enhancement correlated with biliary enhancement in both groups by Pearson's correlation (P<0.001 at all time points,r=0.94 at 5 minutes,r=0.73 at 10 minutes,r=0.61 at 15 minutes andr=0.63 at 20 minutes).
eGFR
No significant difference was seen in the eGFRs of group 1 (78.9±15.1 mL/min/1.73 m2) and group 2 (79.8± 22.2 mL/min/1.73 m2). Moreover, groups 3 (79.2±18.2 mL/min/1.73 m2) and 4 (79.4±23.5 mL/min/1.73 m2) did not show significant difference.
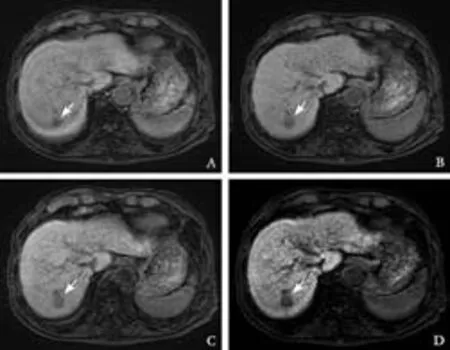
Fig. 3. Gd-EOB-DTPA enhanced MRI from a 65-year-old woman (group 1) with cryptogenic liver disease (total bilirubin, 0.8 mg/dL). A: 5 minutes, B: 10 minutes, C: 15 minutes, D: 20 minutes post-Gd-EOB-DTPA injection. Fat-suppressed 3D T1-weighted GRE images in the transaxial plane demonstrating the HCC (arrows) and liver enhancement over time. Gd-EOB-DTPA-enhanced MRI showed the TLR gradually increased over time (A-D); 0.71 at 5 minutes, 0.73 at 10 minutes, 0.63 at 15 minutes and 0.52 at 20 minutes.
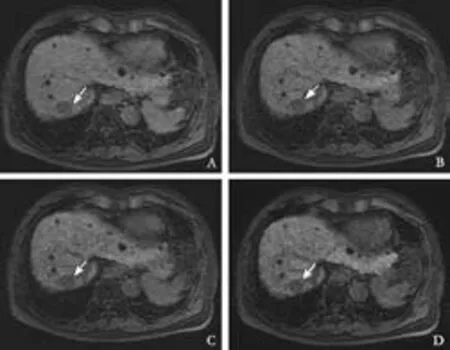
Fig. 4. Gd-EOB-DTPA-enhanced MRI from a 74-year-old woman (group 2) with hepatitis C liver cirrhosis (total bilirubin, 2.0 mg/ dL). A: 5 minutes, B: 10 minutes, C: 15 minutes, D: 20 minutes post-Gd-EOB-DTPA injection. Fat-suppressed 3D T1-weighted GRE images in the transaxial plane demonstrating the HCC (arrows) and liver enhancement over time. Gd-EOB-DTPA-enhanced MRI showed the following TLR over time; 0.85 at 5 minutes, 0.83 at 10 minutes, 0.81 at 15 minutes and 0.81 at 20 minutes (A-D).
Discussion
Our results clearly revealed that the degree of biliary enhancement was related to that of liver enhancement in the hepatobiliary phase of Gd-EOB-DTPA-enhanced MRI. Therefore, strong enhancement of the bile duct substantially shows effective liver enhancement, which allows a higher detection rate of HCC in the normal or damaged liver. Both liver and biliary enhancement effects provide functional information about physiologic and pathologic biliary flow, and thus may be affected by liver function.
It is important to evaluate the liver enhancement, which is necessary for the detection of liver tumors on Gd-EOB-DTPA-enhanced MRI. We investigated the TLR between HCCs and liver parenchyma, and significant differences were observed at 5 and 20 minutes. Therefore, we believe unsatisfactory liver enhancement after Gd-EOB-DTPA injection leads to decreased detection of HCCs. However, the pathology of the HCCs was not obtained, because all were diagnosed by using the AASLD guidelines. Further analysis is recommended.
Liver and biliary enhancement at all time points post-Gd-EOB-DTPA injection had significant differences in SI between groups 1 and 2. This means the biliary enhancement may be closely correlated with liver enhancement in Gd-EOB-DTPA-enhanced MRI. At 5 minutes post-injection, a very close correlation (r=0.94) between liver and biliary enhancement was seen, and a relatively close correlation was observed at 10-20 minutes (r=0.61 to 0.73). In the hepatobiliary phase at 5 minutes, the uptake of Gd-EOB-DTPA by hepatocytes may be mixed with the extracellular distribution of this contrast agent. Therefore, in this phase at 5 minutes it is difficult to understand the mechanism of liver and biliary contrast enhancement. Whereas, the hepatobiliary phase between 10 and 20 minutes showed a relatively close correlation between liver and biliary enhancement. Thus biliary enhancement should be recognized as a biomarker of liver enhancement and as a useful method of clinical evaluation. The SI of the common hepatic duct became markedly elevated after the administration of Gd-EOB-DTPA in group 1 of our study, which was also reported by Carlos et al.[13]In addition, we found a difference between normal liver function and liver dysfunction in the elevated SI of the common hepatic duct at 15 and 20 minutes postinjection.
According to Tschirch et al,[7]only 40% of the cirrhosis group in the hepatobiliary phase was sufficient for anatomical visualization of the biliary tree after Gd-EOB-DTPA injection, although all subjects in the control group showed sufficient visualization. And they reported a significant difference between normal liver function and liver dysfunction at 10, 20 and 30 minutes for biliary enhancement. Their results motivated usto undertake the quantitative investigation of not only biliary enhancement, but also liver enhancement. And our analysis demonstrated that biliary enhancement may be a biomarker of sufficient liver enhancement after Gd-EOB-DTPA injection. More importantly, impaired liver function can be suspected in patients with a reduced detection of liver tumor. Therefore, the grading of biliary enhancement may be a promising evaluation for insufficient liver enhancement, which may have a negative impact on detecting hepatic tumor. Visual evaluation of optimal liver enhancement is sometimes difficult in daily clinical MR practice. Thus, we suggest that the evaluation of biliary enhancement should be used as a biomarker of sufficient or insufficient liver enhancement.
Our result showed significant differences in biliary enhancement at 10, 15 and 20 minutes between groups 1 and 2, while Tschirch et al[7]reported a significant difference in biliary enhancement between normal liver function and liver dysfunction at 10, 20 and 30 minutes. Thus, our results are the same. Other researchers reported the relation between biliary enhancement in Gd-EOB-DTPA-enhanced MRI and liver function, whereas, to our knowledge, our study has quantitatively shown for the first time the close correlation between SI of the liver and the bile duct at each time point.
Patients with total bilirubin ≥1.8 mg/dL (group 4) showed poor visualization of the common bile duct in our study. This result (Table 4) was consistent with the comparison between groups 1 and 2 (Table 3) and compatible with previous reports.[7,8]Multifactor evaluation of Child-Pugh classification includes a factor for total bilirubin, which may reflect the Child-Pugh class. Because total bilirubin is often used clinically due to the simple sampling, the judgement of effective contrast enhancement of the liver and the bile duct by total bilirubin may be reasonable.
It is known that Gd-EOB-DTPA is excreted in the biliary and renal systems. Because we investigated the effect of biliary enhancement compared to liver parenchymal enhancement, the difference of the renal excretion factor between groups could be excluded by measuring eGFR. In our study, no difference in renal function was observed between the groups.
In previous studies,[2,13]biliary enhancement at 10-20 minutes post-injection of Gd-EOB-DTPA was enough in patients with a functionally unimpaired liver. In our study, group 1 showed a high enhancement effect on both liver and biliary enhancement, and a significant difference was seen between groups 1 and 2 at 10 minutes post-Gd-EOB-DTPA injection (Tables 2 and 3). The increase in SIs of LMR and BMR tended to be delayed in group 2, as compared with group 1. Therefore, the changing rate of the SI over time is recognized as an important factor in time-intensity curve analysis for both liver and biliary enhancement on Gd-EOB-DTPA-enhanced MRI.
Our study has some limitations. First, the number of patients was relatively small. Second, we had no data from the indocyanine green (ICG) test, although the ICG retention rate at 15 minutes (ICG-R15) has been reported to be a significant predictor of the SI of the bile duct after Gd-EOB-DTPA injection.[8,9]In our hospital, the ICG-R15 test is unusual to avoid the cumbersome procedure. Third, the hepatobiliary phase of the Gd-EOB-DTPA-enhanced MRI was only obtained up to 20 minutes, so the subsequent time-intensity courses of liver and biliary enhancement were not analyzed. However, we believe that 20 minutes post-Gd-EOBDTPA injection is clinically standard and useful, because the liver-to-lesion contrast, such as in HCC detection, is best at 20 minutes as previously reported.[14]
In conclusion, patients with severe liver cirrhosis have a decreased visualization of the liver and bile duct during the hepatobiliary phase on Gd-EOB-DTPA-enhanced MRI. Thus, the degree of biliary enhancement has a close correlation to that of liver enhancement.
Contributors: OM proposed the study. OM and MT wrote the first draft. IK analyzed the data. All authors contributed to the design and interpretation of the study and to further drafts. OM is the guarantor.
Funding: None.
Ethical approval: Not needed.
Competing interest: No benefits in any form have been received or will be received from a commercial party related directly or indirectly to the subject of this article.
1 Ichikawa T, Saito K, Yoshioka N, Tanimoto A, Gokan T, Takehara Y, et al. Detection and characterization of focal liver lesions: a Japanese phase III, multicenter comparison between gadoxetic acid disodium-enhanced magnetic resonance imaging and contrast-enhanced computed tomography predominantly in patients with hepatocellular carcinoma and chronic liver disease. Invest Radiol 2010;45:133-141.
2 Hamm B, Staks T, Mühler A, Bollow M, Taupitz M, Frenzel T, et al. Phase I clinical evaluation of Gd-EOB-DTPA as a hepatobiliary MR contrast agent: safety, pharmacokinetics, and MR imaging. Radiology 1995;195:785-792.
3 Huppertz A, Balzer T, Blakeborough A, Breuer J, Giovagnoni A, Heinz-Peer G, et al. Improved detection of focal liver lesions at MR imaging: multicenter comparison of gadoxetic acid-enhanced MR images with intraoperative findings. Radiology 2004;230:266-275.
4 Mühler A, Heinzelmann I, Weinmann HJ. Elimination of gadolinium-ethoxybenzyl-DTPA in a rat model ofseverely impaired liver and kidney excretory function. An experimental study in rats. Invest Radiol 1994;29:213-216.
5 Schuhmann-Giampieri G, Schmitt-Willich H, Press WR, Negishi C, Weinmann HJ, Speck U. Preclinical evaluation of Gd-EOB-DTPA as a contrast agent in MR imaging of the hepatobiliary system. Radiology 1992;183:59-64.
6 Ryeom HK, Kim SH, Kim JY, Kim HJ, Lee JM, Chang YM, et al. Quantitative evaluation of liver function with MRI Using Gd-EOB-DTPA. Korean J Radiol 2004;5:231-239.
7 Tschirch FT, Struwe A, Petrowsky H, Kakales I, Marincek B, Weishaupt D. Contrast-enhanced MR cholangiography with Gd-EOB-DTPA in patients with liver cirrhosis: visualization of the biliary ducts in comparison with patients with normal liver parenchyma. Eur Radiol 2008;18:1577-1586.
8 Takao H, Akai H, Tajima T, Kiryu S, Watanabe Y, Imamura H, et al. MR imaging of the biliary tract with Gd-EOB-DTPA: effect of liver function on signal intensity. Eur J Radiol 2011; 77:325-329.
9 Motosugi U, Ichikawa T, Sou H, Sano K, Tominaga L, Kitamura T, et al. Liver parenchymal enhancement of hepatocyte-phase images in Gd-EOB-DTPA-enhanced MR imaging: which biological markers of the liver function affect the enhancement? J Magn Reson Imaging 2009;30:1042-1046.
10 Tsuboyama T, Onishi H, Kim T, Akita H, Hori M, Tatsumi M, et al. Hepatocellular carcinoma: hepatocyte-selective enhancement at gadoxetic acid-enhanced MR imaging--correlation with expression of sinusoidal and canalicular transporters and bile accumulation. Radiology 2010;255:824-833.
11 Narita M, Hatano E, Arizono S, Miyagawa-Hayashino A, Isoda H, Kitamura K, et al. Expression of OATP1B3 determines uptake of Gd-EOB-DTPA in hepatocellular carcinoma. J Gastroenterol 2009;44:793-798.
12 World Medical Association Declaration of Helsinki. Ethical principles for medical research involving human subjects. World Medical Association. Bull World Health Organ 2001; 79:373-374.
13 Carlos RC, Branam JD, Dong Q, Hussain HK, Francis IR. Biliary imaging with Gd-EOB-DTPA: is a 20-minute delay sufficient? Acad Radiol 2002;9:1322-1325.
14 Frericks BB, Loddenkemper C, Huppertz A, Valdeig S, Stroux A, Seja M, et al. Qualitative and quantitative evaluation of hepatocellular carcinoma and cirrhotic liver enhancement using Gd-EOB-DTPA. AJR Am J Roentgenol 2009;193:1053-1060.
November 9, 2011
Accepted after revision February 10, 2012
Author Affiliations: Department of Radiology (Okada M, Ishii K, Hyodo T, Kumano S and Murakami T) and Department of Gastroenterology and Hepatology (Kitano M and Kudo M), Kinki University Faculty of Medicine, Osaka-Sayama, Osaka 589-8511, Japan; Gastroenterological Center, Yokohama City University Medical Center, Yokohama, Japan (Numata K)
Masahiro Okada, MD, Department of Radiology, Kinki University Faculty of Medicine, 377-2 Ohno-Higashi, Osaka-Sayama, Osaka 589-8511, Japan (Tel: +81-72-366-0221; Fax: +81-72-367-1685; Email: mokada@gaia.eonet.ne.jp)
? 2012, Hepatobiliary Pancreat Dis Int. All rights reserved.
10.1016/S1499-3872(12)60165-9
 Hepatobiliary & Pancreatic Diseases International2012年3期
- Hepatobiliary & Pancreatic Diseases International的其它文章
- Management of splenic artery aneurysm associated with extrahepatic portal vein obstruction
- Pancreas-preserving segmental duodenectomy for gastrointestinal stromal tumor of the duodenum and splenectomy for splenic angiosarcoma
- Induction, modulation and potential targets of miR-210 in pancreatic cancer cells
- Quantitative analysis of intestinal gas in patients with acute pancreatitis
- Quality control measures for lowering the seroconversion rate of hemodialysis patients with hepatitis B or C virus
- Effect of recombinant human growth hormone and interferon gamma on hepatic collagen synthesis and proliferation of hepatic stellate cells in cirrhotic rats