Effect of Temperature on Gene Expression in the Pearl Oyster Pinctada fucata
LIU Wenguang, HUANG Xiande, LIN Jianshi, and HE Maoxian
CAS Key Laboratory of Tropical Marine Bio-Resources and Ecology, South China Sea Institute of Oceanology, Chinese Academy of Sciences, Guangzhou 510301, P. R. China
Effect of Temperature on Gene Expression in the Pearl Oyster Pinctada fucata
LIU Wenguang, HUANG Xiande, LIN Jianshi, and HE Maoxian*
CAS Key Laboratory of Tropical Marine Bio-Resources and Ecology, South China Sea Institute of Oceanology, Chinese Academy of Sciences, Guangzhou 510301, P. R. China
In this study, we examined the effect of elevated temperature on the expression patterns of genes,i.e.,nacrein,irr,n16,n19, andhsp70in the pearl oysterPinctada fucata. The experiment was carried out at 4 temperatures,i.e., 20℃ (ambient, control), 24, 28℃, and 32℃. The expression levels of target genes inP. fucatawere assayed at 0, 6, 24, 48, and 96 hviareal-time polymerase chain reaction. Results showed that the expression levels ofnacreinandirrhad no significant variations among different time points below 28℃, but significantly increased over time at 32℃. The expression levels ofn16andn19did not change markedly at 20℃. The former increased significantly at 6 h and 24 h while the latter substantially decreased during 6–96 h at 24, 28 and 32℃. Among different temperatures, the level ofn16was significantly lower at 20℃ than at other temperatures during 6–96 h, and the level ofn19significantly varied among different temperatures at 48 h and 96 h. The expression level ofhsp70was significantly higher at 32℃ than at 20, 24 and 28℃ at 24 h. These results demonstrated that elevated temperature impacted the physiological processes ofP. fucataand potentially influenced its adaptability to thermal stress.
seawater temperature; heat shock protein; gene expression pattern;Pinctada fucata
1 Introduction
The pearl oysterPinctada fucatais widely distributed in coastal areas in South China and Japan (Jianget al., 1993).P. fucatais a species of economic importance and accounts for approximately a quarter of seawater pearl production (about $160 million) (Southgate and Lucas, 2008). In recent years, significant efforts have been made in China to initiate selective breeding programs for improving the growth and pearl formation capacity of pearl oyster (Heet al., 2006; Wanget al., 2010).
In molluscs, temperature is one of the most important factors regulating their physiological processes. Significant changes in water temperature can negatively influence the animal’s health and lead to decreased growth rate and increased mortality (Taylor and Venn, 1979; Parket al., 2001). The pearl oysters are limited in their movement in the cage, thus can be exposed to water temperatures beyond their thermal preference (Wanget al., 2010). Therefore, it is of practical importance to understand the effect of water temperature on the growth ofP.fucata.
InP. fucata, the shell matrix proteins, Nacrein, N16 and N19, may affect not only the formation of the shell (Takeuchi and Endo, 2006), but also the occurrence of pearls within the oyster (Samataet al., 1999; Miyamotoet al., 2005). Insulin-related peptide receptor (IRR) is thought to control the growth and carbohydrate metabolism of gastropods (Hamanoet al., 2005; Liet al., 1992). Hsp70 consists of a group of highly conserved proteins that have general protective function in all living organisms (Hofmann, 1999).P. fucatahas been reported to expresshsp70in response to stressful stimuli (Wanget al., 2009). However, the mechanisms of temperature-induced changes in the expression patterns ofnacrein,irr,n16,n19, andhsp70have not been elucidated.
The aim of this work was to demonstrate the role ofnacrein,irr,n16,n19, andhsp70inP. fucatain response to elevated seawater temperature. To this end, we investigated the effect of elevated seawater temperature on these gene expression patterns inP. fucataunder experimental conditions. Results will provide new insights into the functional role of heat shock protein and shell matrix proteins inP. fucata.
2 Materials and Methods
2.1 Animal Collection and Experimental Design
In March 2011, pearl oysters (shell height, 4.58 cm ± 0.43 cm; shell length, 4.32 cm ± 0.39 cm) were collected from the major pearl oyster growing area at the Daya Bay Station (23°31′–24°50′N(xiāo) and 113°29′–114°49′E). Waterconditions were as follows: temperature 20℃± 0.5℃, pH 8.10 ± 0.05, and salinity 32 ± 0.5. Along the Daya Bay coast the seasonal fluctuation of water temperature was between 15 and 31℃ (Wanget al., 2006, 2008). Selected animals were cleaned off epibionts and then acclimated in a 500-L aquarium at ambient seawater temperature (20℃± 0.5℃) and pH (8.10 ± 0.05) for one week prior to experimentation. During this period, the animals were fed daily withPlatymonas subcordiformisat the satiation feed rate. Excess food and feces were removed by siphoning from the bottom of the aquarium, and fresh filtered seawater (salinity 32 ± 0.5) was added into the aquarium every day.
After the acclimation period, the animals were randomly assigned to twelve 75-L aquariums (about 20 individuals each) set at four temperatures (3 each): 20℃, 24℃, 28℃, and 32℃. The header tanks were continuously bubbled with air to aid mixing and to maintain the dissolved oxygen (DO) level above 90%. The experiment lasted for four days. The animals were fed daily withP. subcordiformis. Water temperature was maintained at 24℃± 0.5℃, 28℃± 0.5℃, and 32℃± 0.5℃ using external chillers or unmanipulated for the ambient control (20℃± 0.5℃). To ensure the stability throughout the experiment, temperature was measured three times a day with a mercury thermometer.
The seawater in the aquariums was exchanged daily. Seawater in the groups of 24℃, 28℃, and 32℃ was warmed from 20℃ to the required using external chillers. Water from the header tank was gravity-fed to replicate aquariums of temperatures 24℃± 0.5℃, 28℃± 0.5℃, and 32℃± 0.5℃. There was an individual header tank for each experimental aquarium. To avoid substantial temperature changes during the experiment, water temperature in each aquarium was measured immediately after water exchange. Pear oysters were sampled from each group at 0, 6, 24, 48, and 96 h for gene expression assay. On each sampling time point, 3 new individuals were randomly selected each aquarium.
2.2 Gene Expression Analysis
Total RNA was extracted from the mantle tissue ofP. fucatausing a Mollusc RNA extraction kit (Omega Bio-Tek, Inc, Georgia, America) following the manufacturer’s instructions. The RNA extract was quantified and qualified using Thermo NanoDrop 2000 spectrophotometer (Thermo Fisher Scientific Inc, Wilmington, America) and 1% agarose gel electrophoresis, respectively. High-quality total RNA was reversely transcribed to cDNA using a PrimeScript? eagent kit (TaKaRa, Japan) following the manufacturer’s instructions.
Quantitative real-time polymerase chain reaction (RTPCR) was carried out on cDNA samples using Roche LightCycler480 thermal cycler (Roche Applied Science, Germany). The amplification was performed in triplicate in a total volume of 10 μL containing 5 μL of 2× SYBR Premix Ex Taq? (TaKaRa), 2 μL of diluted cDNA, 0.2 μL of each primer (10 μmol L-1), and 2.6 μL of double-distilled water. The cycle conditions were as follows: 1 cycle of 95℃ for 10 s followed by 45 cycles of 95℃for 5 s, 60℃ for 25 s, and 80℃ for 1 s; 1 cycle of 95℃for 1 s, 65℃ for 15 s, and 60℃ for 1 s; and 1 cycle of 40℃ for 1 s. The specificity of PCR amplification was verified from the melting curve. The housekeeping genegapdhwas selected as references for the calculation of relative expression levels of the genes. Sequences of primers targetingnacrein,irr,n16,n19,hsp70, andgapdhinP. fucataare outlined in Table 1.
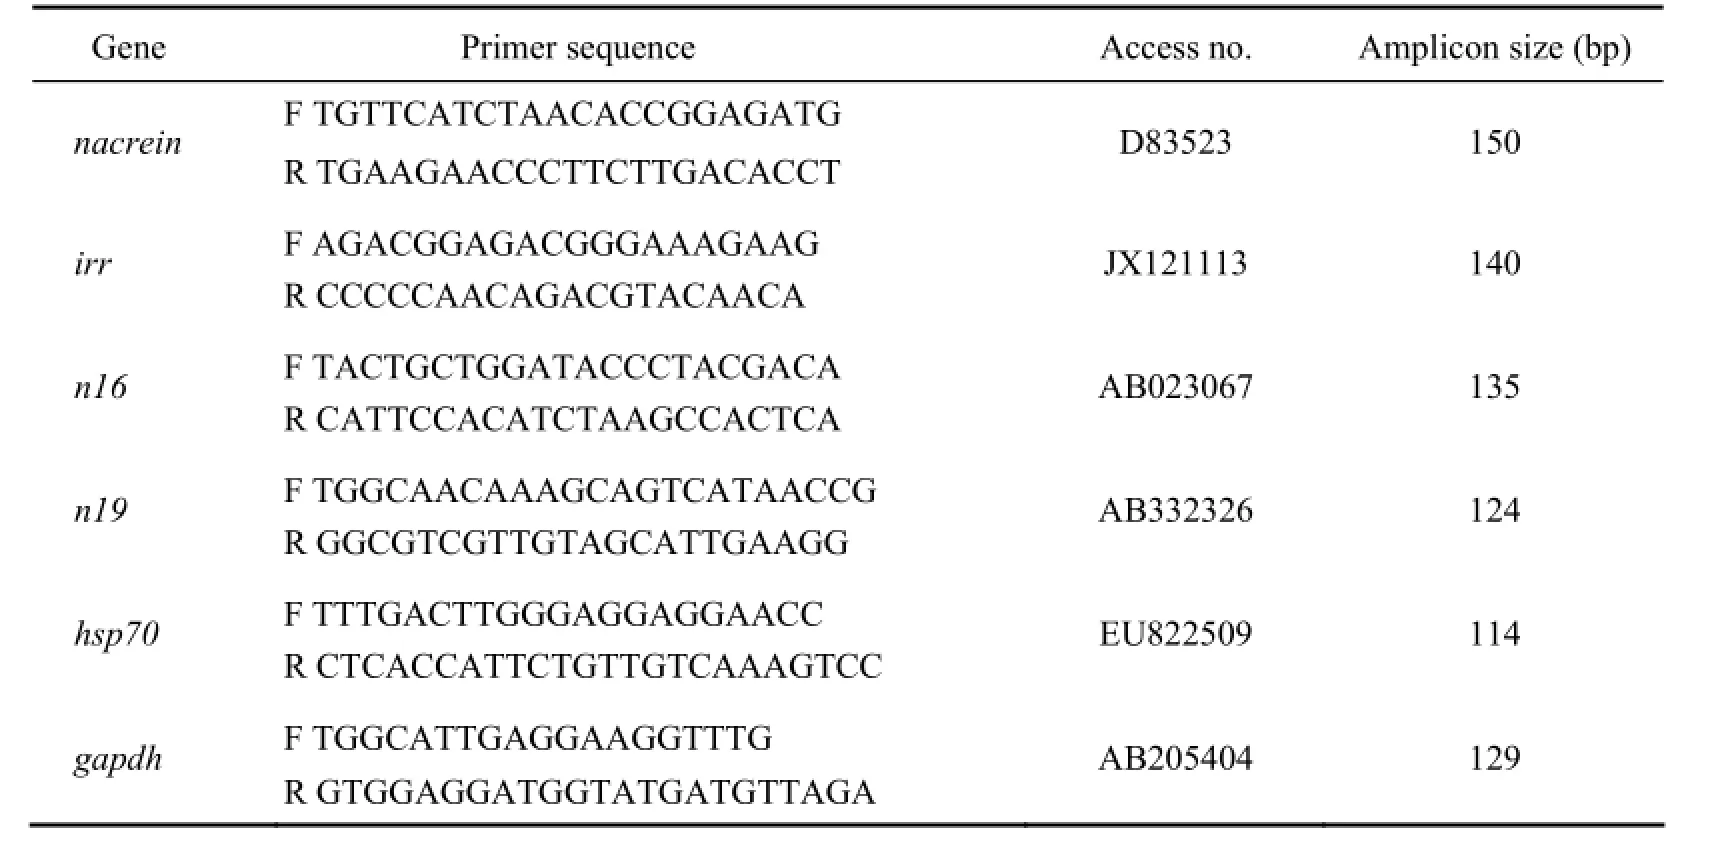
Table 1 Sequences of primers used for RT-PCR assay of the expression patterns of targeting genes
2.3 Statistical Analysis
All measurements of the variables were presented as the mean values of the three pearl oysters in each aquarium, and the aquarium means were used in the following statistical analyses. Data were tested for homoscedasticity and normality and were log-transformed if necessary. The dependent variable (gene expression level) at each time point was analyzed by one-way ANOVA. LSD post-hoc tests were used to assess differences among temperature groups as well as time points. Significance was set atP< 0.05 for all tests. The software SPSS 16.0was used for statistical analyses.
3 Results
At 20, 24 and 28℃, the relative expression level ofnacreinslightly fluctuated with no significant difference over time (P> 0.05), whereas at 32℃, it increased markedly at 6 h and then decreased significantly from 24 to 96 h (Fig.1). Among the four temperatures, the expression level ofnacreinat 6 h and 24 h was significantly higher at 32℃ than at 20, 24 and 28℃ (P< 0.05), with no significant differences observed at 48 h (P> 0.05). Thenacreinexpression level at 96 h was significantly lower at 32℃than at 20, 24 and 28℃ (Table 2).

Fig.1 The relative expression level of nacrein in response to elevated temperature assayed by RT-PCR. Means not sharing the same superscript are significantly different in each temperature group.
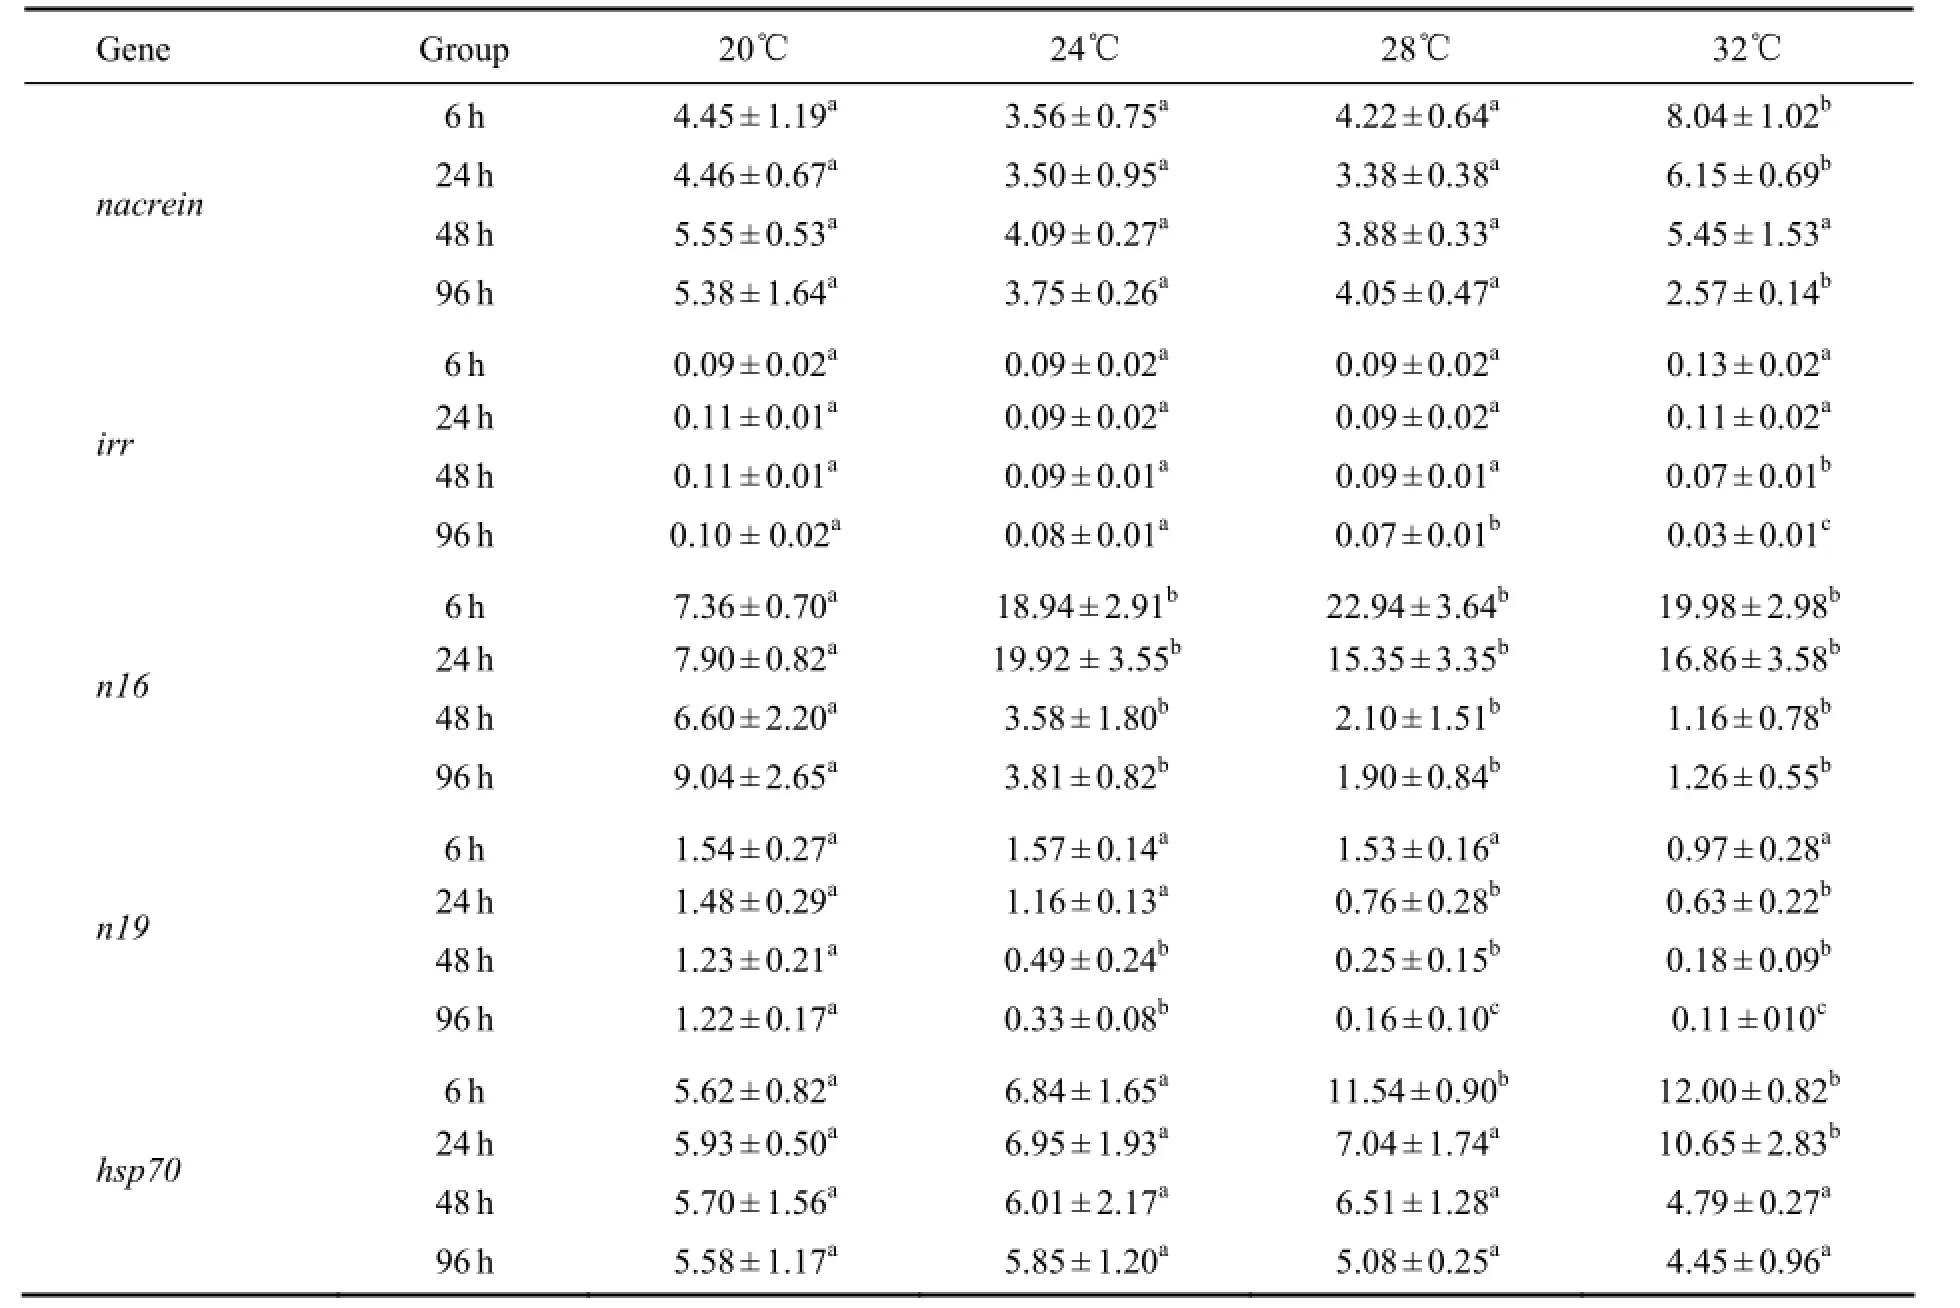
Table 2 Relative expression levels of nacrein, irr, n16, n19 and hsp70 in Pinctada fucata under different temperature
The expression level ofirrshowed no clear changes during the experimental period at 20, 24 and 28℃ (P>0.05), but increased to the highest at 6 h and then decreased from 24 to 96 h at 32℃ (P< 0.05) (Fig.2). ANOVA showed no significant effect of temperature on the expression ofirrat 6 h or 24 h (P> 0.05). Significant difference was observed in theirrexpression level at 48 h between 32℃ and other temperatures (20, 24 and 28℃). The expression level ofirrwas significantly decreased at 96 h (P< 0.05) (Table 2).

Fig.2 The relative expression level of irr in response to elevated temperature assayed by RT-PCR. Means not sharing the same superscript are significantly different in each temperature group.
The expression level ofn16showed no significant variation among time points at 20℃ (P> 0.05), but increased significantly at 6 h and 24 h at the elevated temperatures and then stabilized at a relatively lower level at 48 h and 96 h. Then16expression level significantly decreased from 0 h to 48 h or 96 h at 32℃ (P< 0.05), but not at any lower temperature (Fig.3). During 6–96 h, the expression level ofn16at 20℃ was significantly different from that at higher temperatures, 24, 28 and 32℃ (P<0.05) (Table 2).

Fig.3 The relative expression level of n16 in response to elevated temperature assayed by RT-PCR. Means not sharing the same superscript are significantly different in each temperature group.
At 20℃, the expression level ofn19decreased slightly over time (P> 0.05). At 24℃ and 28℃, then19expres-sion level decreased significantly from 6 h to 24 h and then decreased slightly from 48 h to 96 h (P< 0.05). At 32℃, then19expression level decreased significantly from 6 h to 96 h, with the lowest observed at 96 h (Fig.4). There was no significant difference in then19expression level among different temperatures at 6 h. At 24 h, significant difference was observed in the expression level ofn19between temperatures below 24℃ and above 28℃. At 48 h and 96 h, then19expression level significantly varied at different temperatures (P< 0.05) (Table 2).
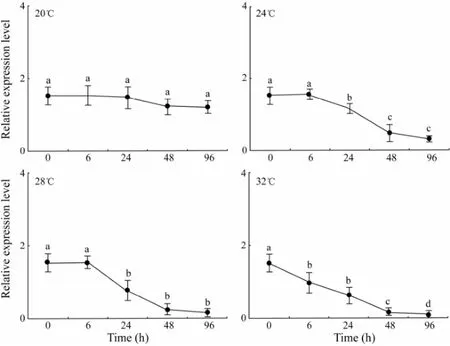
Fig.4 The relative expression level of n19 in response to elevated temperature assayed by RT-PCR. Means not sharing the same superscript are significantly different in each temperature group.
The expression level ofhsp70had no substantial change during 0–96 h at 20℃ or 24℃ (P> 0.05). At 28℃, thehsp70expression level was significantly higher at 6 h than at 0 h and during 24–96 h. At 32℃, thehsp70expression level increased significantly from 6 h to 24 h (P< 0.05) (Fig.5). Among different temperatures, the expression level ofhsp70at 6 h was significantly higher at 28℃ and 32℃ than at 20℃ and 24℃ (P< 0.05), and that at 24 h was significantly higher at 32℃ than at 20, 24 and 28℃. No significant difference was observed in thehsp70expression level at 48 h or 96 h among different temperatures (P> 0.05) (Table 2).
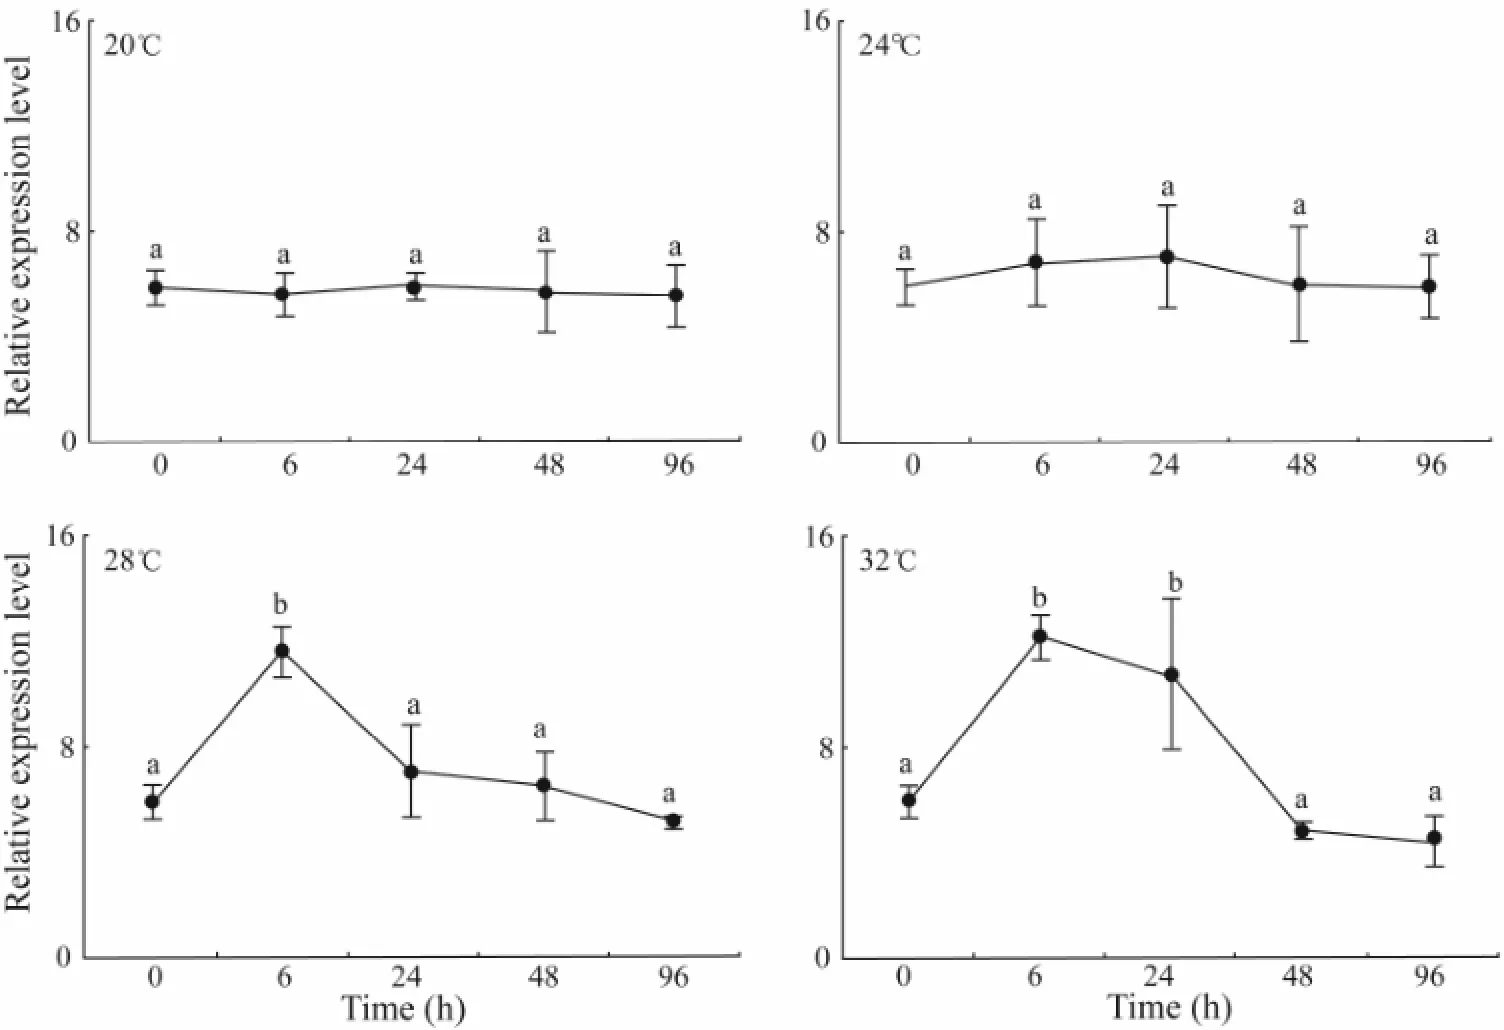
Fig.5 The relative expression level of hsp70 in response to elevated temperature assayed by RT-PCR. Means not sharing the same superscript are significantly different in each temperature group.
4 Discussion
An organism’s response to environmental and physiological stressors includes a highly ordered set of events that are often represented by rapid changes in specific gene expression followed by the synthesis of proteins involved in adaptation (Staibet al., 2007). Nacrein has carbonic anhydrase activity and supplies the shell with carbonate ions (Miyamotoet al., 1996; Gonget al., 2008). The insulin-like growth factor (IGF) signaling pathway is essential for proper vertebrate growth and development (Annunziataet al., 2011). As for mollusks, insulin-related peptide receptor has been suggested to control the growth and carbohydrate metabolism (Hamanoet al., 2005; Smitet al., 1988; Liet al., 1992). Irr shares high levels of identity with the IGF receptor and is thought to be involved in the growth and development processes ofP. fucata. In the present study,nacreinandirrexpression levels at 32℃ were significantly elevated at 6 h but then decreased significantly. The 32℃-acclimated oyster had a significantly lower expression level ofnacreinandirrthan the other acclimation groups at 96 h (Table 2). This possibly reflected the overall decrease in protein synthesis rate in response to the thermal shock, which might contribute to determining the upper thermal limit ofP. fucata. If the elevated temperature is maintained longer, this decrease may trigger a cascading effect on shell growth and pearl formation ofP. fucata.
InP. fucata, N16 induces aragonite crystal formation when fixed onto a substrate (Samataet al., 1999). N19 functions as a negative factor, predominantly in the nacreous layer formation (Yanoet al., 2007; Zhang and He, 2011). In the present study, heat exposure ofP.fucatainduced increases in the transcript level ofn16at 6 h and 24 h, but decreased the levels ofn19throughout the experiment at 24, 28 and 32℃. Among different temperatures, the expression levels ofn16andn19were significantly higher at 24, 28 and 32℃ than at 20℃ at 24, 48 and 96 h. These results demonstrated thatn16andn19were more sensitive to thermal stress thannacreinandirr. The variation in gene expression after heat shock incubation suggests cellular adaptive mechanisms with an altered metabolic recovery. When the temperature exceeds 25℃, filtration falls significantly inM. edulis(Gonzalezet al., 1976; Schulte, 1975). Under these conditions mussels would rely on stored fuels to replenish the consumed ATP. These might cause depletion of stores and further contribute to cell death (Anestiset al., 2007). In our study, the decrease innacrein,irrandn16expression levels might associate with the decrease in specific metabolic rate.
The expression level ofhsp70is frequently used as an indicator of physiological mechanism through which bivalves cope with environmental challenge (Wegeleet al., 2004; Liuet al., 2012). The present study showed that under warming seawater conditions, activation of the heat shock response occurs inP. fucata. In fact, our results revealed a marked increase in the expression level ofhsp70inP. fucataexposed to temperatures beyond 28℃. Thehsp70level ofP. fucatawas significantly higher than that of the control animal after 6 h heat challenge. This result indicated that the expression ofhsp70induced by the thermal stress could maintain for at least 6 h. High levels of induciblehsp70indicates high levels of protein damage and increased tolerance to subsequent stress. Whenhsp70was over expressed, cellular energy demands might increase dramatically due to the energy requirements associated with activating transcription of heat shock genes. Synthesis of Hsp70, replacement of damaged protein, and energy costs induced by heat stress would negatively impact the energy budget and result in decreased availability of growth energy (Somero, 2002; Tadashiet al., 2004). The limitation in energy budgets due to high energy demands for coping with heat damage to protein plays an important role in establishing animals' upper distribution limit (Hochachka and Somero, 2002). The acute expression ofhsp70at high temperature may be important for the thermal resistance ofP. fucataacclimated at high temperatures at the cost of energy consumption.
In summary, this study suggested that elevated seawater temperature resulted in significant change in the expression pattern of calcification-related genes (nacrein,n16,n19),irrandhsp70. Compared to ambient temperature, these genes were more sensitive to higher temperature such as 32℃. The change in their gene expression patterns may be linked to the decrease in specific metabolic rate, and this information is valuable to the aquaculture industry ofP. fucata.
Acknowledgements
This study is supported by the National Natural Science Foundation of China (41006090), Joint Program of NSFC-Guangdong (U0831001), and the Funds of Knowledge Innovation Program of Chinese Academy of Sciences (ZCX2-EW-Q21).
Anestis, A., Lazou, A., P?rtner, H. O., and Michaelidis, B., 2007. Behavioral, metabolic, and molecular stress responses of marine bivalve Mytilus galloprovincialis during long-term acclimation at increasing ambient temperature. The American Journal of Physiology–Regulatory, Integrative and Comparative Physiology, 293: R911-R921.
Annunziata, M., Granata, R., and Ghigo, E., 2011. The IGF system. Acta Diabetologica, 48: 1-9.
Gong, N. P., Li, Q., Huang, J., Fang, Z., Zhang, G. Y., Xie, L. P., and Zhang, R. Q., 2008. Culture of outer epithelial cells from mantle tissue to study shell matrix protein secretion for biomineralization. Cell and Tissue Research, 333: 493-501.
Gonzalez, G. J., and Yevich, P., 1976. Responses of an estuarine population of the blue mussel Mytilus edulis to heated water from a steam generating plant. Marine Biology, 34: 177-189.
Hamano, K., Awaji, M., and Usuki, H., 2005. cDNA structure of an insulin-related peptide in the Pacific oyster and sea-sonal changes in the gene expression. Journal of Endocrinology, 187: 55-67.
He, M. X., Guan, Y. Y., Yuan, T., and Zhang, H. Y., 2008. Realized heritability and response to selection for shell height in the pearl oyster Pinctada fucata (Gould). Aquaculture Research, 39: 801-805.
Hochachka, P. W., and Somero, G. N., 2002. Biochemical Adaptation. Oxford University Press, New York, 480pp.
Hofmann, G. E., 1999. Ecologically relevant variation in induction and function of heat shock proteins in marine organisms. American Zoologist, 39: 889-900.
Jiang, W. G., Li, G., Xu, G. Q., Lin, Y. G., and Qing, N., 1993. Growth of the induced triploid pearl oyster Pinctada martensii (D.). Aquaculture, 111: 245-253.
Li, K. W., Geraerts, W. P. M., and Joosse, J., 1992. Purification and sequencing of molluscan insulin-related peptide II from the neuroendocrine light green cells in Lymnaea stagnalis. Endocrinology, 130: 3427-3432.
Liu, W. G., Huang, X. D., Lin, J. S., and He, M. X., 2012. Seawater acidification and elevated temperature affect gene expression patterns of the Pearl oyster Pinctada fucata. PLoS ONE, 7 (3), e33679, DOI: 10.1371/journal.pone.0033679.
Miyamoto, H., Miyashita, T., Okushima, M., Nakano, S., Morita, T., and Matsushiro, A., 1996. A carbonic anhydrase from the nacreous layer in oyster pearls. Proceedings of the National Academy of Sciences of the United States of America, 93: 9657-9660.
Miyamoto, H., Miyoshi, F., and Kohno, J., 2005. The carbonic anhydrase domain protein nacrein is expressed in the epithelial cells of the mantle and acts as a negative regulator in calcification in the mollusc Pinctada fucata. Zoological Science, 22: 311-315.
Park, M. S., Kang, C. K., and Lee, P. Y., 2001. Reproductive cycle and biochemical composition of the ark shell Scapharca Broughtonii (Schrenck) in a southern coastal bay of Korea. Journal of Shellfish Research, 20: 177-184.
Samata, T., Hayashi, N., Kono, M., Hasegawa, K., Horita, C., and Akera, S., 1999. A new matrix protein family related to the nacreous layer formation of Pinctada fucata. FEBS Letters, 462: 225-229.
Schulte, E. H., 1975. Influence of algal concentration and temperature on the filtration rate of Mytilus edulis. Marine Biology, 30: 331-341.
Smit, A. B., Vreugdenhil, E., Ebberink, R. H. M, Geraerts, W. P. M., Klootwijk, J., and Joosse, J., 1988. Growth-controlling molluscan neurons produce the precursor of an insulin-related peptide. Nature, 331: 535-538.
Somero, G. N., 2002. Thermal physiology and vertical zonation in intertidal animals: Optima, limits, and costs of living. Integrative and Comparative Biology, 42; 780-789.
Southgate, P. C., and Lucas, J. S., 2008. The Pearl Oyster. Elsevier, Oxford, 573pp.
Staib, J. L., Quindry, J. C., French, J. P., Criswell, D. S., and Powers, S. K., 2007. Increased temperature, not cardiac load, activates heat shock transcription factor1 and heat shock protein72 expression in the heart. The American Journal of Physiology–Regulatory, Integrative and Comparative Physiology, 292: 432-439.
Tadashi, K., Takao, K., Hiroshi, A., Shin, E., Masaaki, N., Hideaki, T., Tadashi, Y., Seiji, K., and Ryuichi, T., 2004. Mild heat shock induces autophagic growth arrest, but not apoptosis in U251-MG and U87-MG human malignant glioma cells. Journal of Neuro-Oncology, 68: 101-111.
Takeuchi, T., and Endo, K., 2006. Biphasic and dually coordinated expression of the genes encoding major shell matrix proteins in the pearl oyster Pinctada fucata.Marine Biotechnology, 8: 52-61.
Taylor, A. C., and Venn, T. J., 1979. Seasonal variation in weight and biochemical composition of the tissues of the queen scallop Chlamys opercularis from the Clyde sea area. Journal of the Marine Biological Association of the United Kingdom, 59: 605-621.
Wang, A. M., Shi, Y. H., Wang, Y., and Gu, Z. F., 2010. The Biology and New Technology for Culture of Pinctada fucata. China Agricultural Science and Technology Press, Beijing, 78pp (in Chinese).
Wang, A. M., Wang, Y., Gu, Z. F., Li, M., Shi, Y. H., and Li, S. F., 2010. Heterosis and genetic cariation of hybrids from two geographical populations of pearl oyster, Pinctada martensii. Oceanologia et Limnologia Sinica, 41: 140-147 (in Chinese). Wang, Y. S., Lou, Z. P., Sun, C. C., and Sun, S., 2008. Ecological environment changes in Daya Bay, China, from 1982 to 2004. Marine Pollution Bulletin, 56: 1871-1879.
Wang, Y. S., Lou, Z. P., Sun, C. C., Wu, M. L., and Han, S. H., 2006. Multivariate statistical analysis of water quality and phytoplankton characteristics in Daya Bay, China, from 1999 to 2002. Oeanologia, 48: 193-211.
Wang, Z. L., Wu, Z. H., Jian, J. C., and Lu, Y. S., 2009. Cloning and expression of heat shock protein 70 gene in the haemocytes of pearl oyster (Pinctada fucata, Gould 1850) responding to bacterial challenge. Fish and Shellfish Immunology, 26: 639-645.
Wegele, H., Müller, L., and Buchner, J., 2004. Hsp70 and Hsp90–a relay team for protein folding. Reviews of Physiology Biochemistry and Pharmacology, 151: 1-44.
Yano, M., Nagai, K., Morimoto, K., and Miyamoto, H., 2007. A novel nacre protein N19 in the pearl oyster Pinctada fucata. Biochemical and Biophysical Research Communications, 362: 158-163.
Zhang, L. J., and He, M. X., 2011. Quantitative expression of shell matrix protein genes and their correlations with shell traits in the pearl oyster Pinctada fucata. Aquaculture, 314: 73-79.
(Edited by Qiu Yantao)
(Received September 3, 2012; revised December 14, 2012; accepted September 22, 2013)
? Ocean University of China, Science Press and Spring-Verlag Berlin Heidelberg 2014
* Corresponding author. E-mail: hmx@scsio.ac.cn
 Journal of Ocean University of China2014年3期
- Journal of Ocean University of China的其它文章
- Effects of Sulfate Chitosan Derivatives on Nonalcoholic Fatty Liver Disease
- Variation of Bioaccumulation Ability of 2,2’,4,4’-Tetrabromodiphenyl Ether by Marine Diatom Skeletonema costatum Under Different N:P Ratios
- Preference of the Herbivorous Marine Teleost Siganus canaliculatus for Different Macroalgae
- Nitrogen and Phosphorus Budget of a Polyculture System of Sea Cucumber (Apostichopus japonicus), Jellyfish (Rhopilema esculenta) and Shrimp (Fenneropenaeus chinensis)
- Structure of Mitochondrial DNA Control Region of Pholis fangi and Its Phylogenetic Implication
- Fishery Biology of Jumbo Flying Squid Dosidicus gigas off Costa Rica Dome
