
Evaluation of Powdered Activated Carbon Treatment Process in Petrochemical Wastewater Purification
2019-01-18 02:50:36ZhangChaoYangLinSangJunqiangLiBengaoLiuTao
中國(guó)煉油與石油化工 2018年4期
Zhang Chao; Yang Lin; Sang Junqiang; Li Bengao; Liu Tao
(1. Central Research Institute of China Chemical Science and Technology, Beijing 100083; 2. SINOPEC Research Institute of Petroleum Processing, Beijing 100083; 3. CNOOC Environmental Consultation Centre, Beijing 100012)
Abstract: The powdered activated carbon treatment (PACT) process has been widely used in many industrial f ields, however, very few PACT processes are built for petrochemical wastewater treatment in China. An industrial PACT unit launched in a petrochemical plant was introduced and evaluated from both the practice and mechanism study. Practically, the PACT process showed excellent capability in pollutants removal, shock resistance, toxicity tolerance, and the COD and ammonium-N in eff luent of PACT unit assisted by PAC was equal to 15.5 mg/L and 0.7 mg/L lower than that without PAC addition, respectively. The wet oxidation regeneration unit was quite efficient in supplying regenerated PAC, and, however, the hard calcium sulphate scale and the high pollutant concentration solution needed to be carefully controlled. Moreover, although the carbon balance showed that the adsorption capability of regenerated PAC was negligible, the biological tests proved that the regenerated PAC increased microbe activity up to 17% more than pure activated sludge system, which was almost compatible with the fresh activated carbon.
Key words: powdered activated carbon treatment, petrochemical wastewater, adsorption, microbe activity
1 Introduction
As one of the most economical and sustainable process, biological nutrient removal (BNR) has been widely used in wastewater treatment. However, for some industrial wastewater containing refractory contaminants, such as petrochemical wastewater, BNR alone is not entirely reliable for meeting the increasingly stringent pollutant emission standards. An alternative approach, named the powdered activated carbon treatment (PACT), has shown significant performance over the conventional BNR process with regard to the treatment of this kind of wastewater.
The PACT integrates powdered activated carbon (PAC) and biological treatment by adding PAC directly to the aeration basin, and thus is also called powdered activated carbon-activated sludge (PAC-AS) process, which combines adsorption and biodegradation of organic matter together in one unit. Generally, activated carbon adsorption has the disadvantages of high price, while the biological treatment is not effective for refractory contaminants; however, the combination overcomes the shortcomings of the stand-alone technology. The addition of PAC enhances the biological stability and improves the effectiveness of the biological system with respect to the removal of the refractory compounds, featuring simple operation and low price. This approach can be implemented because PAC has a large surface area, acting as a supporting medium to provide bacteria with suitable living micro-environment, and can promote a synergistic effect between the adsorption and biological degradation. Therefore, the PACT has the following advantages over the conventional activated sludge system[1-3], viz: the improved process stability due to shock loading of organic compounds, the improved removal of COD from non-biodegradable compounds, the improved color removal, and the improved sludge thickening.
With the above-mentioned advantages, PACT has been accepted as one of the most economical and sustainable process in industrial f ields, such as that used for treating the dyeing wastewater, the chemical wastewater, and the pharmaceutical wastewater. However, there are very few PACT processes built for petrochemical wastewater treatment in China. As is known to all, petrochemical plants generate a large amount of wastewater with high content of organic toxic pollutants, which account for about 10% of the total industrial wastewater in China. Recently, two new emission standards, i.e. the Emission Standard of Pollutants for Petroleum Refining Industry (GB 31570–2015) and the Emission Standard of Pollutants for Petroleum Chemistry Industry (GB 31571–2015), have been published to put forward higher eff luent requirement. Therefore, it is necessary to evaluate the applicability of PACT in petrochemical industry, and also to illuminate the process effect as well as its mechanism.
2 Materials and methods
2.1 PACT/WOR process
A typical PACT/WOR process was built at a petrochemical plant in south China, with its process f low diagram shown in Figure 1. After oil separation and gas floatation, the petrochemical wastewater flows into the biological tank, from which the fresh PAC is pumped continuously into the aerobic zone so that adsorption and biodegradation can occur simultaneously. In the following clarification tank, some suspended solid mixture (containing activated sludge and saturated PAC) is sent back to the anoxic zone of the biological tank, and some solid mixture are thickened and piped into the wet oxidation regeneration (WOR) system, while the mixture is delivered for f iltration. The WOR system is a thermally self-sustaining unit operating at 243 °C and 6.2 MPa, so that the adsorbed refractory contaminations are degraded and the biomass is oxidized into inorganic substance, while the saturated PAC is regenerated without destroying the carbon structure. The regenerated PAC is routed to the aeration tank to be used as adsorbent f inally.
2.2 Biological experiments
In order to reveal the real effect of PAC and its synergistic effect with activated sludge, 4 laboratory sets of parallel biological systems were established. The active sludge (AS) and the wastewater (with a COD of 900―1 200 mg/L, and an ammonium-N content of 30―50 mg/L) were taken from a petrochemical BNR plant, while the fresh and the regenerated PAC were taken from the industrial PACT system of the petrochemical plant mentioned above. Each biological reactor was made of plexiglass with a volume of 15 L, while the hydraulic retention time, the sludge retention time, and the sludge reflux ratio were the same as those adopted by the industrial system (Table 1).
The first reactor (AS) was a pure active sludge system, the second reactor (F-PACT) was an active sludge system with fresh PAC addition and the third reactor (R-PACT) was an active sludge system with regenerated PAC addition. 16 L of raw wastewater were continuously pumped into each reactor daily, and the 3 reactors were operated identically except that 0.8 g of fresh PAC and 0.8 g of regenerated PAC were added into the F-PACT system and the R-PACT system every 12 hours, respectively. Reactor 4 (F-AS) was also a pure active sludge system; however, before 16 L of wastewater f lowed into the reactor, 2 g of fresh PAC were added to 20 L of raw wastewater prior to be subject to settling down for obtaining the supernatant to avoid the impact of PAC addition on the biological system.
2.3 Analytical methods
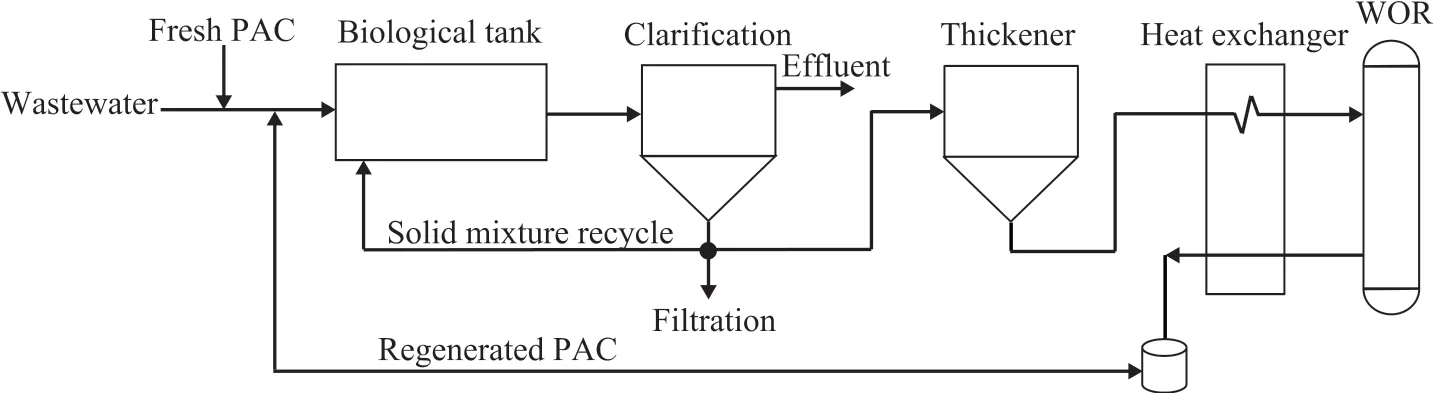
Figure 1 Process f low diagram of an industrial PACT/ WOR wastewater treatment system
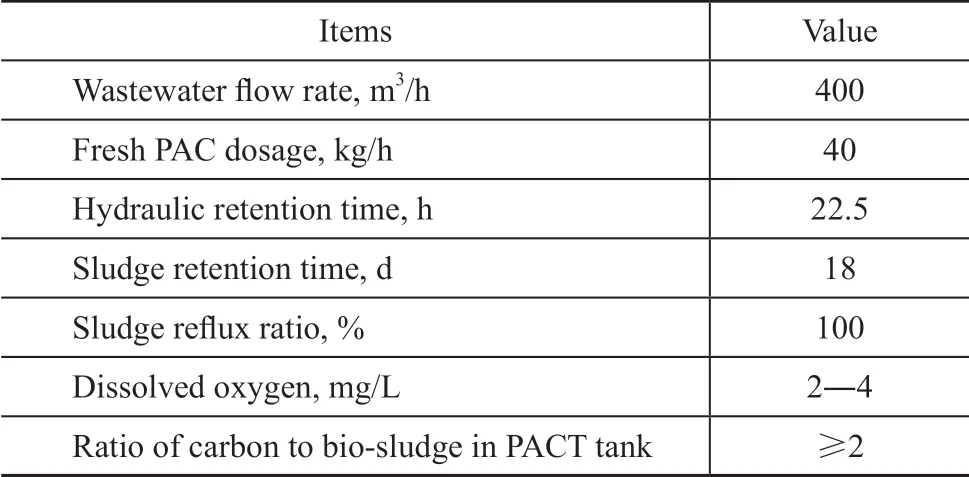
Table 1 Operating parameters of industrial PACT process
The total mixed liquid suspended solids (TSS) in the PACT system consisted of VSS, PAC, and other inorganic matters. The differential heating method was used to measure biomass, which took advantage of the material balance equation and the actual volatilization measurement of activated sludge and PAC under different temperatures to calculate the content of biomass and PAC. It was reported that almost all organic components of biomass could be carbonized and volatilized at 400 °C, while the powdered/granular active carbon could be volatilized at 600 °C or much higher temperature for 1 h[4]. According to the thermal gravimetric characteristics of the PAC used, a temperature of 650 °C was selected here. The following equations were used:
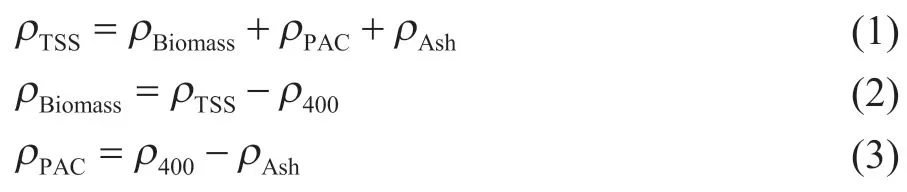
whereρTSS,ρBiomass,ρPACwere the content (mg/L) of TSS, biomass and PAC in the biological tank, respectively, andρ400andρAshwere the residual solid (mg/L) after drying at 400 °C and 650 °C, respectively.
In order to measureρTSS, a certain volume of powdered activated carbon and activated sludge mixed liquor was f iltered through a quantitative f ilter paper, dried at 105 °C, and then weighed at room temperature. The remaining sample was dried at 400 °C for 0.5 h and weighed to obtainρ400, and then dried at 650 °C for 1 h to obtainρAsh. The PAC adsorption experiments were carried out with a series of 250-mL Erlenmeyer-flasks containing 200 mL of stock solutions of phenol in distilled water to reach a concentration of 200 mg/L of COD. Fresh or regenerated PAC were dried at 105 °C, sieved through a screen of 100 mesh, and then precisely weighed from 100 mg to 500 mg, respectively, followed by adding 200 mL of wastewater in the f lasks, which were shaken in a shaker for 24 h at 25±1 °C. At the end of this period, the solutions were filtered and the residual phenol concentration at equilibrium in the f iltrate solutions was determined. COD and ammonium-N were measured according to standard methods[5]. The iodine number (qiodine) of activated carbon was obtained at 20±1 °C according to the Standard Test Method, ASTM D4607-86[6]. Thermogravimetry and derivative thermogravimetry were performed on a NETZSCH STA 409PC (NETZSCH Group, Germany). The weight of each sample was approximately 20 mg. The furnace temperature was increased from 40 °C to 750 °C at a rate of 10 °C/min with an air flow of 30 mL/min. The sample weight was monitored continuously as a function of temperature. The particle size was analyzed by an EyeTech laser size analyzer (Ankersmid Ltd., Dutch). The specific oxygen uptake rate (SOUR) was determined according to the literature description[7].
3 Results and Discussion
3.1 Industrial PACT/ WOR performance
3.1.1 PACT performance
(1) Eff luent quality without PAC addition
After the process facilities were completely built up, the activated sludge was cultivated without PAC addition, and the PACT system was operated as a traditional biological wastewater treatment unit for about 2 mouths. The system eff luent quality is shown in Figure 2. It can be seen that the eff luent NH3-N content could be decreased to 10 mg/L or lower, however, but COD was not stable and exceeded 60 mg/L frequently. The average value of COD and NH3-N was 68.5 mg/L and 3.5 mg/L, respectively, which could not reach the design values (Table 2). Clearly, the effluent quality could not meet the discharge standard during the traditional operation period.
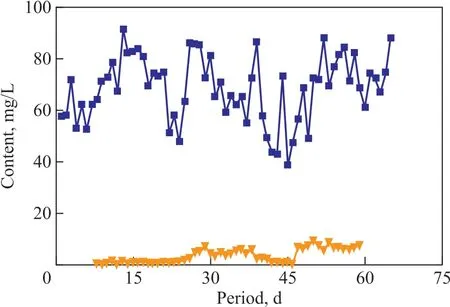
Figure 2 Eff luent quality without PAC addition
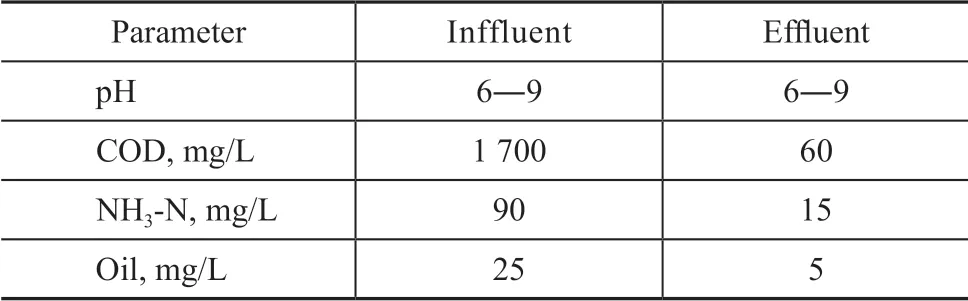
Table 2 Design value of industrial PACT process
(2) Eff luent quality with PAC addition
It is well known that the pollutant content in raw wastewater is largely affected by the production activities of petrochemical plant. It can be seen from Figure 3 that the actual COD content in the wastewater was occasionally more than 2 000 mg/L (sometimes as high as 3 000 mg/L), which significantly exceeded the design value of 1 700 mg/L. Even the inf luent quality f luctuated frequently, the PACT showed a better performance than the traditional operating mode. The average effluent content of COD and NH3-N was 53 mg/L and 2.8 mg/L, respectively, which were about 15.5 mg/L and 0.7 mg/L lower than the traditional operating mode.
It should be pointed out that the wastewater contained some surface active agents, which led to an 1.5-m height foam and a large amount of activated sludge floatation in the biological basin, thus resulting in poor removal performance before PAC addition. Surprisingly, with the assistance of PAC, sludge foaming scarcely happened in the biological basin. Therefore, the PACT system operation records demonstrated its good effectiveness in removing COD and ammonium-N, its ability to cope with frequent fluctuations in waste composition, and its excellent capability against toxic substances.
3.1.2 WOR operation
(1) Regenerated carbon The discharged wastes of spent PACT system solids were sent to a gravity thickener, then to a slurry storage tank, and finally to the WOR system for carbon regeneration. A physicochemical property comparison between the regenerated and the fresh carbon is shown in Table 3. It can be seen from Table 3 that after regeneration reaction, the saturated adsorption capacity decreased by 91% and the iodine value reduced by 82%, indicating that the adsorption capability of regenerated carbon was reduced greatly. Also, the decreased mean particle size and specific surface area revealed remarkable structure changes in the regenerated carbon.
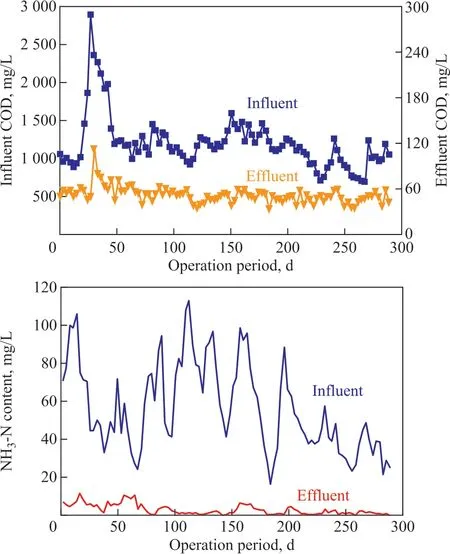
Figure 3 The inf luent and eff luent quality of PACT with PAC addition
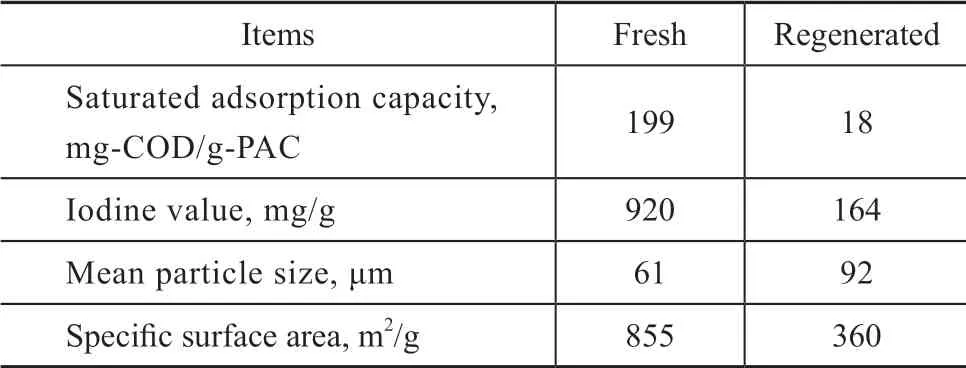
Table 3 Comparision of fresh and regenerated PAC
(2) Scale
Under high temperature and pressure, carbon regeneration reaction caused serious scaling in the reactor and the heat exchanger (Figure 5). According to the operating regulations, the WOR unit had to be stopped until the scale was thoroughly cleaned up to ensure good heat efficiency and safety of the unit. Three different scale samples from the heat exchanger, the bottom and the upper part of the reactor were analyzed by XRF, respectively (Table 4). Clearly, the samples had similar composition with SO3, CaO, Al2O3as the main components, indicating that the sulphate, especially CaSO4, was the principal substance in the scale. The formation of calcium sulphate in heat exchanger pipelines created a hard and dense layer inhibiting heat transfer, making the heat efficiency decreased significantly. As a result, the WOR unit must be cooled down to room temperature for scale cleaning in both reactor and exchanger about every 7 days. Since the scale was formed at high temperature and pressure, cleaning was a hard task even by joint means of acid pickling and high-pressure water jet.

Figure 4 Scales in WOR pipes
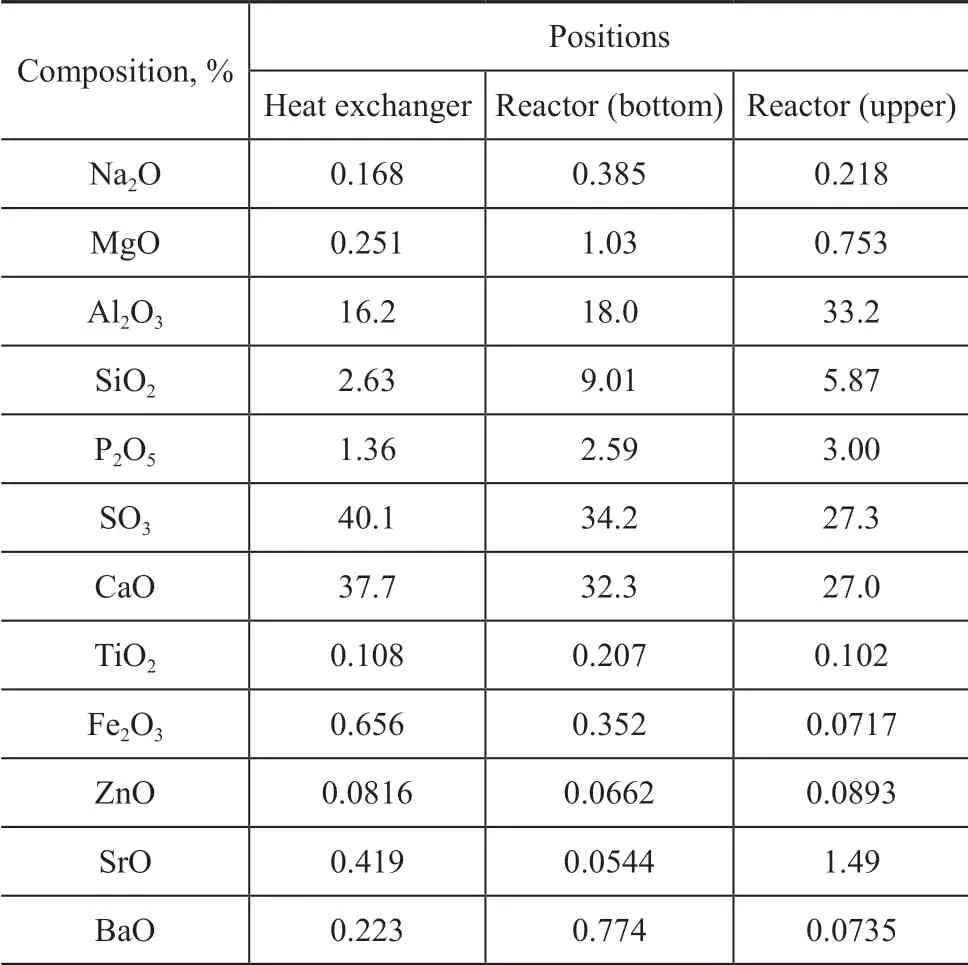
Table 4 Scale composition analyzed by XRF
(3) Pollutants
During the carbon regeneration reactions, large amounts of biomass were oxidized to provide the heat required for wet oxidation reaction, only few sludge was discharged. Apparently, WOR was very helpful for sludge reduction in this aspect. On the other hand, however, some pollutants could not be completely decomposed in WOR; they were returned to PACT together with the regenerated carbon. It was found that ammonium-N and COD increased remarkably when a mixture of regenerated PAC solution was added to the influent of PACT. Therefore, pollutants in the outlet of WOR (i.e. the mixed liquor containing regenerated carbon) were determined (Table 5). It can be seen that COD was 67% to 900% of the design value, while ammonia-N was 200% to 437% of the design value in Table 2. Since the f lowrate of mixed regenerated PAC solution was 5% to 10% of the raw wastewater, the solution would increase the bio-load and decrease the PACT resistance to fluctuations of wastewater quality. Furthermore, the use of nitric acid in scale cleaning increased thecontent in the wastewater substantially, which was disadvantageous to denitrification.
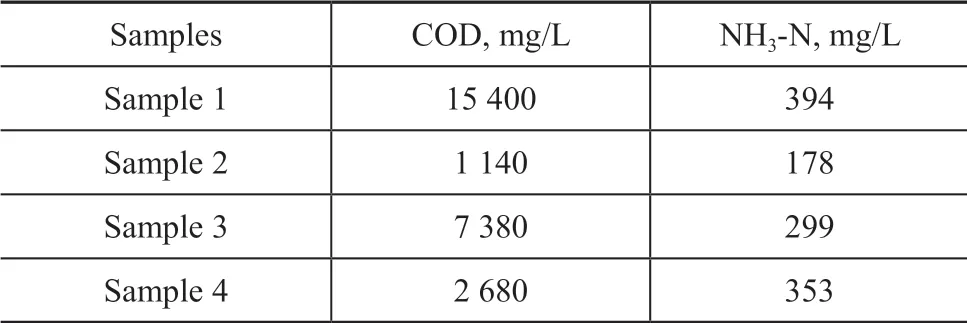
Table 5 Pollutants in the mixed regenerated PAC solution from WOR outlet
3.2 Carbon balance
In order to reveal the PAC adsorption and its mutual effect with biomass, it is necessary to determine its content in the biological tank. The PAC concentration was determined through both theoretical and experimental methods.
3.2.1 Experimental results
The sludge composition in the PACT biological tank was analyzed, with the result shown in Figure 6. Being different from traditional wastewater treatment process, the PACT sludge concentration (9 014 mg/L) was almost 2 or 3 times more than the conventional active sludge.
The PACT sludge was composed of 67% of active carbon, 23% of biomass and 10% of ash, indicating that active carbon would play an important role in pollutant elimination; on the other hand, the total content of biomass and ash was similar to that of traditional biological sludge, implying that the typical biochemical metabolism reactions happened during the purification process. The thermal gravimetric and differential thermal curves in Figure 7 were coincident with the data mentioned above: a 70.5% loss in the weight of total sludge mixture before 102 °C was mainly water, the weight lost between 102 °C and 400 °C could be attributed to biomass oxidation, and the weight loss taking place from 400 °C to 650 °C was ascribed to carbon combustion.
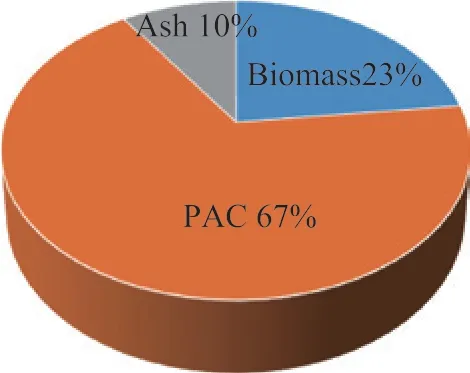
Figure 6 PACT sludge composition
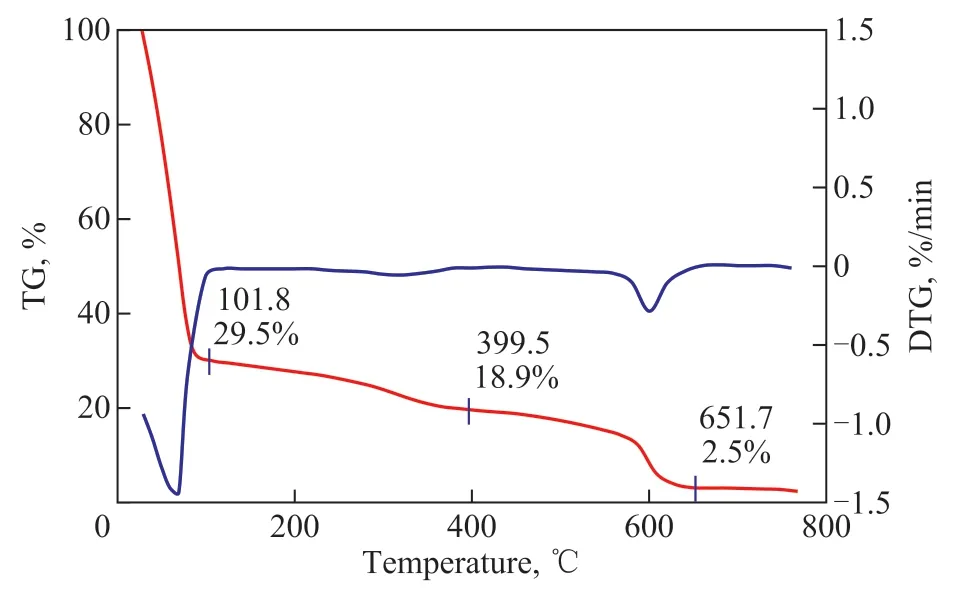
Figure 7 Thermal gravimetric and differential thermal curves of PACT sludge
3.2.2 Theoretical method
To facilitate the derivation of equations, it is assumed that the saturated PAC can be totally regenerated without weight loss, and all the biomass can be transformed to CO2and H2O in the regeneration unit at high temperature and pressure.
Given the volume of PACT biological basin wasV, the sludge retention time wasθ, the content of total sludge in second settling tank, which was equal to the recycling sludge, wasρSettling, the amount of discharged sludge from the settling tank wasW, the content of regenerated PAC from WOR unit wasρReg, and the fresh PAC content in biological basin wasρFresh.
Based on the parameters defined above, the mass relationship in PACT system can be calculated as follows:The total biomass in PACT tank:V×ρBiomass
The discharged biomass from PACT system per day:

The discharged total suspended sludge per day:

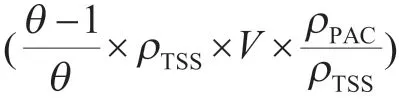
The residual total suspended sludge:
And the PAC in the residual total suspended sludge:
The discharged sludge (the amount of which wasW) was sent to the dewatering unit, which had a dewatering capacity of 4 t/h while continuously running 24 hours every day, thusW=4×ρsetting×24. Therefore, the amount of sludge that was processed in the regeneration unit wasand the regenerated PAC was
As for the PACT biological tank, there was the following equation:

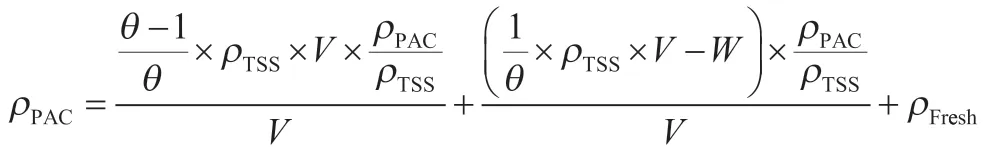
As it has been mentioned above,θ=18 d,ρTSS=9 014 mg/L,ρPAC/ρTSS=0.67,V=9 000 m3,ρFresh=100 mg/L,ρSetting=20 000 mg/L, andW=4×ρSetting×24=1 920 000 mg. Therefore, theρPACcould be calculated as 5 995 mg/L, which was very close to the measured 6 074 mg/L, indicating that the theoretical carbon balance was acceptable.
Judging from the carbon balance, it could be calculated that theρRegderived from the regeneration unit was 192 mg/L. In other words, after wastewater entered the PACT basin, the biomass, saturated PAC, regenerated PAC and the fresh PAC would mix completely, and the saturated PAC content was 5 695 mg/L while the unsaturated PAC content (i.e. regenerated PAC and fresh PAC) was only 292 mg/L. As it will be seen in the following tests, merely 3.5 mg of COD could be adsorbed by 192 mg of regenerated PAC, indicating a weak adsorption capability. Therefore, the main effect of regenerated carbon is probably to supply a kind of biomass carrier rather than adsorption.
3.3 Biological tests
As has been mentioned above, 192 mg of regenerated carbon coupled with 100 mg of fresh PAC were added per liter of wastewater as they were pumped into the biological PACT basin. Since the maximum adsorption capacity of 1 g of fresh carbon and 1g of regenerated carbon was 199 mg and 18 mg of COD, respectively, the addition of PAC could theoretically adsorbed 23 mg of COD per liter of wastewater, which accounted for only 1.35% of the design value of influent. Clearly, the direct adsorption was very weak compared to the COD that should be reduced. On the other hand, the industrial PACT with carbon addition showed a remarkably better performance than that without carbon addition, thus 4 laboratory sets of parallel biological systems were established to study the influence of PAC on biological treatment.
3.3.1 Eff luent quality
Figure 8 shows the comparison of eff luent between the 4 reactors after they were operated for 20 days. The average COD and ammonium-N of AS reactor was 122.1 mg/L and 28.3 mg/L, respectively, indicating that large amounts of organic compounds still existed and nitrification could hardly happen. As to the F-AS reactor, although merely pretreatment by PAC could reduce COD by 25 mg/L in raw wastewater (experiment data were not shown here), the average COD of biological eff luent decreased to 115.6 mg/L, which was less than the absorbed COD amount during pretreatment and was only reduced by 6.5 mg/L in the effluent compared to AS, implying that the PAC pretreatment could not significantly improve the COD removal efficiency. However, even ammonium-N was not removed during pretreatment, since its content in biological eff luent decreased to 23.1 mg/L, and this might occur because some toxic substances were adsorbed by PAC, which would be less harmful to biomass, especially the nitrifying bacteria.
It also can be seen from Figure 8 that the removal efficiency increased remarkably when either fresh PAC or regenerated PAC was added into the biological basin. The average COD and ammonium-N were 90.0 and 12.1 mg/L in F-PACT, and 94.8 and 14.0 mg/L in R-PACT, respectively. Apparently, both organic substance degradation and ammonium nitrification were largely enhanced compared to the case of pure activated sludge system. For example, the COD and ammonium-N in F-PACT eff luent decreased by 32.1 mg/L and 13.2 mg/L compared with the case with the AS system, respectively. As it has been demonstrated by F-AS, carbon adsorption played some, but not a key role in biological nutrient removal, even it did improve the effluent quality to a certain extent. This deduction could also be proved by R-PACT: although the regenerated PAC had a low adsorption capacity, its eff luent quality was close to that of F-PACT and was much better than AS and F-AS. Therefore, the enhancement in PAC-AS reactor indicated that besides the biodegradation similar to the biological basin of AS system and the adsorption similar to the pretreatment in F-AS system, there might be a mutual effect between microorganisms and PAC.
3.3.2 Specific oxygen uptake rate
SOUR is referred to as the rate of oxygen utilization, which indirectly indicates the biomass activity. The SOUR comparison between the 4 reactors is shown in Figure 9. The SOUR of AS and F-AS systems was 22.5 and 22.8 mg-O2/(g-biomass·h), respectively, which suggested that the difference in microbe activity of the 2 reactors was not obvious. In contrast, the SOUR of R-PACT and F-PACT increased to 26.3 and 27.2 mg-O2/(g-biomass·h), respectively, indicating that the microbe activity was enhanced by 17%―20% than pure activated sludge system. Consequently, the mutual effect of maintaining high biomass activity promoted the PACT treatment efficiency.
4 Conclusions
Upon analyzing an industrial PACT/WOR process applied in petrochemical wastewater treatment system, the operating effect and the process mechanism were evaluated. The following conclusions were achieved:
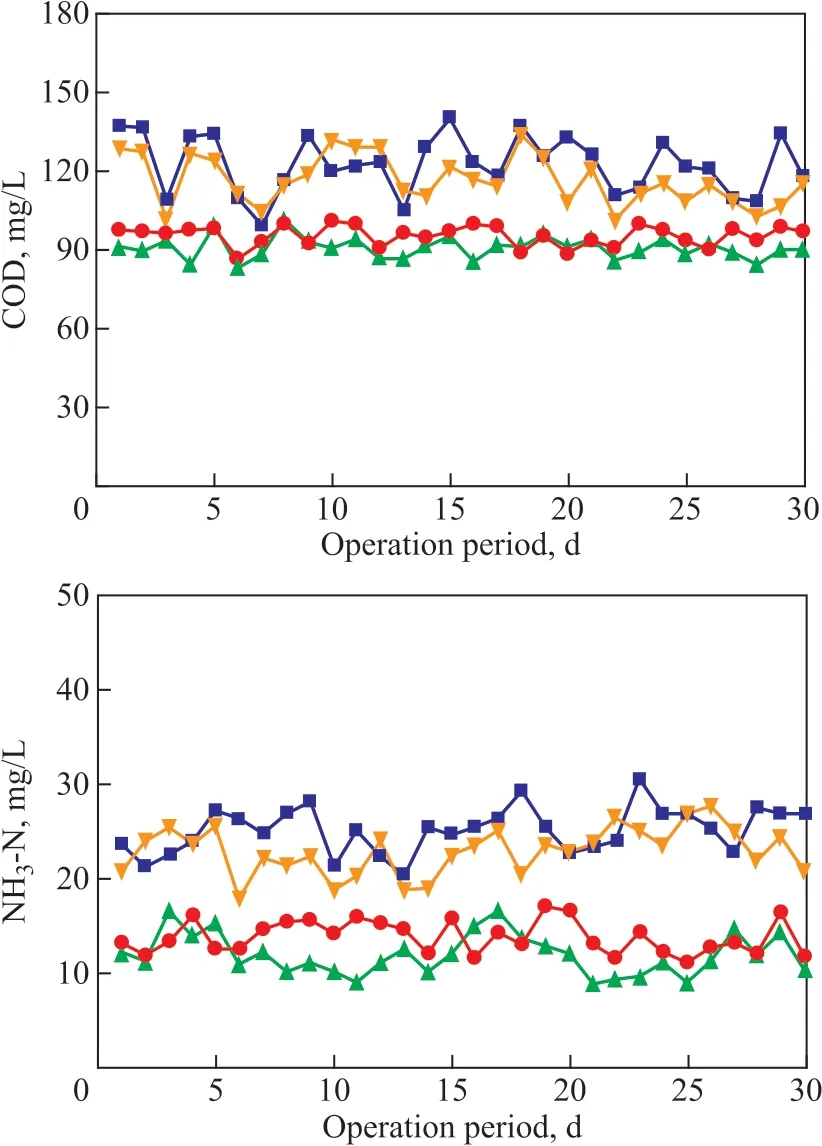
Figure 8 Comparison of pollutants removal in biological systems with/without PAC addition
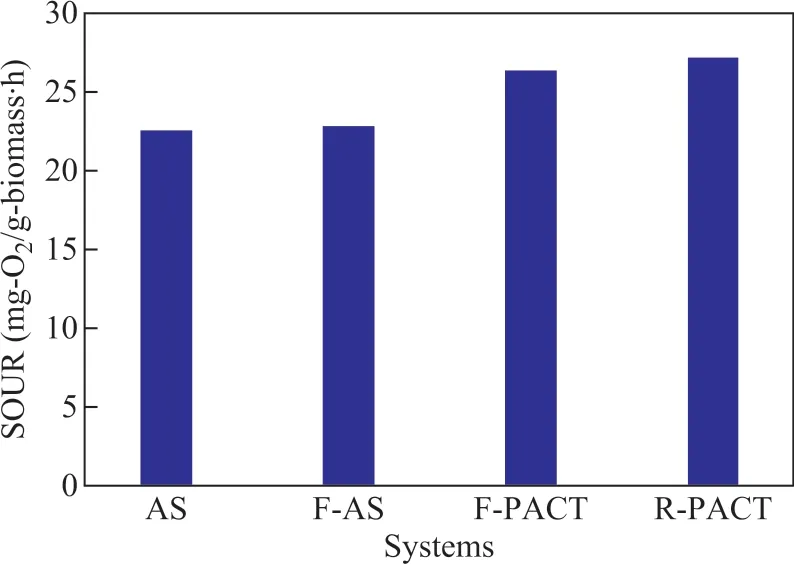
Figure 9 SOUR in different biological systems
1) PACT was effective in removing COD and ammonium-N and was able to cope with fluctuations in petrochemical wastewater quality. Higher eff luent quality was achieved by the simultaneous adsorption and biodegradation process than by the biological treatment alone.
2) WOR was helpful in regenerated PAC supplement and sludge reduction. The WOR unit would be better if the scale and the pollutants in mixed regenerated PAC solution could be controlled.
3) Carbon balance revealed that the content of PAC in PACT basin was almost 3 times more than the biomass, and however, the absorption by regenerated carbon could be negligible.
4) Compared to PAC pretreatment before biological treatment, PAC addition in the biological basin was proved to be more efficient because the microbe activity was enhanced by 17%―20% than pure activated sludge system. Therefore, the interactions of carbon adsorption, biomass degradation, and their mutual effect improved the water quality together.
Acknowledgments:This work was financially supported by SINOPEC (CLY15043) and CRICC of ChemChina (2017-KZY03 and 2018-KZ-Y04). Some operating records were acquired from the industrial PACT workshop of the petrochemical plant.
- 中國(guó)煉油與石油化工的其它文章
- Boosted Biodegradability and Tribological Properties of Mineral Base Oil by Methyl Diethanolamine Fatty Acid Esters
- Extractive Distillation of Methyl Acetate-Methanol Azeotrope Using [DMIM]DMP as Solvent
- Shortcut Method of Design and Energy-Saving Analysis of Sargent Dividing Wall Column
- Exploring the Degradation Potential of Halomonas Bacteria from Oil-contaminated Marine Environment
- Combined Use of Co-immobilized Lysozyme and Lipase and Chemical Inhibitors in Circulating Cooling Water System
- Phenol Wastewater Degradation by Electrocatalytic Oxidation with RuO2-IrO2-SnO2/Ti Anodes in the High Gravity Field