Experimental investigation of wall-bounded turbulence drag reduction by active control of double piezoelectric vibrator *
Jian-xia Bai, Yong-xiang Huang, Nan Jiang, Xing-yu Ma, Zhan-qi Tang
1. Department of Mechanics, School of Mechanical Engineering, Tianjin University, Tianjin 300354, China
2. Department of Mathematics, Tianjin University Renai College, Tianjin 301636, China
3. State Key Laboratory of Marine Environmental Science, College of Ocean and Earth Sciences, Xiamen University, Xiamen 361102, China
4. Tianjin Key Laboratory of Modern Engineering Mechanics, Tianjin 300354, China
Abstract: In order to manipulate the large-scale coherent structures in the wall-bounded turbulence and reduce the skin-friction, an active-control experimental investigation is performed by using the synchronous and asynchronous vibrations of double piezoelectric vibrators embedded spanwisely on a smooth flat plate surface. A TSI-IFA300 hot-wire anemometer and a TSI-1621A-T1.5 hot-wire probe are used to measure the time series of the instantaneous velocity at different locations. The influences of the vibrations on the wall-bounded turbulence are compared in a multi-scale point of view. A disturbance Reynolds Number Red=ρd2f/μ is introduced to represent the disturbance. A probability density functions (PDFs) of the multi-scale components of the turbulence velocity and the multi-scale conditional phase-averaged waveform are studied in detail using the wavelet transform. The results show that the maximum drag reduction rate 18.54% is obtained at 100 V/160 Hz and Red=0.54 in the asynchronous vibration mode. The disturbances generated by the vibrators have a significant influence on the sweep events of the burst. The asynchronous vibration model is more effective than the synchronous vibration one. A possible physical mechanism is suggested to explain why the disturbance frequency of 160 Hz leads to an optimal parameter set for the drag reduction.
Key words: Wall-bounded turbulence, active control, drag reduction, piezoelectric vibrator, multi-scale analysis, conditional phase-averaged waveforms, coherent structure
Introduction
The wall-bounded turbulence contributes the most part of the frictional drag for vehicles with a large amount of fuel consumption and environment pollution. For instance, for a modern commercial aircraft, the skin friction contributes more than 50% of the drag[1]. It is widely accepted that large-scale coherent structures are the key structures in the generation and maintaining of the wall-bounded turbulence[2-4]. Hence, the control of the wall-bounded turbulence and the drag reduction should begin with and focus on the manipulation of the large-scale coherent structures[5]. In the past few decades, the wall-bounded turbulence control strategies focused on passive approaches, for instance, the riblet surfaces[6],the super-hydrophobic surfaces[7], the wavy surface[8],and the compliant surface[9], proposed to suppress the generation or the evolution of large-scale coherent structures. These techniques work in passive manners without a feedback loop to detect the coherent structures. One limitation of this type of control strategy is its low drag reduction rate[10].
On the other hand, the active control enjoys a wide range of adaptability to complex flows. With a small amount of energy input, it can improve significantly the control effect. In the real implementations, a predetermined method is more feasible because of the high drag reduction rate and the easy implementation. By using different types of actuators to transform the electric signals into a small disturbance, the active control can achieve effective drag reductions. Cattafesta and Sheplak[11]further classified actuators into the electromagnetic actuators,the fluid actuators, and the solid actuators. Segawa et al.[12]designed a set of devices that generate vibrations through an actuator array, effectively reducing the regularity of the strip structures in the near-wall region. Itoh et al.[13]used a speaker to drive a polyethylene sheet on the wall, to make it vibrating along the normal direction, and achieve a drag reduction rate of 7.5%. Choi et al.[14]introduced a plasma actuator and obtained a drag reduction rate of 45%. Quadrio and Ricco[15]obtained a drag reduction rate of 44.7% through the spanwise vibration.
Compared with other actuators, the solid actuators enjoy relatively higher control efficiency due to their direct interaction with the flow field. Solid actuators include the wall vibrators and the piezoelectric (PZT) vibrators. The PZT vibrators can conveniently generate continuous and adjustable disturbances into the flow field[16], to produces disturbances with a small energy input and achieve a high-efficiency control. They have a wide frequency range, a good stability, a high driving accuracy, and a strong resistance to the electromagnetic interference.Bai et al.[17]used an array of PZT vibrators arranged spanwisely and obtained a drag reduction rate of up to 50%. Rathnasingharn[18]attached a nickel-plated piezoelectric ceramic sheet to a film, to form a normally blowing/sucking device allowing the film to blow the air in the cavity out of the hole on the flat plate, driven by the vibration of the piezoelectric ceramic sheet. Cattafesta et al.[19]proposed a pattern of PZT vibrators and derived the frequency response function for the piezoelectric vibrator using an optimization algorithm. Bai and Zhou[20]used an array of PZT oscillators arranged in a spanwise direction as an actuator and achieved the maximum drag reduction of 50%. Zheng et al.[21]conducted a comparative study of the control effect of a single piezoelectric vibrator under different working conditions, and obtained a maximum drag reduction rate of 26.83%.
1. Experiment setup and technique
The active-control experiment is carried out in a closed-circuit wind tunnel with a test section of 1 500 mm (length)×800 mm (width)×600 mm (height).Its cross section is a rounded rectangle. The wind speed in the test section could be adjusted continuously between 0.5 m/s and 40 m/s. The free-stream turbulence intensity is less than 0.2%. A test plate (1 700 mm in length, 600 mm in width, and 15 mm in thickness) is placed along the centerline.The test plate is made of Plexiglas with a halfelliptical leading edge of a major to minor axis ratio of 16:1. A turbulent boundary layer with a zero-pressure gradient along the flow direction is formed by adjusting the inclination of the plate. In order to promote the boundary layer transition to the turbulent state, a trip wire and a piece of abrasive paper are placed downstream the leading edge.
On the centerline 1 090 mm from the leading edge of the plate, a 150 mm long and 100 mm wide groove is made (see Fig. 1). The PZT vibrator used in our experiment consists of a copper sheet of 3.60 mm wide and 0.20 mm thick and a piezoelectric ceramic sheet of 3.60 mm wide and 0.22 mm thick (see Fig.2(a)). The effective vibrate length, thickness, and width of the oscillators are, respectively, 30.00 mm,0.42 mm and 3.62 mm. Two vibrators are symmetrically distributed along the spanwise direction(see Fig. 2(b)). Their power cables are placed at the backside of the plate through a preformed hole of the wind tunnel. They are connected to an AC variable-frequency power supply, welded on the piezoelectric ceramic sheet and the copper sheet,respectively. If the copper sheets of the two piezoelectric vibrators are connected to the same electrode of the power supply and the ceramic sheets are connected to the other one, the piezoelectric vibrators would vibrate in the same direction: the vibrators are in a synchronous control condition(SYN). Otherwise, the vibrators are in an asynchronous control condition (ASYN).
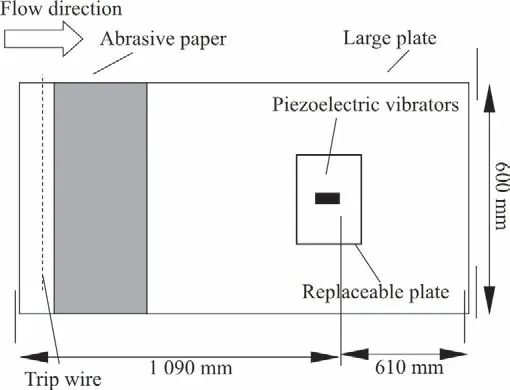
Fig. 1 Schematic diagram of the flat plate
Figure 3 shows a sketch of measurements in the turbulent boundary layer perturbed by the double PZT vibrators. The coordinates x, y and z refer to the streamwise, wall-normal and spanwise directions,respectively. The vibrators are mounted in parallel above the 5 mm-deep cavity of the plate in the cantilever form. A beam model is used for the piezoelectric vibrators. The vibrating part of the piezoelectric vibrator is a composite beam. When the piezoelectric vibrator is driven by the AC, the cantilever beam would vibrate transversely and thus incur a velocity disturbance to the flow field through the upper surface. The free end of the PZT oscillator moves up and down with a certain amplitude in the y-z plane. The two PZT oscillators work in synchronous and ansynchronous ways to introduce different kinds of perturbation into the turbulent boundary layer flows.
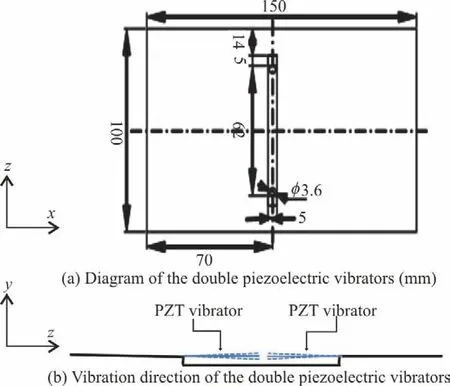
Fig. 3 (Color online) Sketch of measurements in turbulent boundary layer perturbed by double PZT vibrators
The TSI-IFA300 hot-wire constant-temperature anemometer and the TSI-1621A-T1.5 single-hot-wire probe, manufactured by the TSI Company, are used in the experiment. The sensitive hot-wire material is a tungsten filament of 1.25 mm in length and 4 μm in diameter. The probe is calibrated using the TSI-1128 hot-wire probe calibrator. The WIN-30DS4 12-bit A/D card manufactured by the UEI Company (the US) is used as the data acquisition card. The hot-wire probe supporting rod is fixed on the CCTS-1193E 3-D automatic coordinate framework system. The power supply for the PZT vibrators is an Everfine GK 10005 AC variable-frequency regulated power supply, used to apply different voltage amplitudes and vibration frequencies to the vibrators.
2. Analysis of experimental results

where ρ is the air density.The results show that the mean velocity profiles agree with the logarithmic-law of formula (2) in the inner scale units (see Fig. 4), which is written as

where B is the vertical intercept. A up-shifts in the logarithmic region is observed. This consists with the characteristics of the typical drag-reduction case,which can be further described as follows[22]

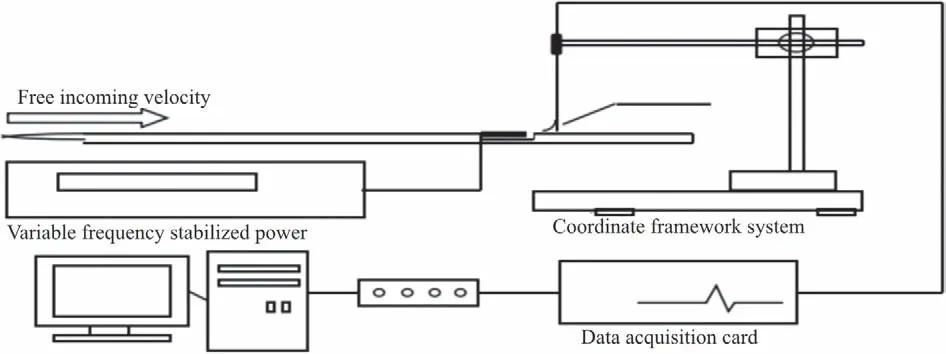
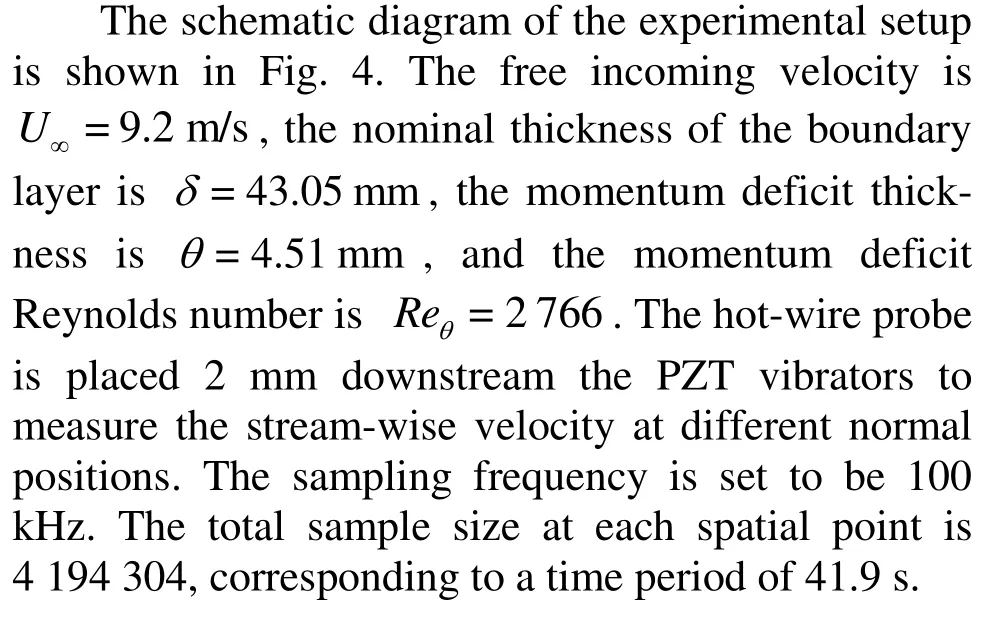
Fig. 4 Schematic diagram of theexperimental setup
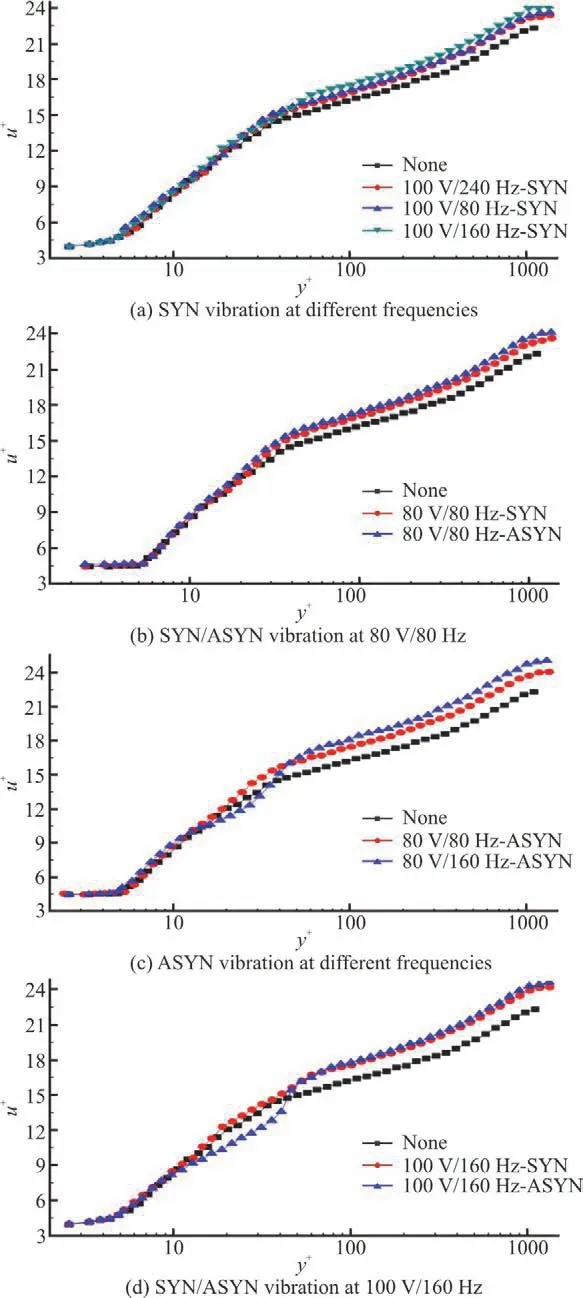
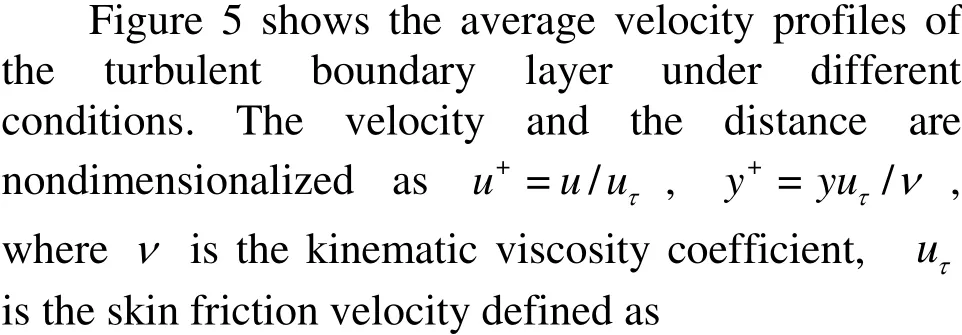
Fig.5 (Color online)Averagevelocity profiles of theturbulent boundary layer on the plate
The vertical intercept δ Bof the logarithmic region is proportional to the relative drag-reduction rate δτw/τw.With the same voltage,when the vibrating frequency is 160 Hz,the logarithmic region shifts up the most significantly and the intercept δ B reaches the maximum,indicating the best drag reduction effect.With the same voltage and frequency,the up-shift of the logarithmic region under the asynchronous controlled condition is larger than that under the synchronous controlled condition,indicating that the asynchronous control achieves a larger drag reduction than the synchronouscontrol.
We introduce the disturbance Reynolds number Redto represent thedisturbance

where d is the amplitude of the piezoelectric vibrator,f is the frequency of the vibration and μ is the dynamic viscosity coefficient.The disturbance Reynolds number and the drag reduction rate under different conditionsare shown in Table1.
A power supply is used to actuate the PZT oscillator with a certain frequency and amplitude,which can support a wide range of working frequencies and voltage amplitudes. That is, the vibration frequency and amplitude of the vibrator can be used to characterize the disturbance under all working conditions. Our results show that the drag reduction rate is closely related to both the voltage magnitude and the vibrating frequency, as shown in Table 1.With the same vibrating frequency, the higher the voltage magnitude is, the larger the drag reduction will be. Moreover, the vibrating frequency of 160Hz brings about the best drag-reduction effect under the ASYN controlled conditions. For example, the largest drag reduction (18.54%) is obtained under the 100 V/160 Hz- ASYN condition. The drag reduction rate increases with the disturbance Reynolds number except in the 100 V/ 240 Hz- SYN case. When thedisturbance Reynolds number is 0.54 under the 100V/160Hz-ASYN condition,the drag reduction rate is the largest.

Table 1 Disturbance Reynolds number and drag reduction rate under different conditions
Figure 6 shows the turbulent kinetic energy curves under different conditions.It can be seen that the turbulent kinetic energy in the near-wall region changes significantly under the controlled conditions.Vibrations of the PZT vibrators make the turbulent kinetic energy more concentrated around the maximum value.Under the SYN control conditions,the vibration of the vibrators at 160Hz has the most significant influence on the turbulent kinetic energy,leading to the highest peak value.Under the two ASYN control conditions(160 Hz),one sees two obvious maxima and a minimum on the turbulent kinetic energy curves.The normal positions of the three extreme values are y+=11,y+=21 and y+=30,respectively.
To understand better the multi-scale property of the present cases,we make here the classical wavelet analysis.The wavelet transform of the streamwise velocity signal is made.A compact set of the orthogonal discrete wavelet db2 is selected as the basis functions.We decompose the turbulent fluctuations into different scalesS=1-22,covering the smallest to the largest scales,thus,the turbulent characteristics,such as,the bursting process and the sweep motions,can be revealed.The wavelet transform is an effective approach to decompose the turbulent fluctuation signals into the multi-scale signals,and is widely used in the data processing of the turbulence[23].
We recall briefly the basic principles of this method.For a given one dimensional velocityu ( t ),its wavelet coefficient Wu( a, b) under the wavelet function Wab( a, b) isdefined as

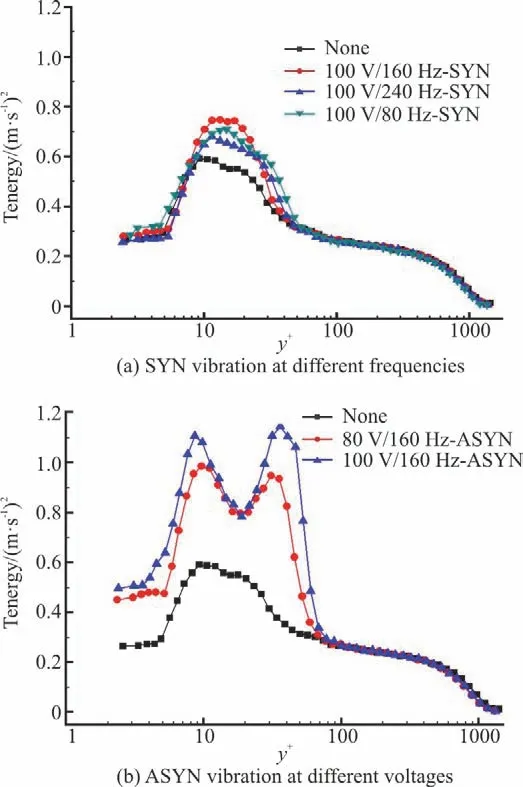
Fig.6 (Color online)Turbulent kinetic energy of the turbulent boundary layer
where the family of wavelet functionsWab(t )is obtained by translating and stretching the wavelet generating functionW (t ),respectively,for time b and scale a,i.e.

The energy conservation law iswritten asfollows

where
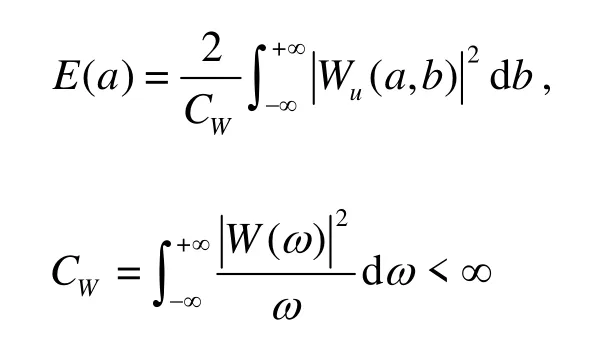
in which W (ω) is the Fourier transform of the wavelet generating function W(t).
Figure 7(a) shows the relationship between the scale a and the average frequency ftof the turbulent structure in the uncontrolled case. Figures 7(b)-7(d) show the scale-dependent energy distribution at different normal positions.
The maximum energy scale under the 160 Hz conditions is the 8th scale, corresponding to a time scale of 6.25 ms. Note that the average burst period of the turbulent structure is about 6.08 ms, corresponding to a frequency of 164 Hz. This might be the reason why we have the most significant drag reduction rate at 160 Hz. Visually, the vibration of the piezoelectric vibrator makes the kinetic energy more concentrated around the maximum energy scale, and the peak energy is higher than that in the uncontrolled case, as seen more obviously in the synchronous control than in the synchronous control. With the normal position away from the wall, the maximum peak value of the turbulent kinetic energy decreases gradually.
In the turbulent boundary layer flows, the near-wall structures (such as, the quasi streamwise vortices and thelow-speed streaks) have a dominant contribution to the turbulent energy, which is also shown by the energy spectrium distribution in Fig. 7.It indicates that the near-wall structures are at the scale of S=8 in the current case. In the outer layer,the coherent structures have a larger scale than the scale of the near-wall structures as reported in the numerous investigations[23]. Thus, following the previous results, the near-wall energetic structures are considered as in the small scales, and the scales larger than S=8 are supposed to be the large scales.
Figure 8 shows the probability density functions(PDF) of the wavelet coefficient Wu(a, b) at the energy-maximum scale for different distances and conditions. The tails of the PDF curves under the controlled conditions are significantly wider than those under the uncontrolled condition at+=11y and y+=30, as shown in Figs. 8(a), 8(b). It indicates that a lower intermittency is generated under all controlled conditions. The tail of the PDF curve under the 100 V/160 Hz-ASYN condition is the widest among those under all conditions, thus inducing the lowest intermittency and resulting in the best drag reduction effect.
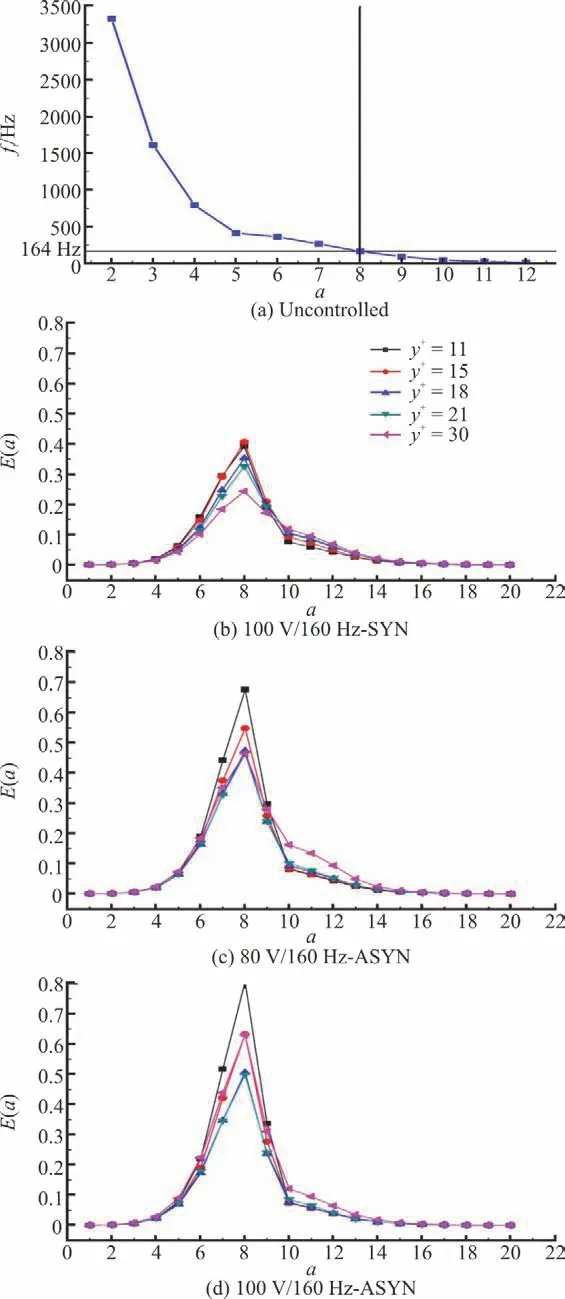
Fig. 7 (Color online) The relationship between scale and average frequency of turbulent structure and scale-dependent energy distribution at different normal position
Figures 8(c)-8(f) show that the width of the PDF curves decreases with the increase of the distance from the wall surface in the buffer layer. This trend illustrates that the intermittency decreases as the normal position moves upward. The PDF curves are symmetrical and stable under these conditions except under 100 V/160 Hz-ASYN and 80 V/160 Hz-ASYN conditions. The PDF curves are disturbed by the vibration and the modulating effect of the periodic disturbance generated by the PZT vibrators on the coherent structure can be seen under two 160 Hz-ASYN conditions.
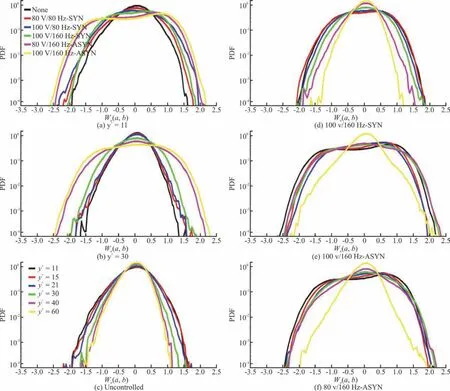
Fig.8 (Color online)PDFs of the wavelet coefficient Wu ( a, b)
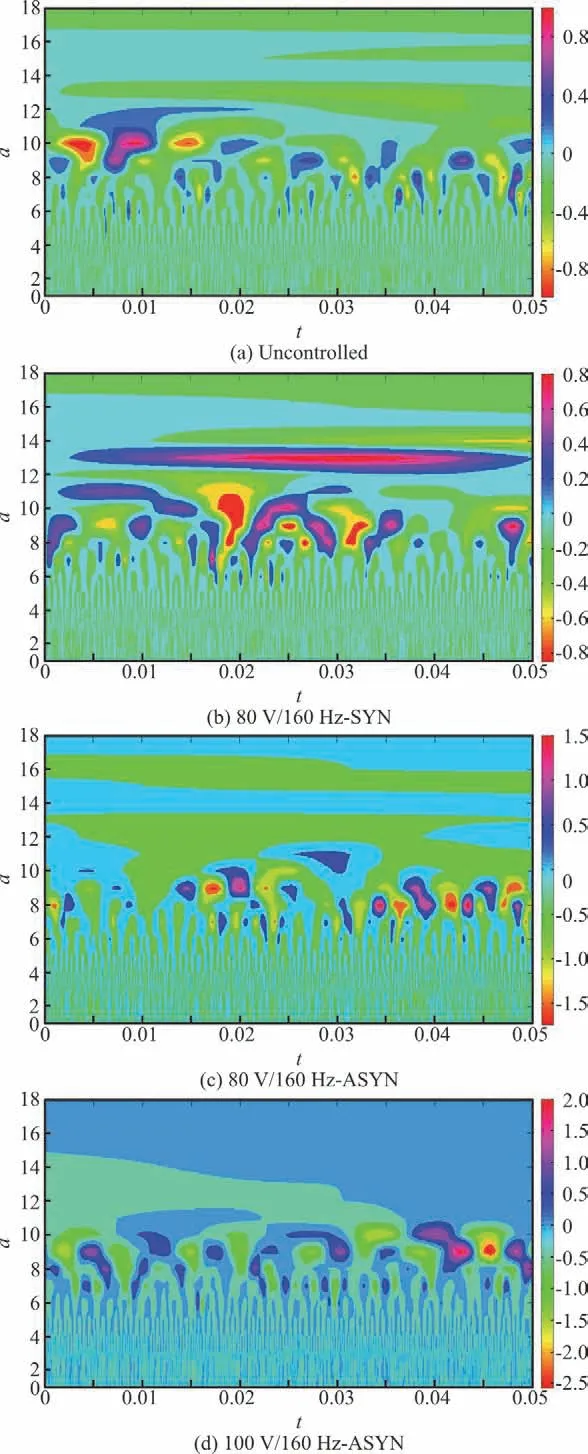
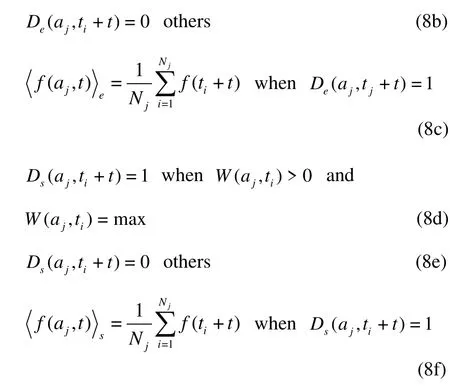
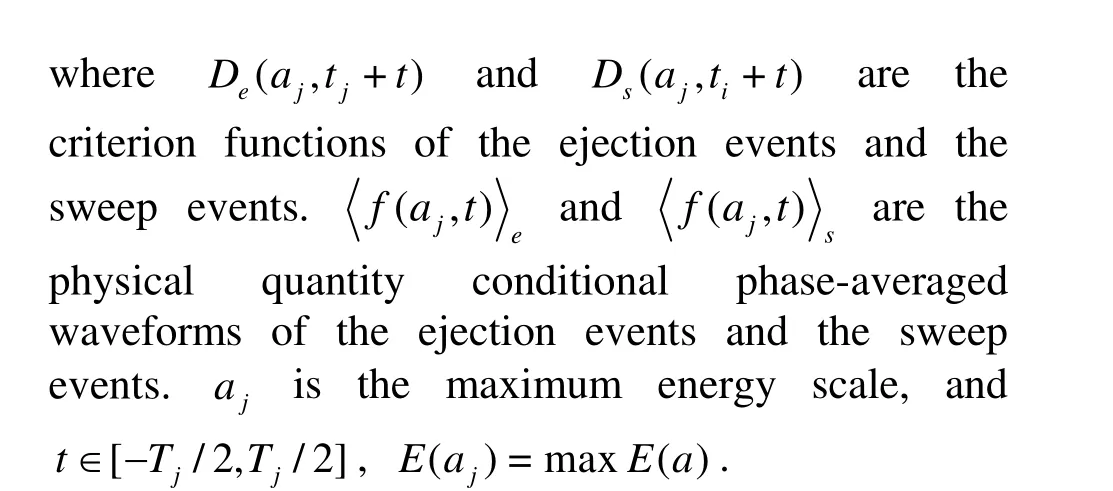
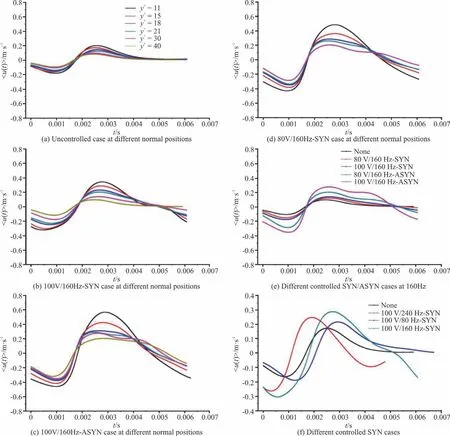
Figure 9 shows the energy contour maps versus the scale parameter a and the wall-normal locations y+under several different conditions.Experimentally,the energy-maximization scale in the buffer layer(5 All controlled cases can lead to a higher concentration of the turbulent fluctuating kinetic energy around the energy-maximization scale.At the frequency of 160 Hz,this trend is more obvious than at the frequency of 80 Hz.The ASYN controlled condition has a better effect in focusing the energy than the SYN condition,which suggests that the periodic regulating effect on the coherent structure with SYN and ASYN vibrations by the piezoelectric vibrators can perturb and modulate the motions of the large-scale coherent structure,leading to the drag reduction. To see this point more clearly,we plot the cloud map of the wavelet coefficients in Fig.10 under different working conditions at y+=14.Visually,the burst interval of the coherent structure under working conditions with no control is most likely to be random.It reflects the time evolution of different scale structures.The larger the scale is,the longer the structural characteristic time is.These quasi-periodic local events are the coherent structure evolution and the trace in the turbulent boundary layer. Fig. 9 (Color online) Energy cloud distribution of the multi-scale flow structures The corresponding scale of the span is irregular to some degree, with varying strength. But in the 160 Hz cases with asynchronous control, the vibration of the piezoelectric vibrators has an apparent modulation effect on the coherent structure burst,making a more even burst interval, a consistent scale of span and a more uniform strength. Fig. 10 (Color online) The cloud maps of wavelet coefficients To visualize the coherent structure in the physical space, we extract such information by using the extremum method of the wavelet coefficient modulus. The negative minimum wavelet coefficient of the stream-wise fluctuating velocity is used as the criterion for determining the ejection events, and vice versa. A conditional phase-averaged waveform of the coherent structures could be extracted[24-25]as follows: Figure 11 shows the conditional phase-averaged waveforms of the stream-wise fluctuating velocity of the coherent structure in the sweep event at the 8th scale under different conditions.The corresponding spatial scales of the reconstructed waveforms are approximately between 24 mm-36mm. Fig.11 (Color online)Conditional phase-averaged waveforms A significant increase of the fluctuation amplitude is evident under all controlled conditions.The conditional phase-averaged waveforms show the sinusoidal characteristics except those under the 16 0Hz-ASYN conditions. Obviously, the sinusoidal characteristics are disturbed under the two 160 Hz-ASYN conditions. The modulating effect of the periodic disturbance generated by the PZT vibrators on the coherent structure is enhanced significantly, thus accelerating the attenuation of the sweep event. The drag reduction is the largest under the 100 V/160 Hz-ASYN condition. The higher the driving voltage is, the more significant the effect will be. Under the 160 Hz-ASYN condition, the periodic modulating effect can be seen both at y+ = 21 and y+ = 30 . It can be seen that this effect diminishes with the upward movement of the normal position after y+ = 40 , and the waveform tends to be gentle. The periodic modulation on the coherent structure is obvious and the sweep event of the high-speed fluid becomes to have a shorter duration, as shown in Fig. 11(f). This indicates that the shear and the skin friction between the high-speed fluid and the wall are weakened. For the synchronous and asynchronousvibrations of the double piezoelectric vibrators,placed along the spanwise direction,their influences on the turbulent boundary layer are analyzed with the following results. (1)Higher voltage results in higher drag reduction rate under both SYN and ASYN conditions.The ASYN vibration has more significant effect than the SYN vibration.The drag reduction rate is the highest (18.54%)for the 100 V/160 Hz-ASYN.When the disturbance Reynolds number is 0.54 under the 100 V/160-Hz ASYN condition,the drag reduction rate isthe highest. (2)The vibration makes the turbulent kinetic energy more concentrated around the maximum value.There are two obvious maxima and a minimum in the turbulent kinetic energy curves for the 100 V/160 Hz-ASYN.When the vibrating frequency of the PZT vibrators(160 Hz)is close to the frequency corresponding to the peak,the disturbances generated by the PZT vibrators have the most significant effect. (3)The periodic regulating effect on the coherent structure with the SYN and ASYN vibrations of piezoelectric vibrators can perturb and modulate the motions of the large scale coherent structure and then lead to drag reduction. (4)The PDF curves are disturbed by the vibration and the modulating effect of the periodic disturbance generated by the PZT vibrators on the coherent structure can be seen under two 160 Hz-ASYN conditions. (5)The sinusoidal characteristics are disturbed and the modulating effect of the periodic disturbance is enhanced significantly.The periodic modulating effect is observed and the effect diminishes with the upward movement of the normal position under the two 160 Hz-ASYN conditions.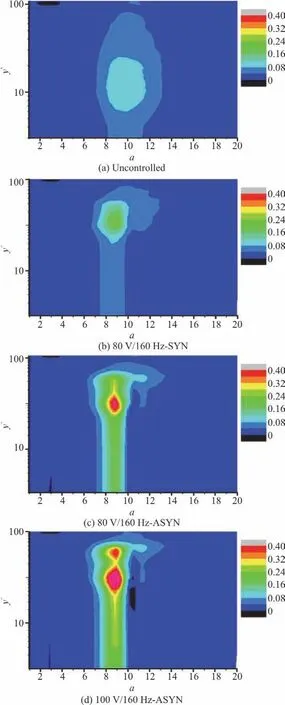

3.Conclusions
- 水動力學(xué)研究與進(jìn)展 B輯的其它文章
- Development and application of a new random walk model to simulate the transport of degradablepollutants*
- Some notes on numerical simulation of the turbulent cavitating flow with a dynamic cubic nonlinear sub-grid scalemodel in OpenFOAM*
- Predictions of bulk velocity for open channel flow through submerged vegetation*
- On solitary wave in nonuniform shear currents *
- Fission law of solitary waves propagating over sharply variable topography *
- A TensorFlow-based new high-performance computational framework for CFD *

