Multi-scale interaction between tearing modes and micro-turbulence in the HL-2A plasmas
Min JIANG (蔣敏), Yuhong XU (許宇鴻), Zhongbing SHI (石中兵),Wulyu ZHONG(鐘武律),Wei CHEN(陳偉),Rui KE(柯銳),Jiquan LI(李繼全),Xuantong DING (丁玄同), Jun CHENG (程鈞), Xiaoquan JI (季小全),Zengchen YANG (楊曾辰), Peiwan SHI (施培萬), Jie WEN (聞杰),Kairui FANG (方凱銳), Na WU (吳娜), Xiaoxue HE (何小雪),Anshu LIANG (梁桉樹), Yi LIU (劉儀), Qingwei YANG (楊青巍),Min XU (許敏) and HL-A Team
1 Southwestern Institute of Physics, Chengdu 610041, People’s Republic of China
2 Institute of Fusion Science, School of Physical Science and Technology, Southwest Jiaotong University,Chengdu 610031, People’s Republic of China
3 School of Physics, Dalian University of Technology, Dalian 116024, People’s Republic of China
Abstract The influence of m/n = 2/1(m and n are poloidal and toroidal mode numbers)tearing modes on plasma perpendicular flows and micro-fluctuations has been investigated in HL-2A neutral beam injection heated L-mode plasmas. It is found that the local perpendicular rotation velocity and turbulence energy are modulated by the alternation between the island X-point and O-point of the naturally rotating tearing modes. Cross-correlation analysis indicates that the modulation of density fluctuations by the tearing mode is not only limited to the island region,but also occurs in the edge region near the last closed flux surface. The turbulence exhibits distinct spectral characteristics inside and outside the island region. In addition, it is observed that the particle flux near the strike point is also significantly impacted by the tearing modes. The experimental evidence reveals that there are strong core-edge interactions between the core tearing modes and the edge transport.
Keywords: tearing modes, turbulence, particle flux, modulation, core-edge interaction
1. Introduction
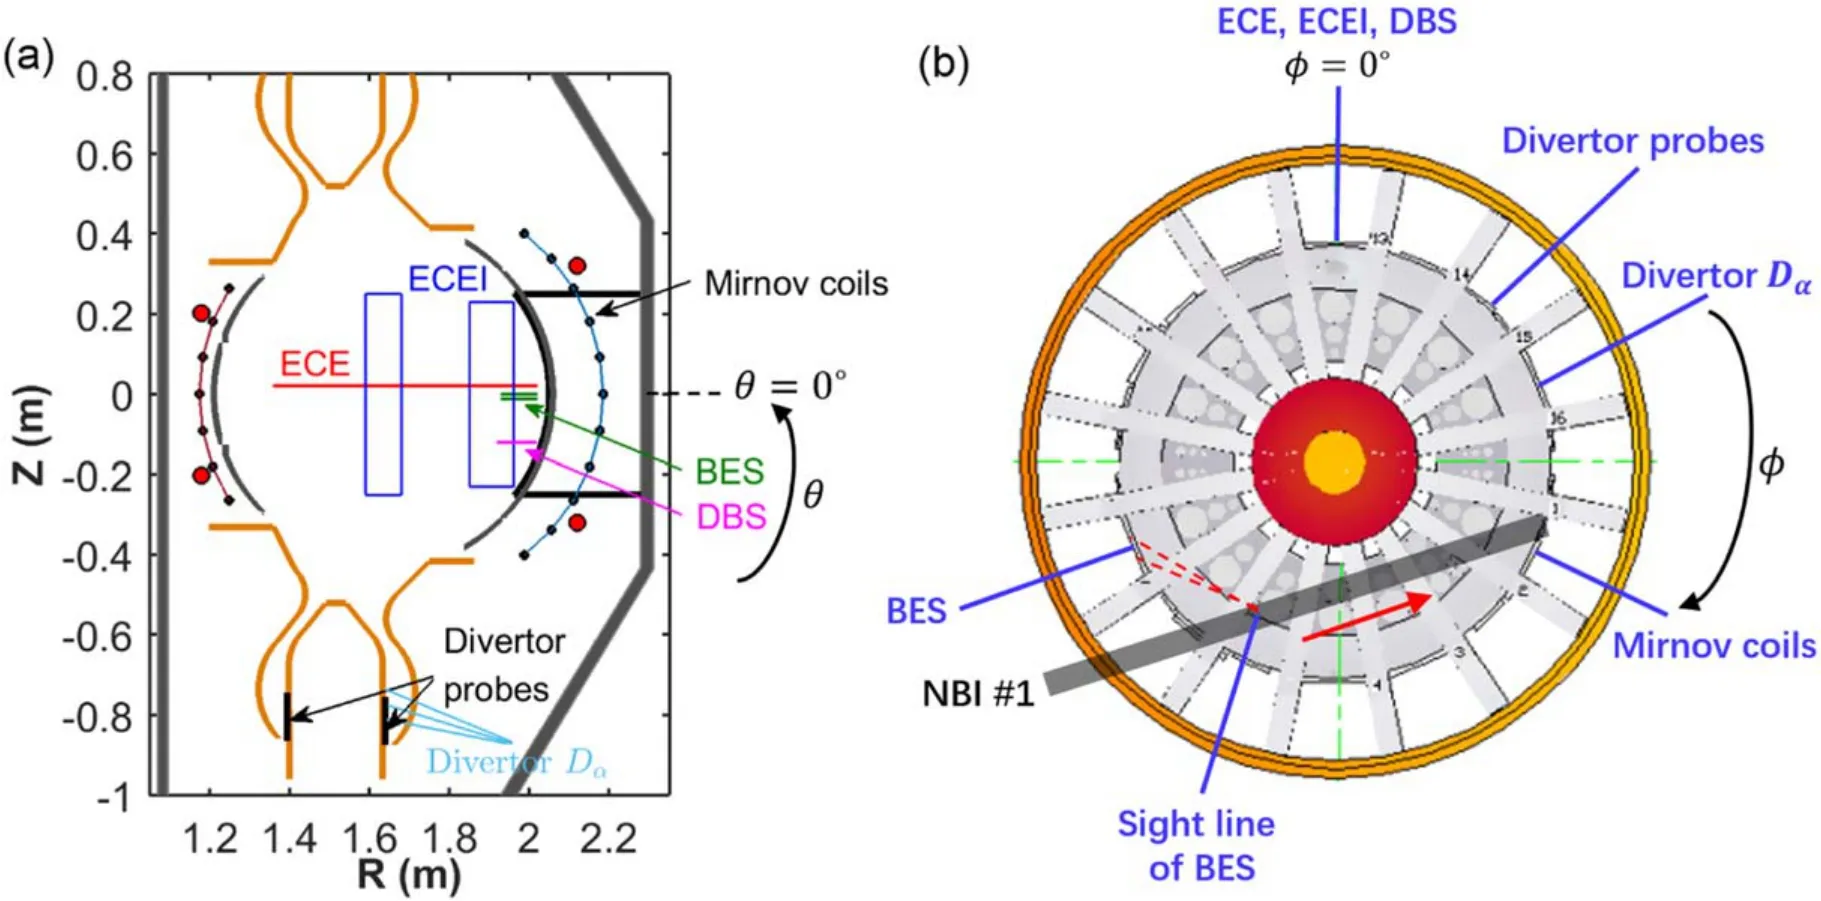
Figure 1.The layouts of the diagnostic systems used in this work:(a)in the poloidal cross section;(b)in the toroidal cross section(top view).The definitions of the positive poloidal (θ) and toroidal angles (φ), along with the reference phases, are illustrated in the figure.
Tearing modes, which form magnetic islands via the reconnection process, are ubiquitous in astrophysical and laboratory plasmas, such as the Earth’s magnetosphere and magnetically confined fusion plasma [1]. They are found to have a significant influence on plasma profiles and cross-field transport in tokamaks [2-7], and even lead to plasma disruption [8].However, experimental evidence suggests that the tearing mode contributes to rather than resists the formation of an internal transport barrier, due to the enhancedE×Bshear at the island boundary [4, 5, 9-11]and/or the accumulation of the heat flux at the island X-point [12].Experimental results on the DIII-D [13, 14], KSTAR [10],EAST [15], and HL-2A [16]tokamaks all verify that the turbulent fluctuations across the island region are significantly affected by the island topology structure both in the naturally rotating island and static island cases. A diffusive transport model [17]indicates an island-width threshold, only above which the magnetic island modifies the plasma profiles and turbulent transport, which has been corroborated by recent experimental observations [13, 16]. In addition, the turbulence can modify the bootstrap current, and thus stabilize or destabilize the tearing mode, depending on the direction of the gradient of the fluctuation intensity [18, 19]. Simulation results have also revealed that the turbulence modifies the threshold of magnetic island formation predicted by the conventional theory of spontaneous magnetic reconnection in a current sheet [20-22]. Therefore, detailed investigations on the interaction among multi-scale modes (tearing mode,plasma flows, and turbulence) are of paramount importance for thoroughly understanding tearing mode physics and island-induced transport, which will ultimately lead to developing a more effective method of tearing mode control and optimization of the plasma performance in fusion devices,such as ITER.
In this work, the effect of the 2/1 naturally rotating tearing mode on plasma perpendicular flow, micro-fluctuations, and particle flux was investigated in HL-2A neutral beam injection (NBI)-heated plasmas. The local plasma rotation velocity and turbulent fluctuations are modulated by the rotation frequency of the island, due to the alternation of the island O- and X-points. Cross-correlation analysis shows that the modulation of the density fluctuations by the island is not only limited to the island region, but also occurs in the edge region. In addition, it is observed that the core tearing mode can modulate the edge particle flux near the strike point.The rest of this paper is organized as follows: the experimental setup is introduced in section 2. The experimental results and a discussion are presented in section 3.Finally,in section 4, our conclusions are drawn.
2. Experimental setup
In this work, the experiments were conducted at the HL-2A tokamak, which is a medium-sized tokamak with a major radiusR0= 165 cm and minor radiusa= 40 cm.The plasma was NBI-heated under a lower-single-null divertor configuration.The layouts of the main diagnostics used in this study are shown in figure 1, viewed from the poloidal (figure 1(a))and toroidal cross sections (top view, figure 1(b)), respectively. There are 16 window ports in the toroidal direction,with a 22.5°separation between each port.The definitions of the positive poloidal (θ) and toroidal angles (φ) (marked by arc arrows),along with the reference phases,are illustrated in the figure. TheTeprofiles are measured by a 60-channel electron cyclotron emission (ECE) radiometer (located at φ = 0°) with temporal-spatial resolutions of 5 μs and 1 cm[23]. The evolution and mode structure of the magnetic island, as well as the micro temperature fluctuations () are detected using two-dimensional electron cyclotron emission imaging (ECEI) diagnostics (located at φ = 0°) with a horizontal coverage of 20 cm and a vertical coverage of 52 cm in the plasma[24].The temporal and spatial resolutions are 2 μs and 1.2-2.3 cm, respectively. The perpendicular rotation velocity (V⊥) and density fluctuationswith characteristic perpendicular wavenumber (k⊥) are measured by a novel U-band microwave Doppler backscattering (DBS) reflectometer system operated in the X-mode polarization [25].It is installed at the φ = 0° port 12 cm below the midplane, as shown in figure 1. The long wavelength turbulentwithkθρs<0.8is also measured via beam emission spectroscopy(BES) by detecting the light emission from the neutral beam[26].It has been configured in a 12(radial)×2(poloidal)array near the midplane, covering the radial region ofR≈193-202 cm. The line of sight of the BES is located at φ = 202.5°.It has a high spatial resolution,e.g.,Δr≈ 0.8 cm and Δz≈ 1.2 cm. The edge particle flux is measured by the probes installed on the inner and outer divertor target plate at φ = 45°, where 11 detectors are aligned vertically, as illustrated in figure 1. The magnetic fluctuations of the tearing mode are detected by Mirnov coils, with 18 coils poloidally and 10 coils toroidally arranged around the device wall. The poloidal (m) and toroidal mode numbers (n) of the tearing mode can be deduced from the Mirnov signals,which turn out to bem= 2 andn= 1.
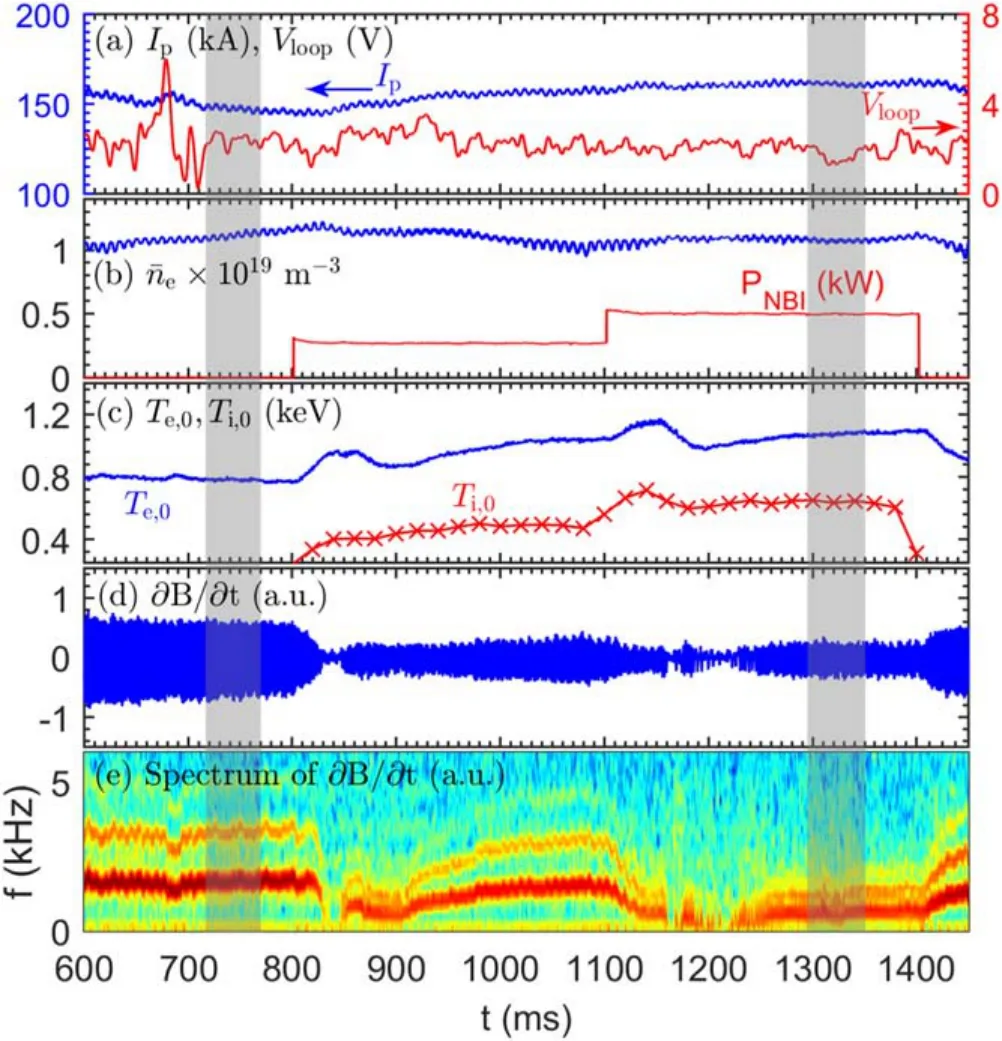
Figure 2. Time evolutions of the discharge parameters of shot 36 656, with (a) the plasma current Ip and the loop voltage Vloop,(b)the line-averaged electron density and NBI power PNBI,(c)the core electron temperature Te,0 and ion temperature Ti,0, (d) the magnetic perturbation?B ?t and (e) the spectrum of? B ?t.
3. Results and discussion
Figure 2 displays the discharge parameters of the HL-2A shot 36 656, with the plasma currentIp≈160 kA and the lineaveraged plasma density≈ 1 .1 × 1 019m?3, as shown in figures 2(a) and (b). The NBI power is ramped up in two steps, 250 and 500 kW. With each increment of NBI power, the core electron (Te,0) and ion temperature (Ti,0) are elevated by 20% and 50%, respectively (see figure 2(c)).Here, it is interesting to find thatTe,0>Ti,0. This might result from the ohmic heating playing a significant role(POH=Ip×Vloop≈300- 320 kW, see figure 2(a)), and also the NBI power mainly heating the electrons in a relatively lowTecondition. As shown in figures 2(d) and (e), both the magnitude and frequency of the magnetic fluctuations(induced by the tearing mode)decrease dramatically with the increase of the NBI power.Figure 3 compares the evolutions of the mode structure of the tearing modes withPNBI= 0 and 500 kW. The result shows that the magnetic island center locates atR≈ 193 cm (q= 2 surface), and it rotates in the electron diamagnetic drift (counter-clockwise) direction both before and during NBI heating. Before the NBI is switched on, the island width is about 8 cm, and it drops to 5 cm with 500 kW of NBI heating power.
Shown in figure 4 are the temporal evolutions of the perpendicular flow and micro-fluctuations (located near theq= 2 surface, poloidally across the island X- and O-points)with the rotation of the 2/1 island,where(a)is theTesignal atR= 191 cm inside theq= 2 surface measured by ECE, (b)and (c) the perpendicular flowV⊥and the envelope of(k⊥ρs≈2.4,located atR≈192.5 cm)in the frequency range of 50-300 kHz measured by DBS, (d) the envelope of(k θρs<0.8,located atR≈193 cm)in the frequency range of 10-75 kHz measured by BES, and (e) the envelope of the(located atR≈ 193 cm andZ≈ 1.1 cm) in the frequency range of 5-100 kHz measured by ECEI. Different frequency ranges are chosen for each diagnostic according to the main spectral power of the fluctuations.As shown in figure 1,these diagnostics detect signals at different locations, so there must be a phase lag (Δξ) between the time evolutions of theV⊥measured by DBS andby BES and those ofTemeasured by ECE, i.e.,Δξ=mΔθ?nΔφ, where Δθ and Δφ are the separations of poloidal and toroidal angles between the DBS (BES) and ECE, respectively. Due to the island rotation with a frequency offTM≈0.6 kHz, this offset translates to an effective time lag (Δτ) between theV⊥()andTesignals, i.e., Δτ= Δξ(2πfTM). Given the detecting locations the helical phase differences areΔξ∣DBS≈ ? 60°and Δξ∣BES≈ 160°, so the time lags are Δτ∣DBS≈?0.278 ms andΔτ∣BES≈ 0.741 ms relative to theTemeasurement.The time sequences shown in figures 4(b)-(d)have already been shifted byΔτ∣DBSandΔτ∣BES,respectively,and hence, they are in sync (synchronization) with theTeandmeasurements. The envelope ofwithin a given frequency range Δf= [f1,f2],ψ(t), is defined asψ(t)=where(f)is the Fourier transform of(t). The envelope of is calculated in a similarway. The envelope signals shown in figures 4(d) and (e) are band-pass filtered within 0.4-1 kHz. The peaks of theTesignal inside theq= 2 surface(see figure 4(a))correspond to the island X-point passing-by times, and the relatively flat phases correspond to the O-point, which are marked by the vertical dashed lines. The results show that both the local perpendicular velocity and turbulent fluctuations are modulated by the rotation of the island. At the island O-point, theV⊥is about 2-3 times smaller than that at the X-point, suggesting that the island geometry damps the perpendicular flow. For the fluctuations, the turbulence energy is the minimum at the O-point and the maximum at the X-point, in agreement with the change in the trend of the temperature gradient at the O-and X-point regions.This indicates that the pressure gradient driven effect plays a more dominant role in the dynamic of the turbulence at the island region than the flow shear suppression effect,even if theE×Bshear is also stronger at the X-point than the O-point, consistent with previous observations [10, 13, 16, 27, 28].
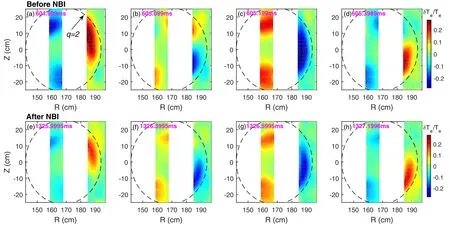
Figure 3.Two-dimensional images of tearing modes,(a)-(d)before NBI heating and(e)-(h)during 500 kW NBI heating.The dashed circles denote the q = 2 surface (#36656).
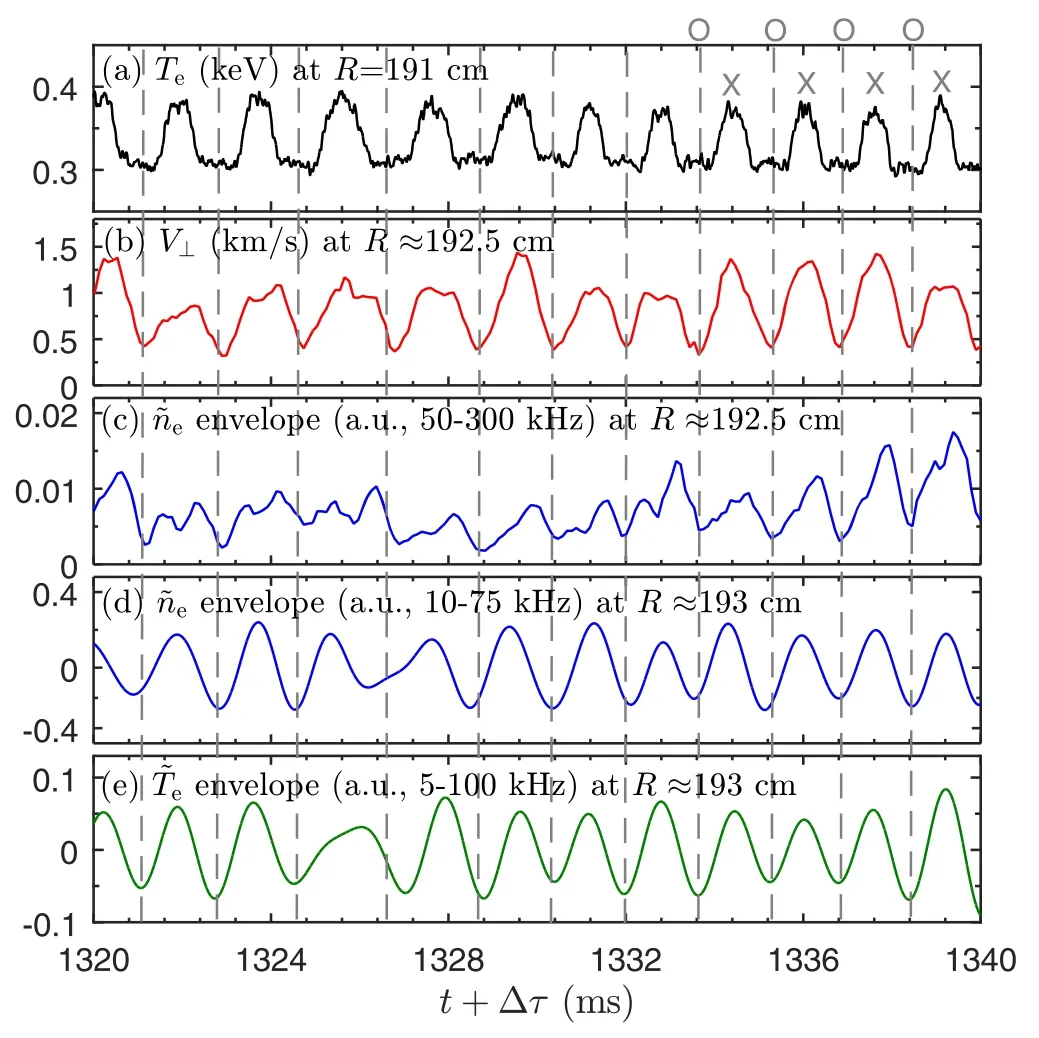
Figure 4.Influence of the island rotation on plasma flows and microfluctuations. (a) Electron temperature at R = 191 cm measured by ECE, (b) and (c) the perpendicular velocity and the envelope of density fluctuations (R ≈192.5 cm) in the frequency range of 50-300 kHz measured by DBS, (d) the envelope of density fluctuations (R ≈193 cm) in the frequency range of 10-75 kHz measured by BES, and (e) the envelope of the temperature fluctuations(R ≈ 193 cm and Z ≈ 1.1 cm)in the frequency range of 5-100 kHz measured by ECEI.As the helical phase lags between the DBS (BES) and ECE measurements, the x-axis of the figure is shifted tot+ Δτin order to keep the signals in sync, with Δ τ ( a) = Δ τ ( e) =0, Δ τ ( b ) = Δ τ (c ) ≈ ?0.278 ms and Δτ(d) ≈ 0.741 ms.The island O-point passing-by times are marked by the vertical dashed lines (#36656).
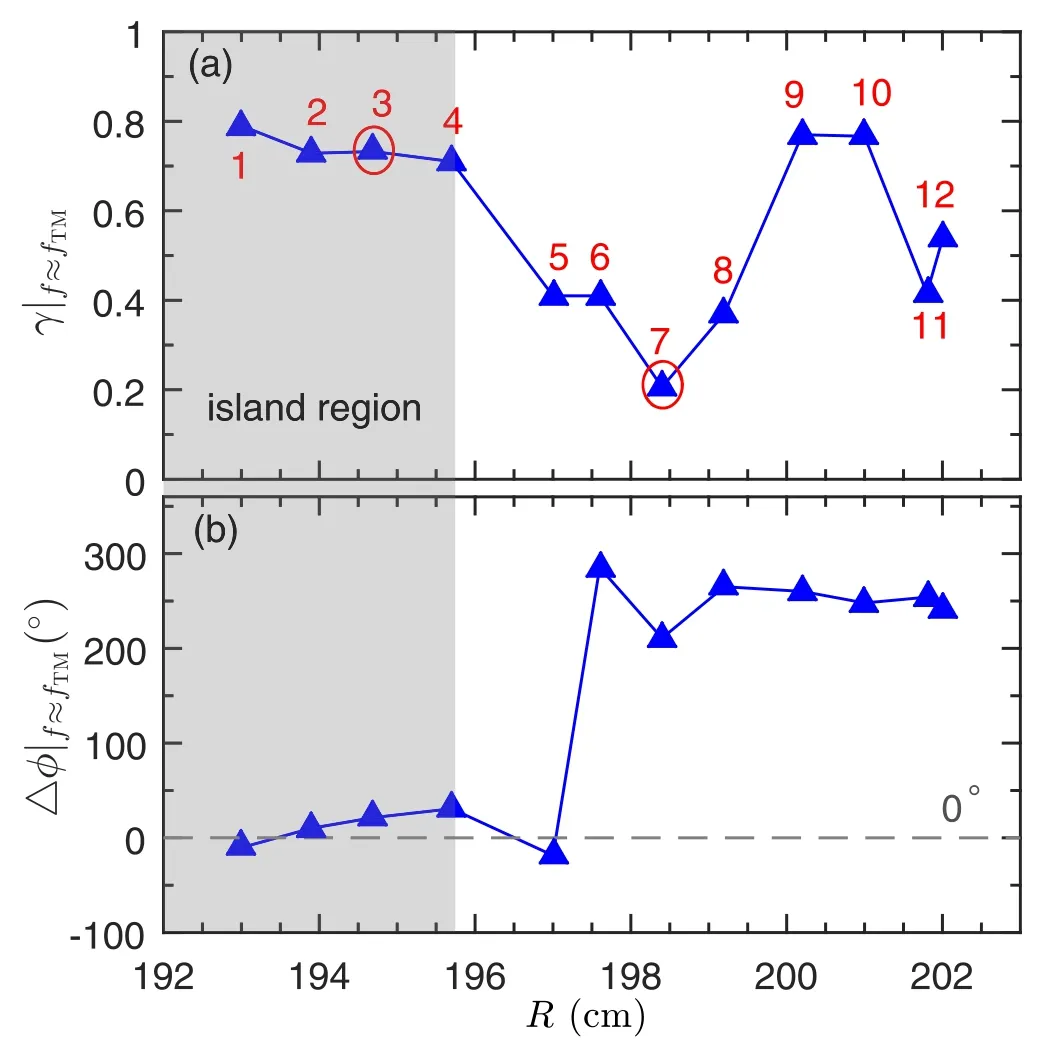
Figure 5.Cross-correlation between the reference signal Te(Rref = 190 cm, t) located inside the q = 2 surface and the envelope signals ψ ( R ,t )at different radial regions.The coherence coefficient γ∣ f ≈fTM and cross-phaseΔφ∣f ≈fTM at the tearing mode frequency are shown in(a)and(b),respectively.The island region is shaded in the figure (#36656).
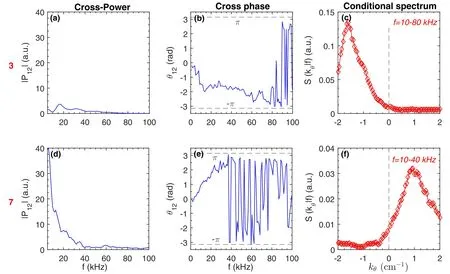
Figure 6.Two-point poloidal correlation of the ne (by BES)at different radial regions(illustrated by the circles in figure 5(a)),with the two signals poloidally spaced by 1.2 cm.Location 3 is inside the island,poloidally across the O-point and X-point periodically,and location 7 is outside the island toward the plasma edge. Plotted in (a) and (d) are the cross spectral power∣ P1 2∣. (b) and (e) are the cross-phase θ12.(c) and (f) are the conditional spectrum S ( k θ∣f) in the frequency ranges of 10-80 and 10-40 kHz, respectively, in order to exclude the low frequency tearing mode and its harmonics (#36656).
Radially resolved BES measurements allow us to investigate the modulation area of the turbulent fluctuations by the island. Figure 5 shows the cross-correlation between the referenceTe(Rref=190 cm,t) signal located inside theq= 2 surface (the minimum (maximum) amplitude corresponding to the island O-point (X-point) phase) and the envelopes of thesignals at different radial positionsψ(R,t), with (a) and (b) denoting the coherence coefficientγ∣f≈fTMand cross-phaseΔφ∣f≈fTMat the tearing mode frequency,respectively.As illustrated in figure 1(b),the toroidal separation between the BES and ECE is about ?160°, and therefore, the cross-phase shown in figure 5(b) has been shifted by the same value to keep the BES measurements in sync with the ECE measurements. As shown in figure 5(a),there are two regions with high coherence:one is at the island region (locations 1?4), and the other is at the edge region close to the last closed flux surface (locations 9 and 10),revealing that the modulation of the turbulence is not only confined to the island region, but also in the far edge region,which is different from the previous observations in DIII-D where the modulation is localized at the island region[13, 27]. Within the island region, the cross-phase is close to zero (see figure 5(b)), indicating that theenvelopes are in phase with the helical perturbation inTe(Rref,t), i.e., thelevel is the minimum at the island O-point and the maximum at X-point, in agreement with previous results in other tokamaks[10, 13, 28]. Modulation on the edge turbulence by the core islands has not been reported before, which somehow implies some kind of core-edge interaction.
The turbulence properties inside the island and outside the island are further surveyed for a naturally rotating island.Figure 6 shows the cross-correlation of twonesignals which are poloidally spaced by 1.2 cm,with location 3 inside the island (poloidally across the island O- and X-points periodically) and location 7 outside the island toward the plasma edge, as illustrated by the circles in figure 5(a).Plotted in figures 6(a) and (d) are the cross-powerand figures 6(b) and (e) are the cross-phaseθ12(f) =Shown in figures 6(c)and (f) are the conditional spectrumS(k θ∣f)(defined asS(kθ∣f) =S(kθ,f)S(f)whereS(f) = ∑kθS(kθ,f)andS(kθ,f)is the local wavenumber frequency spectrum calculated using the two-point correlation technique [29]) for the frequency ranges of 10-80 kHz and 10-40 kHz,respectively,in order to exclude the low frequency tearing mode and its harmonics. As shown in figures 6(a) and (d), the turbulence intensity inside the island, which is the average over the island rotation, is several times smaller than that outside the island,consistent with the observations in the DIII-D[13,27]and KSTAR [10]tokamaks. Moreover, the turbulence spectrum inside the island appears in a wider frequency band(f< 80 kHz, figure 6(a)) than that outside the island region(f< 40 kHz, figure 6(d)). It is interesting to find that the spectral power inside the island region decreases non-monotonically with the increase of the frequency,e.g.,a drop atf≈10 kHz, leading to a discontinuity in the cross-phase at about 10 kHz, see figures 6(a) and (b). Inside the island region, the cross-phase (figure 6(b)) and the conditional spectrum(figure 6(c)) show that the high frequency turbulence propagates in the electron diamagnetic drift direction in the laboratory frame, with the spectrum having a peak atkθ≈?1.65 cm?1. Outside the island region, the cross-phase(figure 6(e)) and the conditional spectrum (figure 6(f)) indicate that the turbulent fluctuations propagate in the ion diamagnetic drift direction in the laboratory frame, with the spectra peaking atkθ≈ 1 cm?1.The reason for the reversal of the propagation directions inside and outside the island is not clear yet, but could be related to different turbulence properties in these two regions, such as trapped electron modes and ion temperature gradient modes. The propagation direction was found to reverse across the island region in the static island case in KSTAR [10].

Figure 7. (a) Temporal evolutions of Te at R = 191 cm (inside but close to the q = 2 surface), (b) a spectrogram of the ion saturation current Jsat at the divertor target plate (close to the strike point),(c) the integrated spectral power of Jsat in the frequency range of 0-15 kHz, and (d) the line emission intensity of the Dα at the divertor target plate. Taking into account the helical phase lags between the different diagnostics,the x-axis of the figure is shifted to t + Δτ, with Δτ(a) = 0, Δτ(b) = Δτ(c) ≈ 0.625 ms, and Δτ(d) ≈ 0.521 ms (#36656).
In this work,it is also found that the tearing mode in the core region has an impact on the edge particle flux.Shown in figure 7(a) is the temporal evolution ofTeatR= 191 cm(inside theq= 2 surface), which depicts the rotation of the island, and the island X- and O-point phases have been marked in the figure. Figures 7(b) and (c) are the spectrum and the integrated spectral power within 0-15 kHz of the ion saturation current(Jsat)signal at the divertor target plate close to the strike point.Plotted in figure 7(d)is the Dαintensity at the divertor target. As illustrated in figure 1, the divertor probes, divertor Dαarray, and ECE radiometer locate at different poloidal and toroidal angles, which leads to helical phase lags (Δξ∣probe=135°,Δξ∣Dα= 1 12.5°), and hence time lags(Δτ∣probe= Δξ∣probe(2πfTM) ≈0.625 ms ,Δτ∣Dα=Δξ∣Dα(2πfTM) ≈0.521 ms ) between theJsat, Dαintensity andTesignals.To make theJsatand Dαevolutions in sync with theTe,the time sequences shown in figures 7(b)-(d)have been shifted byΔτ∣ probe andΔτ∣Dα, respectively. TheJsatmeasurements shown in figures 7(b)and(c)reveal that the 2/1 tearing mode modulates the particle flux at the strike point, and can influence the particle transport nonlocally, which is further verified by the evolutions of the Dαintensity signal (see figure 7(d)).At the instant of the island X-point passing by,the particle flux enhances substantially, while for the island O-point passing-by phases, it is quite small. We also checked other channels ofJsatsignals at the target plate but far away from the strike point, and found that there was no modulation effect. This core-edge interaction is also consistent with the BES measurements (see figure 5(a)), however, its physical mechanism is still a mystery and will be our future focal topic.
4. Conclusions
In this work, the influence of the naturally rotatingm/n=2/1 macro-scale tearing mode on the meso-scale plasma flows and the micro-scale turbulent fluctuations is investigated. It is observed that the tearing mode modulates the plasma perpendicular flow, density, and temperature turbulence at the island region, with the minimum values at island O-point and the maximum values at the X-point. The crosscorrelation analysis indicates that the modulation of the turbulence is not only confined to the island region, but also occurs on the plasma edge region close to last closed flux surface. The turbulence inside the island area has quite different spectrum compared with that of the outside island region,and propagates in opposite directions in the laboratory frame. In addition, it is found that the 2/1 tearing mode modulates the edge particle flux near the strike point, suggesting a significant core-edge interaction between the core MHD mode and the edge transport.
Acknowledgments
The author M Jiang would like to sincerely thank the HL-2A team for their support of the experiments.This work is partly supported by the National Key R&D Program of China(Nos. 2017YFE0301201 and 2017YFE0301106), partly by National Natural Science Foundation of China (Nos.11705051, 11820101004, 11875021 and 11775069), and partly by the Young Elite Scientists Sponsorship Program by CAST (No. 2018QNRC001).
 Plasma Science and Technology2020年8期
- Plasma Science and Technology的其它文章
- Design and control of the accelerator grid power supply-conversion system applied to CFETR N-NBI prototype
- Identification of heavy metal-contaminated Tegillarca granosa using laser-induced breakdown spectroscopy and linear regression for classification
- Automated electron temperature fitting of Langmuir probe I-V trace in plasmas with multiple Maxwellian EEDFs
- The influence of defects in a plasma photonic crystal on the characteristics of microwave transmittance
- Measurement of tungsten impurity spectra with a two-crystal X-ray crystal spectrometer on EAST
