
Flow Characteristics of Crude Oil with High Water Fraction during Non-heating Gathering and Transportation
2021-04-24 15:49:04YulingTanHaoLiJiaoYangDonghaiXuPeiyang
中國煉油與石油化工 2021年1期
Lü Yuling; Tan Hao; Li Jiao; Yang Donghai; Xu Peiyang
(1. Shandong Key Laboratory of Oil & Gas Storage and Transportation Safety,China University of Petroleum (East China), Qingdao 266580;2.China Resources (Zhengzhou) Municipal Engineering Design & Research Institute Co., Ltd.)
Abstract: In order to ensure the safety of the non-heating gathering and transportation processes for high water fraction crude oil, the effect of temperature, water fraction, and flow rate on the flow characteristics of crude oil with high water fraction was studied in a flow experimental system of the X Oilfield. Four distinct flow patterns were identified by the photographic and local sampling techniques. Especially, three new flow patterns were found to occur below the pour point of crude oil, including EW/O&W stratified flow with gel deposition, EW/O&W intermittent flow with gel deposition,and water single-phase flow with gel deposition. Moreover, two characteristic temperatures, at which the change rate of pressure drop had changed obviously, were found during the change of pressure drop. The characteristic temperature of the first congestion of gel deposition in the pipeline was determined to be the safe temperature for the non-heating gathering and transportation of high water cut crude oil, while the pressure drop reached the peak at this temperature. An empirical formula for the safe temperature was established for oil-water flow with high water fraction/low fluid production rate. The results can serve as a guide for the safe operation of the non-heating gathering and transportation of crude oil in high water fraction oilfields.
Key words: crude oil with high water fraction; non-heating gathering and transportation; flow pattern; pressure drop; safe temperature
1 Introduction
At present, the water fraction in crude oil has exceeded 85%[1]in many oilfields during the high water fraction period. The high water fraction can lead to high energy consumption of the oil gathering and transportation system. The main measure to reduce energy consumption is the adoption of non-heating gathering and transportation processes. The safe operation of such processes, which is the focus of the current study, is closely related to the flow patterns, pressure drop, and gel deposition of oilwater two-phase flow.
A large number of investigations have been carried out on the hydrodynamics of oil-water two-phase flow, in particular on flow patterns[2-7], and the pressure drop[8-10].Previous studies[4-5,11-13]investigated the flow patterns of oil-water two-phase flow for a water fraction of > 80% in laboratory loops, and it was found that the flow patterns observed in horizontal pipelines were of the stratified (ST,ST&MI), mixed (DO/W&W), and dispersed (DO/W)types.
The gel deposition of crude oil has a significant effect on the flow patterns and pressure drop of oil-water twophase flow. In the course of gathering, transportation,and storage of extracted crude oil, waxy crude oils exhibit gelling behaviors such as crystallization, crosslinking, and deposition, wherein a certain amount of wax is precipitated under cooling or in low-temperature environments[14-16]. It has been shown that crude oil with high water fraction can maintain liquidity at near or even below its pour point[17]. However, as the transportation temperature decreases, the gelled crude oil tends to deposit on the pipe wall after a certain amount of accumulation, in a phenomenon known as ‘wall sticking’.Based on the field test, Wang, et al.[18]found that wall sticking mainly occurred at the beginning of pipelines,mianfolds, valves and elbows. Wall sticking of gelled oil is a serious problem, as it causes a reduction in the effective pipe cross-sectional area, which can lead to rapid increase in pressure drop[19-20].
Some researchers have defined the temperature at which gelled crude oil deposits on the pipe wall as the wall sticking occurrence temperature (WSOT)[21].When the transportation temperature is lower than the WSOT, the wall sticking of crude oil can cause rapid deterioration of flow conditions, thereby hindering the gathering and transportation processes. Zheng and Tian,et al.[21-22]defined and measured the WSOT of waxy crude oil with high water fraction by laboratory loop experiments. Although laboratory experimentation is a very comprehensive method for determining the flow characteristics and safe temperature for the non-heating gathering and transportation, the oil-water flow patterns were mostly DO/W in experimental loops, which is very different from the flow patterns that occur in actual gathering pipelines in oilfields.
In order to solve the above problems, the effect of temperature, water fraction, and flow rate on the flow characteristics of crude oil with high water fraction is studied in an X Oilfield both experimentally and theoretically in this study. The safe temperature for the non-heating gathering and transportation is measured and an empirical formula for determining the safe temperature is established. It can guide the safe operation of nonheating gathering and transportation process.
2 Experimental
2.1 Experimental setup
In order to study the flow characteristics and safe temperatures for non-heating gathering and transportation of oil-water two-phase flow with high water fraction,an experimental pipeline system was designed based on the gathering pipelines of oil wells in the X Oilfield, as shown in Figure 1. In this experimental system, the outer and inner diameter of the oil gathering pipelines was 0.060 m and 0.052 m, respectively. In order to observe the flow patterns of crude oil with high water fraction in the non-heating gathering and transportation process,an experimental section with an optically transparent window was connected to the oil gathering pipeline of the test well. The visible window was a transparent glass pipe, 0.5 m in length and 0.052 m in inner diameter,respectively, and the pipe was operated under a pressure of 2.0 MPa, as shown in Figure 2. Apart from the buried pipelines and the visible window, the other pipelines in the experimental system were wrapped with insulation to prevent heat loss. Thermometers and pressure gauges were installed at the wellhead, entrances of manifolds,the visible experimental section and at the inlet and outlet of the three-phase separator. A high-speed camera was placed in front of the visible window to photograph the flow patterns of oil-water two-phase flow.
2.2 Experimental materials
Five high water-cut oil wells were selected for flow experiments in a certain block of the X Oilfield. The water fraction (φ) and fluid production rates (QL) of the five test wells and the wax contents (ωw), pour points (TP),and wax appearance temperatures (WAT) of dehydrated crude oil are given in Table 1. The five test wells are high water-cut oil wells with low gas-oil ratio, and according to the previous experimental experience, the gas phase has little effect on the flow state of oil-water two phase at this low gas-oil ratio. Therefore, the research category of this experiment can be regarded as an oil-water two-phase flow system.

Table 1 Basic parameters of five test wells and dehydrated crude oil
The viscosity-temperature curves of the dehydrated crude oil from five test wells were measured, as shown in Figure 3. In order to make the test result closer to the actual flow state, two shear rates were selected for the test: 9 s-1and 16.2 s-1. Due to limitations on the production conditions of the test wells, the experimental temperatures, water fractions, and fluid production rates were in the range of 26.0—36.0 °C, 80.0%—98.0%, and 5.0—15.0 t/d,respectively.
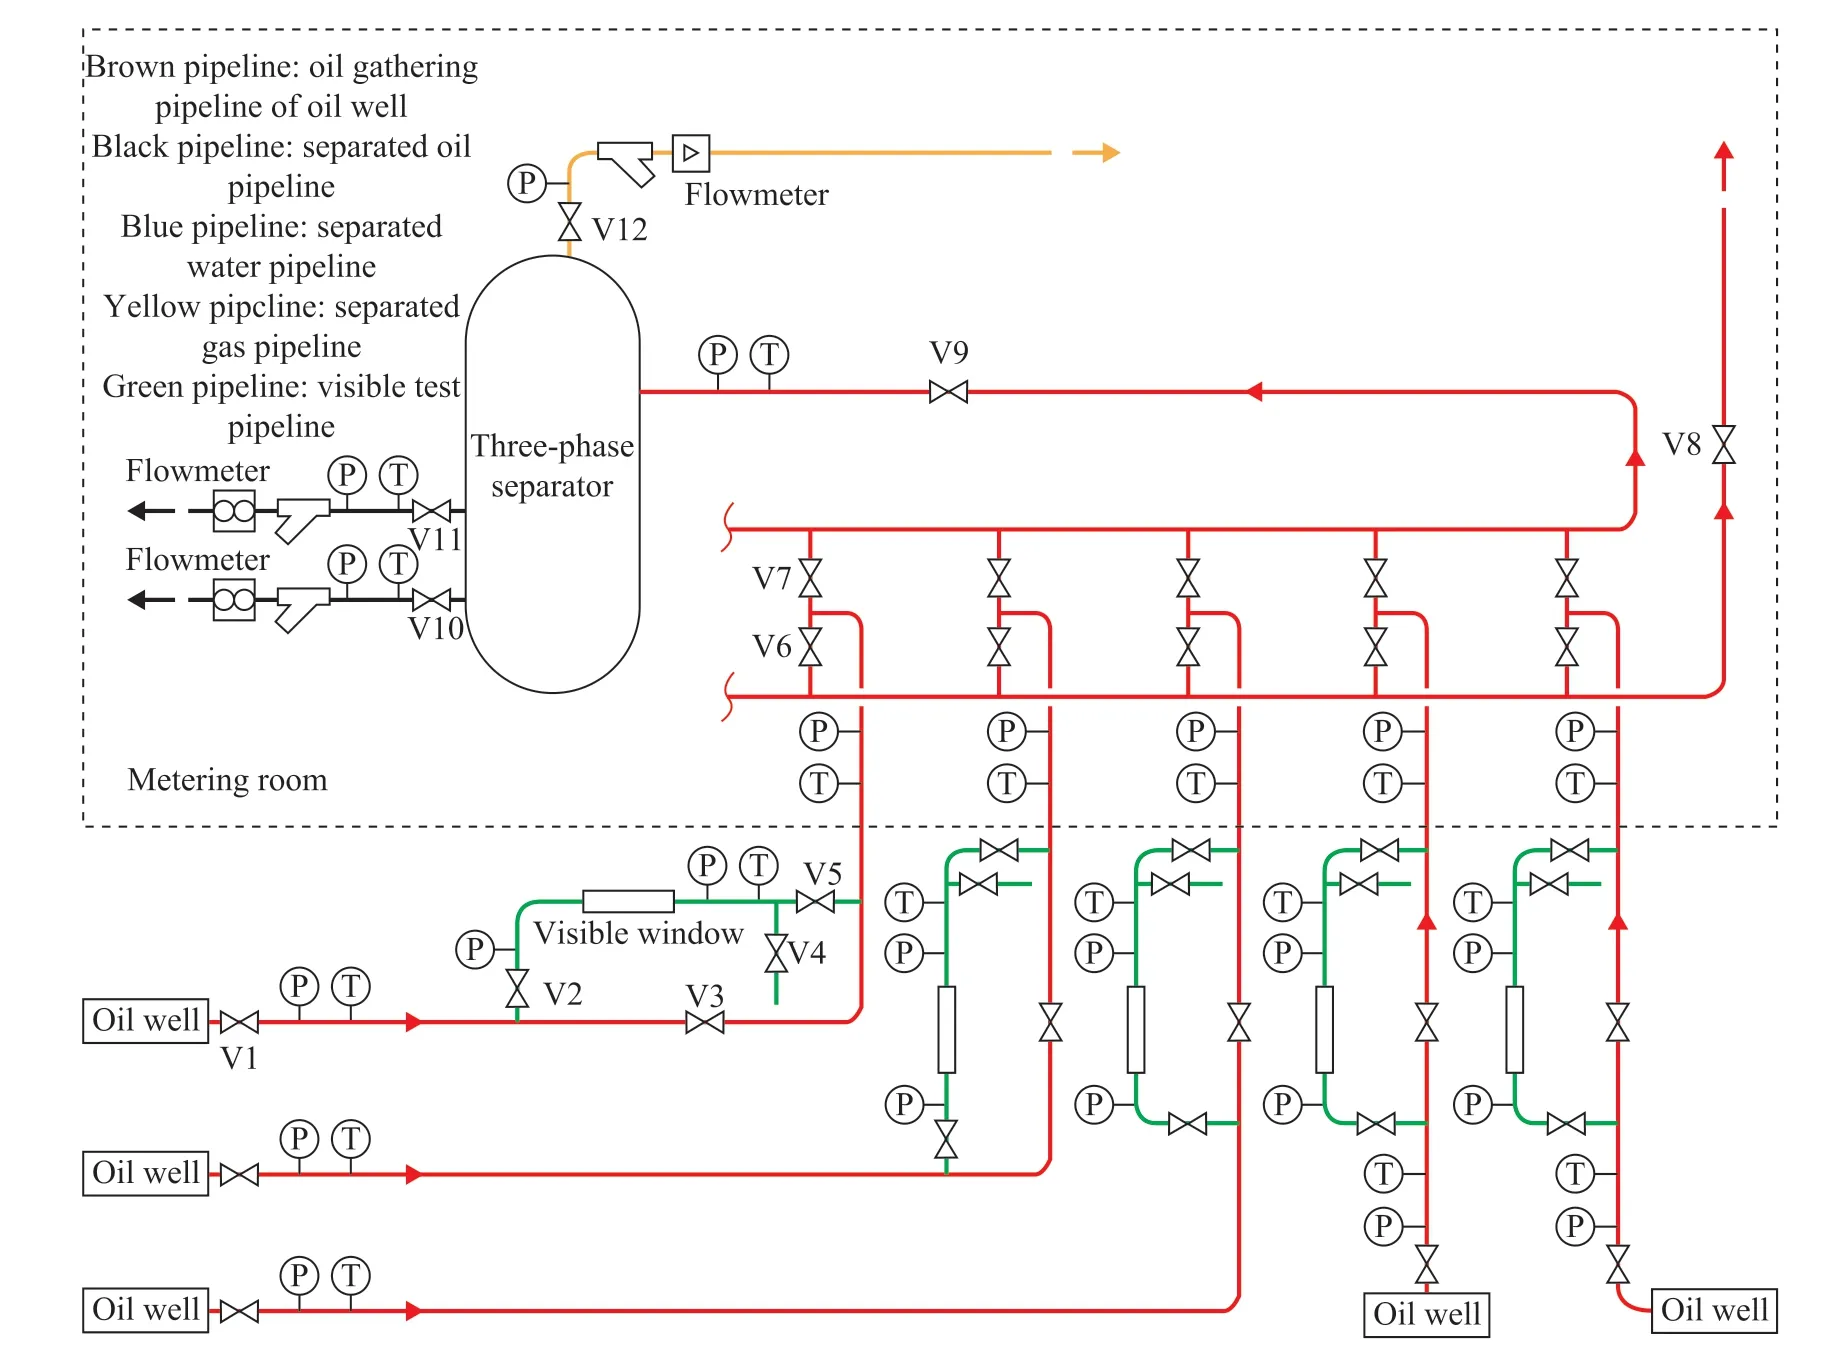
Figure 1 Schematic diagram of the experimental pipeline system
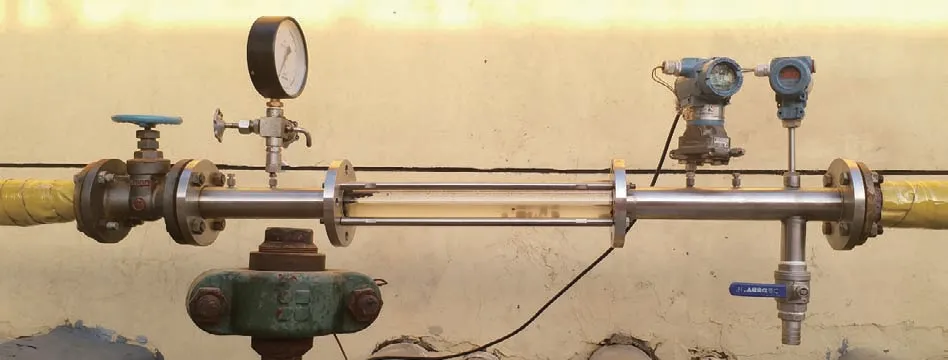
Figure 2 Material object of the visible window
2.3 Experimental procedures
Two types of flow experiments were conducted in this study, viz.: invisible flow experiments and visible flow experiments.
In the invisible flow experiment, the heat tracing system of the test well was closed. The gate valves V1, V3,V7, V9, V10, V11, and V12 were opened, and the gate valves V2 and V5 remained closed. The pressures and temperatures of the measuring points were recorded at the set intervals. Once the pressures and temperatures of the measured points reached the safety limits of the oilfield(meaning that the experimental temperature was at its lowest allowable value), the experiment was stopped and the heat tracing system was reopened.
In the visible flow experiment, the gate valves V2 and V5 were opened, and the valves V1, V3, V7, V9, V10, V11,and V12 remained open. Simultaneously, the heat tracing system of the test well was closed. The pressures and temperatures of the measured points were then recorded at the set intervals after the oil-water flow was stabilized,and the flow patterns were observed and photographed.The experiment was stopped upon reaching the safe operating limits of the oilfield. The heat tracing system was then opened, and the valves V3, V2, and V5 were closed.
3 Results and Discussion
3.1 Flow patterns
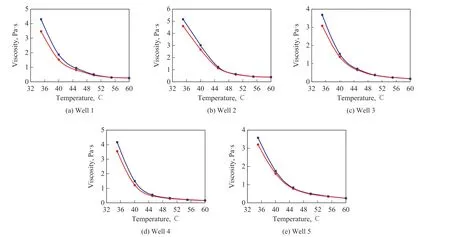
Figure 3 curves of experimental materials
The oil-water two-phase flow with high water fraction can be classified into four different flow patterns before the first congestion, with schematic drawings of the cross-sectional views and photographs of the fluids for each pattern shown in Figures 4—7 (brown medium is crude oil; dark brown medium is gelled crude oil without fluidity; blue medium is water in the photographs). Three new flow patterns, including EW/O&W stratified flow with gel deposition, EW/O&W intermittent flow with gel deposition, and water single-phase flow with gel deposition, were found to occur below the pour point.It is shown that when the experimental temperature was higher than the pour point, the oil-water two-phase flow pattern was EW/O&W stratified flow without gel deposition. When the experimental temperature was much lower than the pour point, EW/O&W stratified flow with gel deposition, EW/O&W intermittent flow with gel deposition, and water single-phase flow with gel deposition gradually appeared due to the gel deposition behavior of the crude oil. According to the types of fluids and the gel deposition in the pipeline, the four flow patterns can be classified into the oil-water two-phase flow without gel deposition, the oil-water two-phase flow with gel deposition, and the water single-phase flow with gel deposition.
1) Oil-water two-phase flow without gel deposition
Oil-water two-phase flow without gel deposition is an EW/O&W stratified flow under low liquid production rates. There is no gel deposition in the experimental pipeline. Water-in-oil emulsion is at the upper part of the pipeline, while the free water flows at the lower part(Figure 4).2) Oil-water two-phase flow with gel deposition(1) EW/O&W stratified flow with gel deposition
There is a thin gel layer on the upper part of pipeline wall.The EW/O&W stratified flow exists below the gel layer(Figure 5).
(2) EW/O&W intermittent flow with gel deposition
There is a thick layer of gel deposition on the upper part of pipeline wall; the water-in-oil emulsion occupies most of the lower part of the pipeline, while ‘water plug’ appears at the bottom of the pipeline intermittently(Figure 6).
3) Water single-phase flow with gel deposition
The gelled crude oil deposits and occupies most part of the pipeline, and free water flows only at the bottom of the pipeline (Figure 7).
It was found that the experimental temperature was the main controlling factor for the flow patterns observed at high water fraction and low flow rate conditions.When the experimental temperature was high, gel deposition did not occur and only a single flow pattern type was observed. Under the action of gravity, free water converged and occupied the bottom of the pipeline,forming an EW/O&W stratified flow without gel deposition.
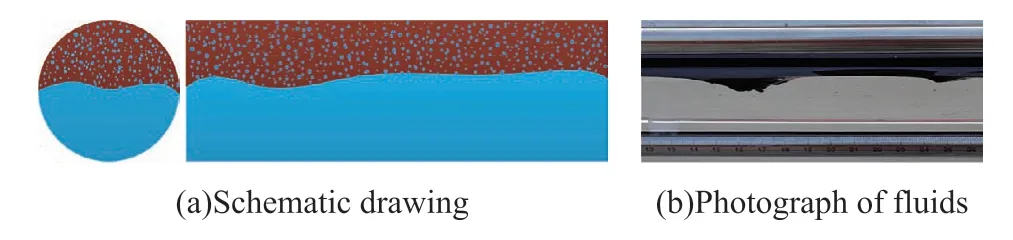
Figure 4 EW/O&W stratified flow without gel deposition
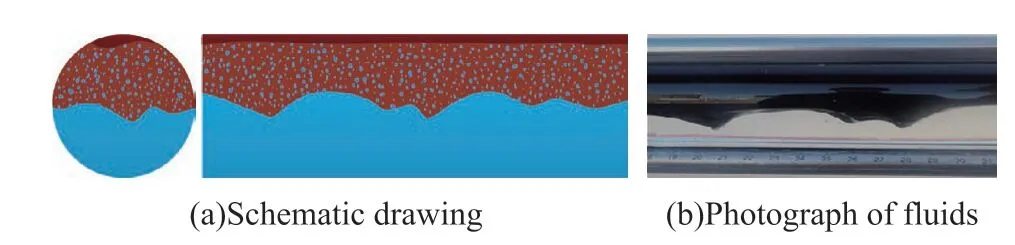
Figure 5 EW/O&W stratified flow with gel deposition
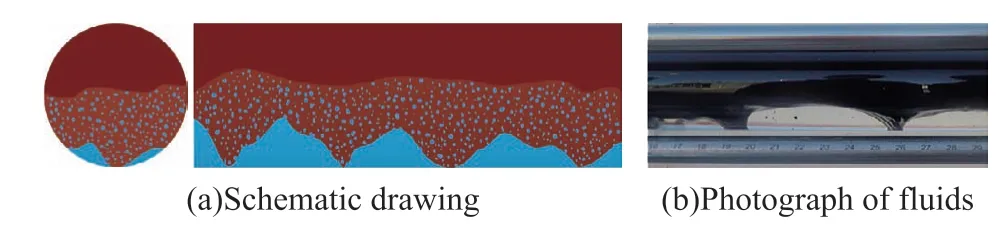
Figure 6 EW/O&W intermittent flow with gel deposition
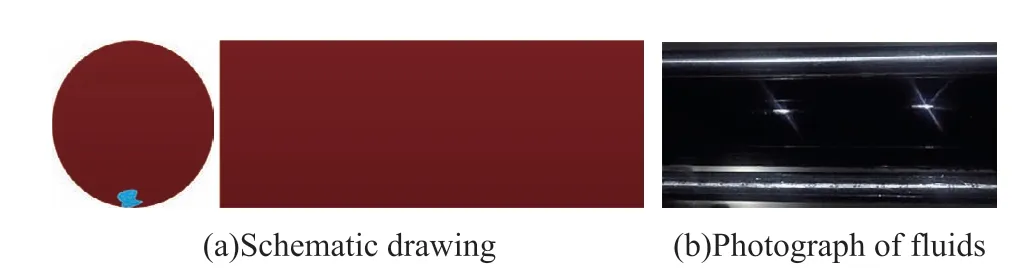
Figure 7 Water single-phase flow with gel deposition
When the experimental temperature was lower than the wax appearance temperature of crude oil, wax crystals gradually separated out, cross-linked with each other, and coalesced with oil molecules, forming the gelled oil with a certain structural strength and a high resistance to flow.In the initial stage of gel deposition, the gel layer was thin, and the EW/O&W stratified flow could still exist below it.
As the experimental temperature continued to decrease,more and more wax crystals were precipitated, causing the gel layer at the upper wall to thicken and resulting in a continuous decrease in the height of the oil-water interface. Therefore, the W/O emulsion and water plug at the bottom of the pipeline alternately contacted with the pipe wall. Once the experimental temperature had decreased to a certain value, the gelled oil deposited and occupied the greater part of the pipeline, leaving only a small amount of free water flow at the bottom. At this point, the oil-water transportation situation deteriorates to such an extent that non-heating gathering and transportation can no longer be carried out.
3.2 Pressure drop
The pressure drop from the wellhead to the metering room at different temperatures was calculated in the invisible flow experiments, as shown in Figure 8. It can be seen that the pressure drop at first increased, then decreased,and finally increased again, showing three obvious turning points. As the experimental temperature decreased, the first turning point in the pressure drop curve corresponded to an obvious increase in the growth rate of the pressure drop. The characteristic temperature of this turning point increased with the increase of pour point. As water fraction and fluid production rate decreased, the characteristic temperature also increased. The second turning point corresponded to the peak pressure drop on the curve, where the growth rate of the pressure drop switched a sign from positive to negative. The effect of pour point, water fraction, and fluid production rate on this characteristic temperature is the same as that mentioned above. The third turning point was the trough of pressure drop on the curve, wherein the growth rate of pressure drop switched a sign from negative to positive. The effect of pour point, water fraction, and fluid production rate on this characteristic temperature was irregular. In order to explain the causes of these turning points, it is necessary to observe and analyze the oil-water flow patterns at the characteristic temperatures.
The relationship between pressure drop and flow pattern was found by the visible flow experiments conducted under the same flow parameters. The flow patterns and pressure drop are shown in Figure 9, whence it can be seen that the pressure drop had the same change trend with three characteristic points, as shown in Figure 8b.Here,T4andT19were both 31.8 °C,T5andT20were both 30.8 °C, andT6andT21were 28.2 °C and 30.0 °C,respectively. It was verified that the first two characteristic temperatures had a certain repeatability and regularity,whereas the temperature of the pressure drop trough did not have. Therefore, unlike the first two characteristic temperatures, the third one is not considered meaningful for the present study.
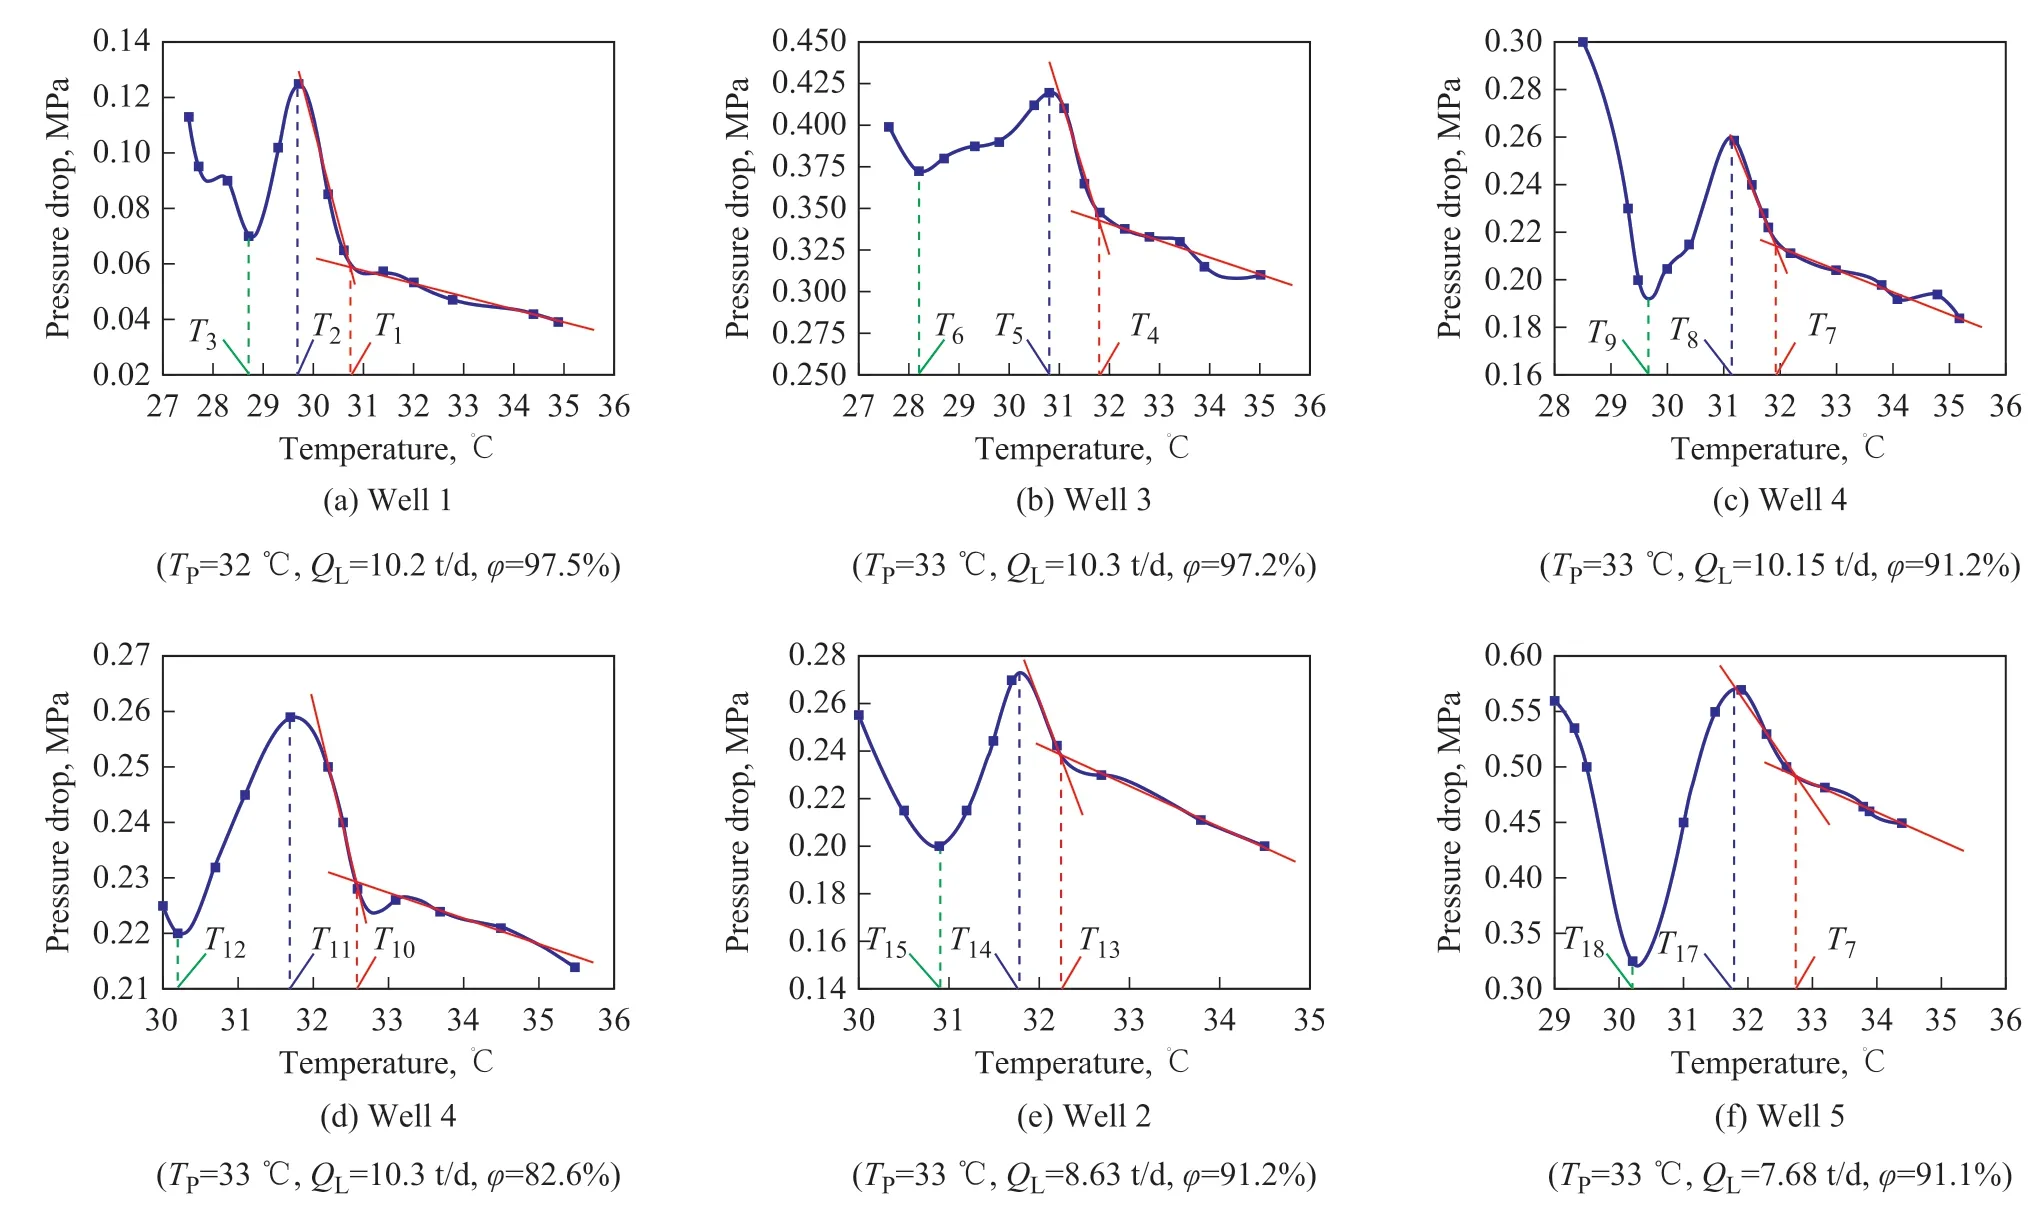
Figure 8 Pressure drop vs. experimental temperature at different pour points, fluid production rates and different water fractions in the invisible flow experiments
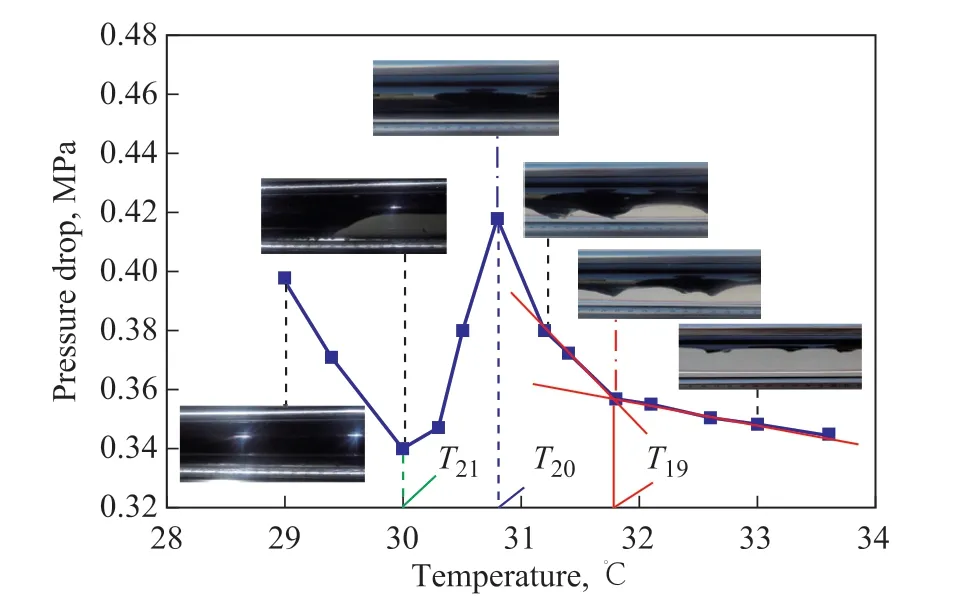
Figure 9 Pressure drop vs. experimental temperature for Well 3 in the visible flow experiment
The pressure drop behavior may be explained and analyzed based on the photographs of the oil-water flow patterns (Figure 10). At the initial stage of the flow experiment, the oil-water flow was an EW/O&W stratified flow at 32.6°C, as shown in Figure 10a.The dominant factor influencing the pressure drop at this stage was the viscosity of crude oil, and as the experimental temperature decreased, the viscosity increased, which led to an increase in pressure drop.When the experimental temperature decreased to 31.8°C, the gelled oil was formed, as described in Section 3.1. When the shear force exerted by the water flow was unable to overcome both the structural strength of the gelled oil and its frictional resistance with the pipe wall, the gelled oil began to stick to the pipe wall and the flow pattern changed to an EW/O&W stratified flow with gel deposition, as shown in Figure 10(b). When the experimental temperature was lowered further, the rate of increase of pressure drop noticeably increased. As the experimental temperature continued to decrease, the resistance between the fluid and the deposited gel layer increased, causing the deposited layer to further thicken and the oil-water interface to continue to drop. The interface height at 31.2 °C was significantly lower than at 32.6 °C. Ultimately, the gelled crude oil deposited and occupied most of the pipeline cross section at 30.8 °C,and the first gel congestion occurred in the pipeline, as shown in Figure 10d. Concurrently, the fluid resistance in the pipeline reached its maximum value, causing the pressure drop to peak. At this stage, the flow medium in the pipeline only consisted of the water phase, and the high-speed water flow rapidly washed away the gelled oil in the lower layer. It caused a decrease in flow resistance, so the pressure drop decreased rapidly.The flow pattern is shown in Figure 10e. However, as the temperature continued to decrease, the deposition rate of gelled oil gradually became greater than the rate at which the water flow took away the gelled oil.Therefore, after some time, the gel congestion occurred again at 29 °C, as shown in Figure 10f, resulting in a rapid increase of pressure drop again.
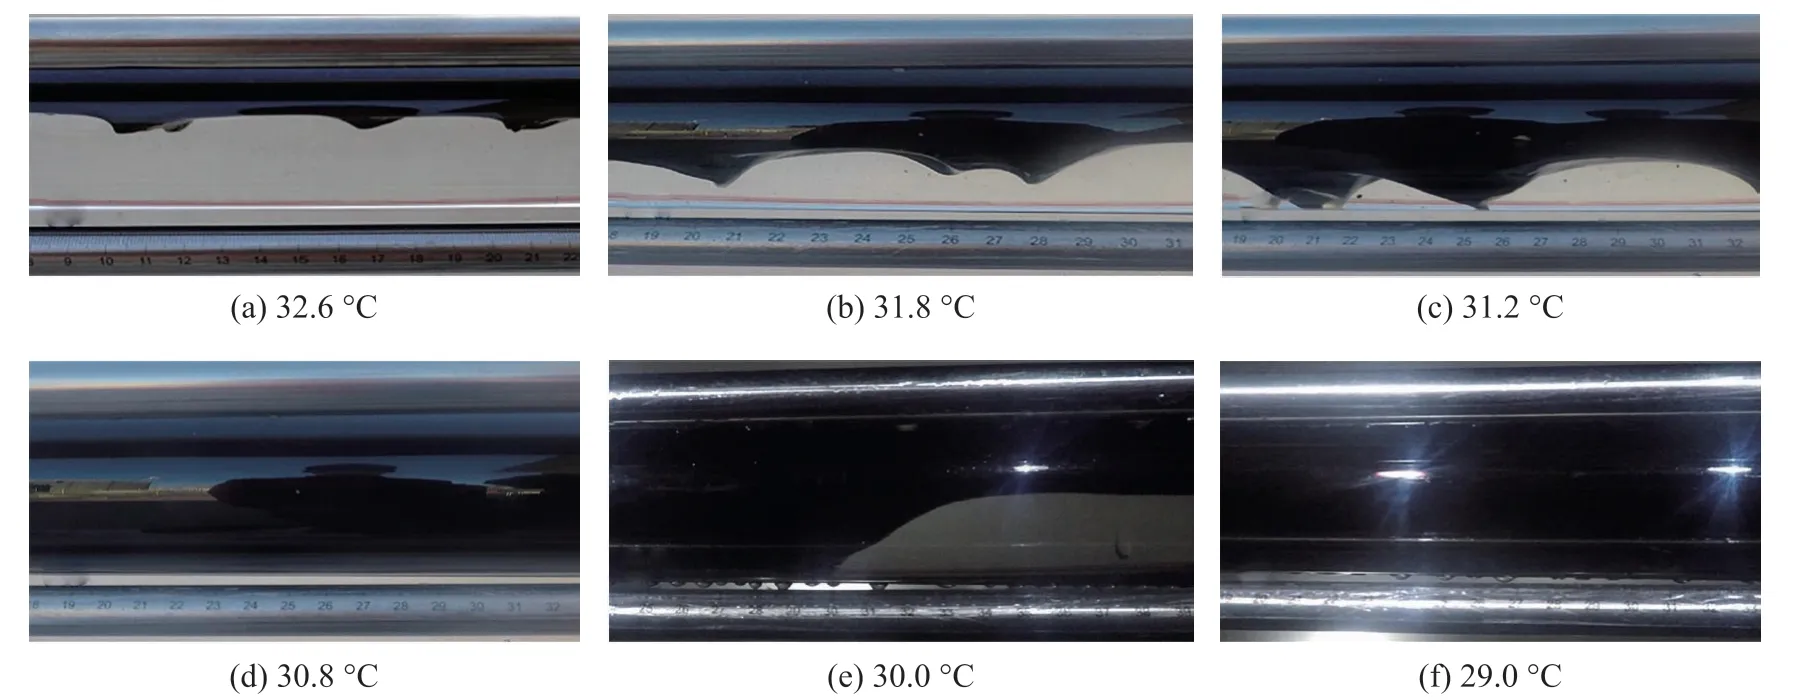
Figure 10 The oil-water flow patterns at different experimental temperatures
3.3 Safe temperature
As the test temperature decreased, the characteristic temperature of an obvious increase in the growth rate of the pressure drop corresponded to the occurrence temperature of gel deposition on the pipe wall, which is called the occurrence temperature of gel deposition.The characteristic temperature at which pressure drop increased to the peak value corresponded to the occurrence temperature of the first congestion in the pipeline. Therefore, the latter can be considered as the safe temperature for the non-heating gathering and transportation. When the temperature of gathering and transportation is higher than the safe temperature, there is still some crude oil flowing in the pipeline and the gathering and transportation process can still be carried out in a short time. The occurrence temperatures of gel deposition and the safe temperatures for oil wells were measured in different blocks of the X Oilfield, as shown in Table 2.
In Table 2,QLis the fluid production rate of test well;φis the water fraction of oil-water mixture;TPis the pour point of crude oil;TGis the occurrence temperature of gel deposition;Ts is the safe temperature.
According to the comparison of the experimental results for crude oils with different pour points in Table 2, the occurrence temperature of gel deposition and the safetemperature are higher for oils with higher pour point. In order to more clearly determine the effects of different factors (such as water fraction and fluid production rate)on the safe temperature, the difference betweenTGandTPunder different parameters was calculated as shown in Figure 11(a). The difference betweenTs andTPunder different parameters was calculated, as shown in Figure 11(b). The results showed that as water fraction and fluid production rate increased, the difference increased. This is because the increase of water fraction caused the volume fraction of the water phase in the pipeline to increase,thereby increasing the distance between gelled oil particles and reducing the probability of their bombarding and sticking to the wall. The effect of fluid production rate was mainly reflected in the shear stress exerted by the water phase on the oil phase. As the fluid production rate increased, the higher velocity of the water phase increased the shear stress exerted on the gelled oil particles, making it more difficult for them to stick to the wall. Therefore,the difference increased.
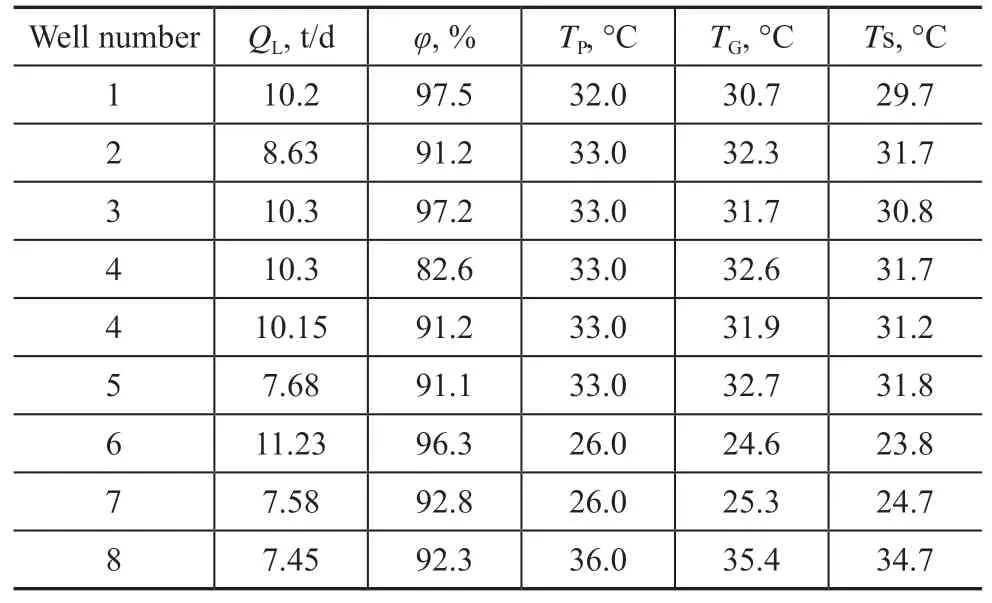
Table 2 Safe temperatures of the non-heating gathering and transportation for test oil wells
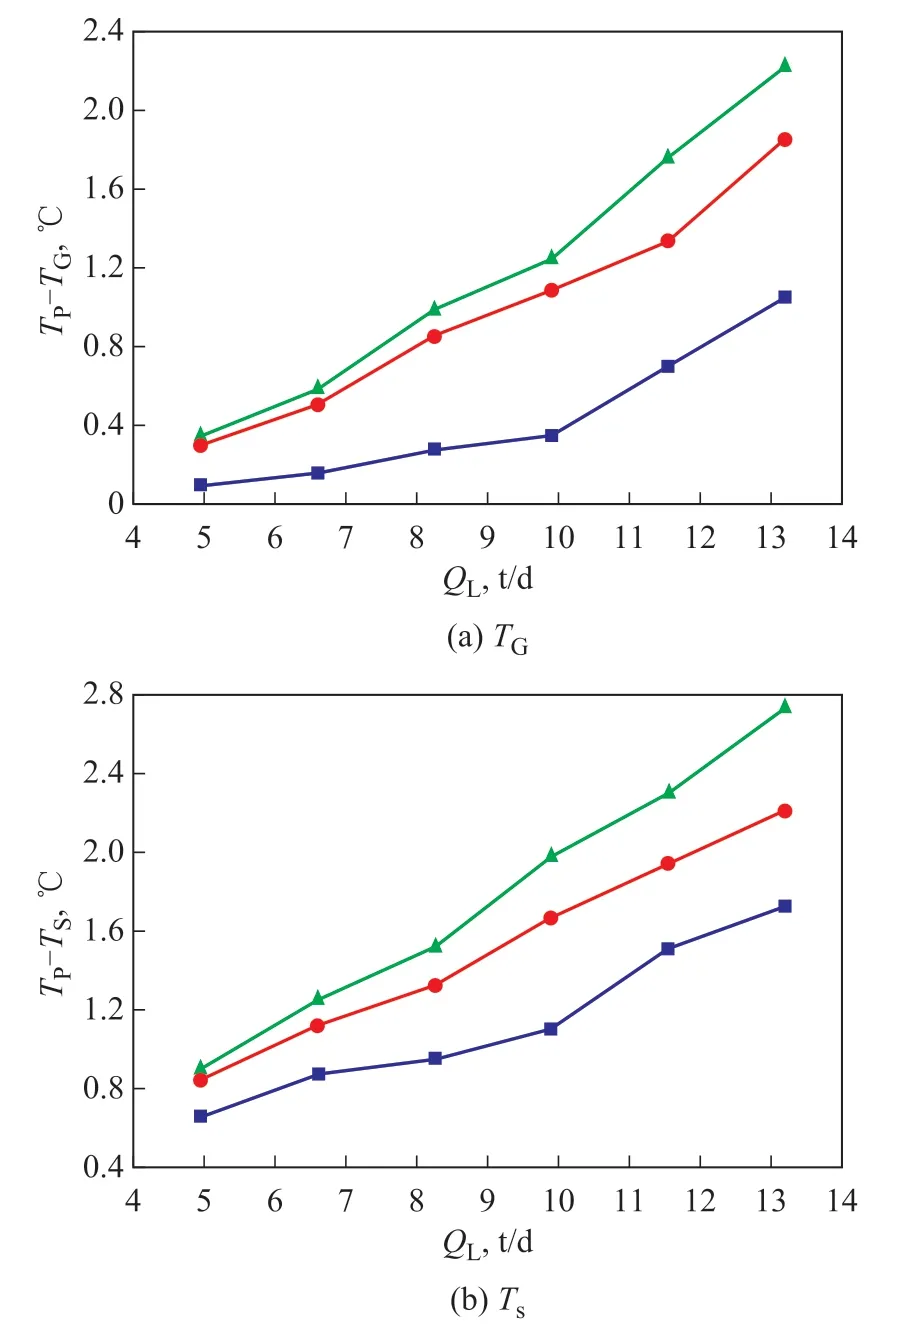
Figure 11 The difference between TG (TS) and TP vs. fluid production rate at different water fractions
3.4 Empirical formula of characteristic temperatures
3.4.1 Establishment of empirical formula
The pour point, water fraction, and fluid production rate were the main factors influencingTGandTS. Based on the multivariate analysis, an empirical formula was established to calculateTGandTSfor crude oil with high water fraction as well as the boundary temperatures of flow pattern transitions in the gathering and transportation processes, as shown in Equation (1):

whereTisTGorTS(℃);k(℃·t-b·db),a,bare the coefficients.Based on the experimental results for wells 1 to 5,empirical formulas for the occurrence temperature of gel deposition and the safe temperature can be established.The coefficients in Equation (1) were obtained via multivariate non-linear regression, with the results listed in Table 3. ForTGandTS, the fitted coefficientsk,a, andbhad different values.
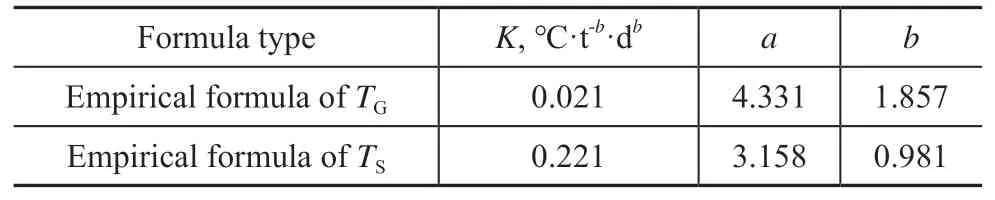
Table 3 The results of k, a, and b in Equation (1)
3.4.2 Validation of empirical formula
In Table 4, the absolute errors of the empirical formula forTGwere < 0.33 °C and forTSwere < 0.20 °C, which could be acceptable for engineering practice. In order to further verify the applicability of the model,TGandTSfor oil-water flow from wells 6, 7, and 8, which were located in different blocks, were calculated, as shown in Table 5, whence it can be seen that the errors were < 0.20 °C and < 0.10 °C forTGandTS, respectively, which could be acceptable for engineering practice. Therefore, these models can be used to calculateTGandTSfor oil-water flow with high water fraction/low fluid production rate in the different oilfield blocks.
4 Conclusions
In this study, an experimental system was designed based on the gathering pipelines of oil wells in the X Oilfield.The effect of temperature, water fraction and flow rate on the flow characteristics of crude oil with high water fraction were obtained via two types of flow experiments,with the main conclusions drawn from the results presented herein shown as follows:
(1) With the help of photography and local sampling,the high water-cut oil-water two-phase flow in gathering pipelines can be classified into four different flow patterns at low temperatures. Especially, three new flow patterns were found to occur below the pour point of crude oil, including the EW/O&W stratified flow with gel deposition, the EW/O&W intermittent flow with gel deposition, and the water single-phase flow with gel deposition. As the fluid production rate and water fractionincreased, the temperature boundaries of flow pattern transition decreased.
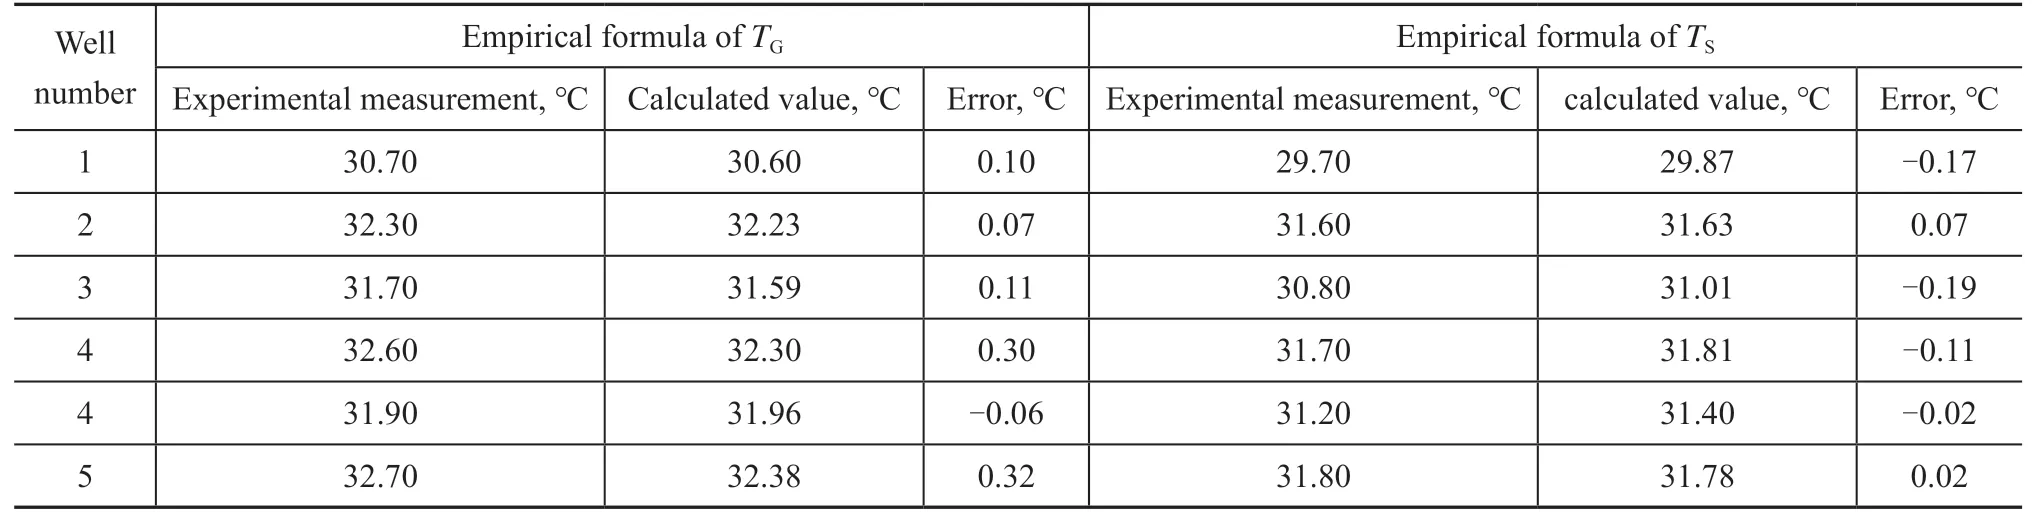
Table 4 The error analysis of the empirical formulas of TG and TS
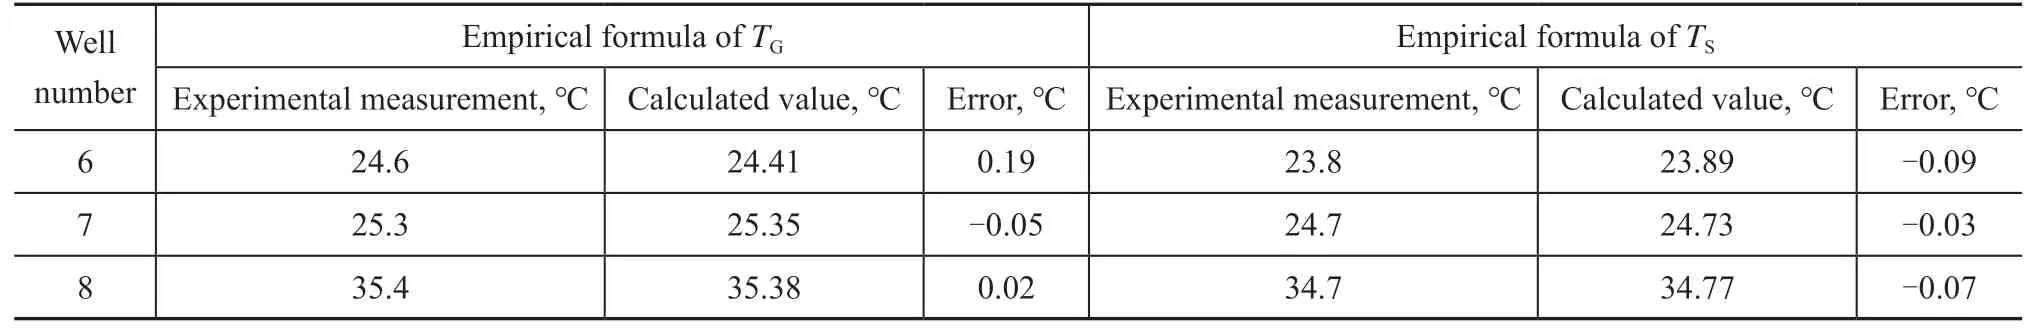
Table 5 The validation of the empirical formulas of TG and TS
(2) As the experimental temperature decreased, the pressure drop first increased, then decreased, and finally increased again, showing two consistently reproducible turning points. The temperatures of these two turning points corresponded to the temperature boundaries of flow pattern transition. The characteristic temperature of the first congestion in the pipeline can be used as the safe temperature for the non-heating gathering and transportation of crude oil with high water fraction at low temperatures, and the pressure drop reached the peak at this temperature.
(3) The characteristic temperature of the first congestion in the pipeline can be used as the safe temperature. The safe temperature increases with the increase of crude oil freezing point, and decreases with the increase of water fraction and fluid production rate. An empirical formula of the safe temperature for oil-water two-phase flow with high water fraction and low fluid production rate was established by analyzing the influence of multiple factors on the safe temperature. In practical application,the safe temperature can be obtained only by knowing the parameters of crude oil freezing point, rheological parameters, water fraction, and fluid production rate.
These results are of key significance for feasibility analyses of non-heating gathering and transportation and can guide the safe operation of these processes.
Acknowledgements:The work is financially supported by the National Natural Science Foundation of China (Grant No.51674281), the Opening Fund of Shandong Provincial Key Laboratory of Oil & Gas Storage (Study on low temperature flow characteristics of oil and water in gathering pipeline) and the Transportation Safety and the Fundamental Research Funds for the Central Universities.
- 中國煉油與石油化工的其它文章
- Preparation and Rheological Properties of Vacuum Lubricating Grease
- Effects of Different Plant Hormones for Microbial Degradation of PASHs and Diesel under Aerobic Conditions
- Nitrogen Removal Performance of Denitrifying Ammonium Oxidation System in Treating Sulfamethoxazole-laden Secondary Wastewater Effluent
- Removal of Basic Nitrogen Compounds from Diesel Fraction with NMP-0.5ZnCl2 Coordinated Ionic Liquid
- Comparison and Analysis of Toluene Adsorption Properties of ZSM-5 Molecular Sieve Treated by Different Modification Methods: Adsorption Kinetic and Mechanism Studies
- Effects of Operating Conditions on the Catalytic Performance of HZSM-5 Zeolites in n-Pentane Cracking