
Application of fracturing technology to increase gas production in low-permeability hydrate reservoir:A numerical study
2021-09-02 12:45:52PengFeiShenGangLiXiaoSenLiBoLiJinMingZhang
Peng-Fei Shen,Gang Li,Xiao-Sen Li,*,Bo Li,Jin-Ming Zhang
1 State Key Laboratory of Coal Mine Disaster Dynamics and Control,Chongqing University,Chongqing 400044,China
2 School of Resources and Safety Engineering,Chongqing University,Chongqing 400044,China
3 Key Laboratory of Gas Hydrate,Guangzhou Institute of Energy Conversion,Chinese Academy of Sciences,Guangzhou 510640,China
4 Guangzhou Center for Gas Hydrate Research,Chinese Academy of Sciences,Guangzhou 510640,China
Keywords: Gas hydrates Fracturing technology Depressurization Low-permeability Permafrost
ABSTRACT Low temperature and low permeability are the challenges for the development of hydrate reservoirs in permafrost.The ice produced around the production well caused by high depressurization driving force reduces the gas production,and it is necessary to reduce the effect of ice production on gas production.In this work,a new combination of fracturing technology and depressurization method was proposed to evaluate the gas production potential at the site DK-2 in Qinghai-Tibet Plateau Permafrost.A relatively higher intrinsic permeability of the fracture zone surround the horizontal production well was created by the fracturing technology.The simulation results showed that the fracture zone reduced the blocking of production ice to production wells and promoted the propagation of production pressure.And the gas production increased by 2.1 times as the radius of the fracture zone increased from 0 to 4 m in 30 years.Nearly half of the hydrate reservoirs were dissociated in 30 years,and greater than 51.7%of the gas production was produced during the first 10 years.Moreover,production behaviours were sensitive to the depressurization driving force but not to the thermal conductivity.The growth of gas production was not obvious with the intrinsic permeability of the fracture zone higher than 100 mD.The effect of ice production on gas production by fracturing technology and depressurization method was limited.
1.Introduction
Natural gas hydrates(NGHs)as a potential alternative energy source have attracted global attentions because of the numerous uncertainties,challenges,and issues regarding to gas production[1].NGHs are widely concentrated in deep oceanic sediments and permafrost,where the necessary low temperatures and high pressures exist[2].The gas production from NGH deposits is considered to have a much greater impact on the global economy than other unconventional natural gas deposits[3].There are mainly four prevalent methods in dissociating gas hydrate from hydrate deposits: depressurization [4–6],thermal stimulation[7–9],chemical inhibitor injection [10–12],and CO2replacement[13–15].The gas recovery principle from hydrate deposits is that the NGHs dissociating into water and gas by temperature increase or pressure reduction.The depressurization method is considered to be the most promising method for the gas production.There are different ideal mining methods for the gas production from hydrate reservoirs with specific geological conditions.For example,the inverted five–spot water flooding method[16,17],the Steam-Assisted Gravity Drainage method[18],the Heat-Assisted Antigravity Drainage method[19],and the huff and puff method[20]were all the combinations of thermal stimulation and depressurization methods for the hydrate deposits with high thermal conductivity.However,all the aforementioned methods are inefficient and not suitable for the gas production from permafrost with very low permeability.Thus,improving the percolation capacity is the key to the productivity of low-permeability reservoirs.
During 2008–2009,the Scientific Drilling Project of gas hydrate in Qinghai-Tibet Plateau Permafrost(QTPP)was successfully carried out.As shown in Fig.1,the area of drilling area was about 4×10⁵m2,and the total amount of natural gas hydrate resources in the drilling area was about 9.42×10⁵m3[21,22].The area of QTPP was approximately 1.0×10⁵km2[23],hence,the total gas production in the permafrost region was expected to reach 2×10¹¹m3.As shown in Fig.2,the NGH samples collected from DK-1,DK-2 and DK-3 sites showed that the hydrate deposits were mainly concentrated in mudstone,fine–grained sandstone,siltstone,oily shale,and the fine-to medium–grained sandstone [21].The drilling project at the site DK-2 indicated that four hydrate–bearing layers at the depth of 144.4–152.0,156.3–156.6,235.0–291.3,and 377.3–387.5 m,respectively.[24].The drilling results showed that the NGH gas composition was complex: 54%–76% CH4,8%–15% C2H6,4%–21% C3H8,and 1%–7% CO2.Besides,there was a small amount of butane,pentane,etc.[22].Field measurements indicated that the annual average temperature in QTPP was from ?1 to?3 °C,and the geothermal gradients within and under the frozen layer were 0.011–0.033 and 0.028–0.051 °C·m?1,respectively [25].Therefore,the necessary high pressure and low temperature under equilibrium conditions ensured the stability of the NGH deposits in QTPP.
The hydrate accumulations at the site DK-2 were considered to be characterised by a hydrate-bearing layer(HBL),and the HBL was confined with two low-permeability boundary layers[19].The depressurization method was proved to be limited for the gas production from permafrost deposits with low-permeability in vertical or horizontal wells[19,26].The production performance of the two-spot horizontal well system and the five-spot well system were compared when using depressurization combined with thermal stimulation[27].The comprehensive flooding patterns in multi-well systems involving horizontal wells were also studied[17].In addition,a single vertical well was not ideal for the NGH deposits development in the QTPP[28],and horizontal wells had great advantages over vertical wells in gas production[29].Hence,only horizontal wells were considered in this work.For the hydrate sediments with low permeability,the propagation of depressurization pressure was limited,which reduced the effective gas production.In order to increase the gas production of hydrate reservoir,high pressure driving force was necessary,so the effective method was to reduce the impact of ice produced under high pressure driving force on gas production.Through the analysis of the influence of ice production near the production well on gas production,the ice production mainly blocked the gas–liquid flow near the production well.This situation could be improved by fracturing technology to increase the permeability near the production well.
Fracturing technology was a feasible method to improve the percolation capacity in low-permeability reservoirs,and it was widely used to increase the production of coalbed methane in coal mines[30,31].The fracturing fluid could create cracks in rock matrix under high pressure and affect the pore structure of the reservoirs[32].The geometry and saturation state of the fracture network was proved to have an important influence on the coal permeability evolution [33].The permeability of the hydrate-bearing sediments directly affected the flow capacity of sediments [34,35].Similarly,NGH production depended on the pore structures and the porous space distributions,which significantly affected the hydraulic permeability.The effect of fracturing technology on the gas production from unconventional shale formations was proved to be feasible by creating artificial cracks in the rocks surrounding the production well[36].The increase of the intrinsic permeability in the hydrate deposits could improve the gas production rate[6].In addition,for any low–permeability rock,the intrinsic permeability of the fracture zone produced by fracturing technology could be increased by 2 to 3 orders of magnitude[37].Meanwhile,hydrate technology could be used for hydrogen storage[38],carbon dioxide capture[39]and other purposes.Up to now,enhancing the gas production from hydrate reservoirs with low-permeability was still a major problem under current technologies.At present,most of the scholars'mining experiments were based on the marine hydrate reservoir,and the related technical methods were more inclined to the application of marine sediments.However,there were few related experiments of hydrate reservoir in permafrost area,including laboratory reduction.This was mainly because the conditions for hydrate synthesis in rocks were extremely harsh.Therefore,this study was based on the application of fracturing technology was mature,and this study could also be a good guide to the implementation of the experiment.
In this work,we employed the thickest hydrate–bearing layer(56.3 m)at the site DK-2 as the hydrate deposit zone,and analysed its production behaviours in the single horizontal well system.The fracturing technology was employed to create fracture zone surround the horizontal production well.The fracture zone was assumed to have a relatively higher intrinsic permeability.The spatial distributions of temperature,pressure,hydrate,and gas saturations were compared for a 30 year production period.The sensitivity to different circumferential radii and intrinsic permeability of the fracture zone were also analysed.
2.Production Scenario and System Description
2.1.Production methods
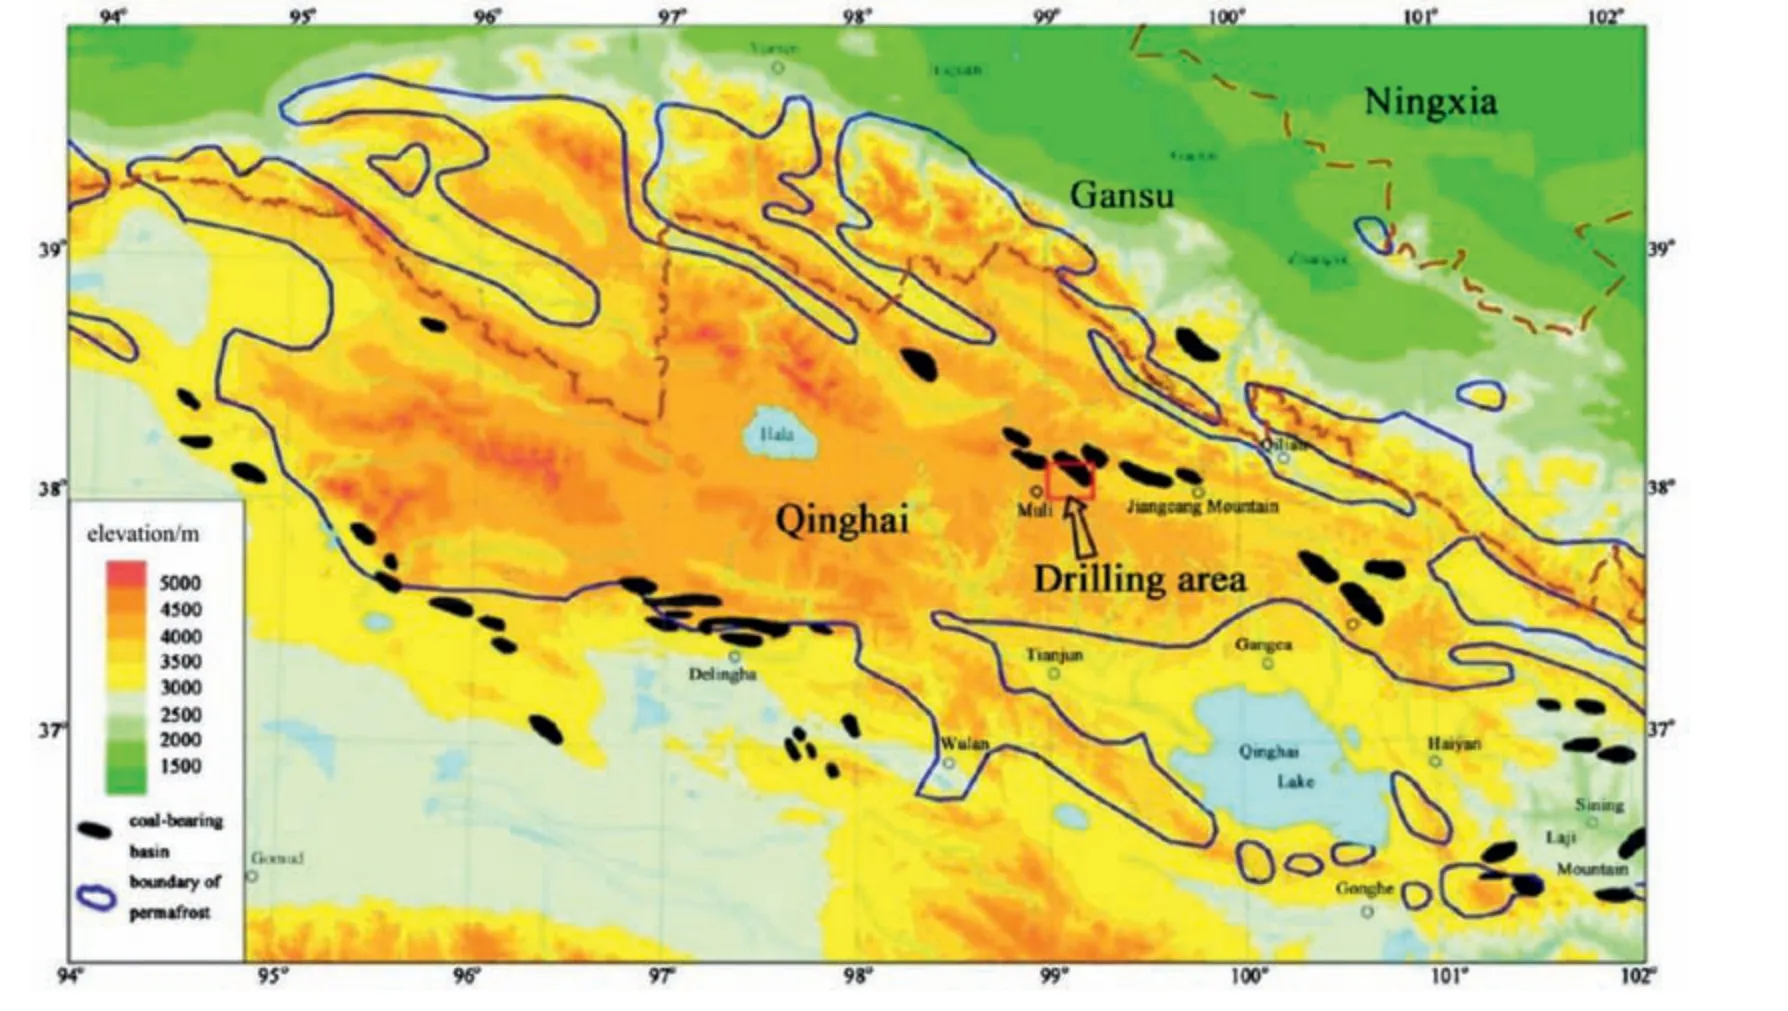
Fig.1.Location map of the Scientific Drilling Project of gas hydrate in the QTPP[22].
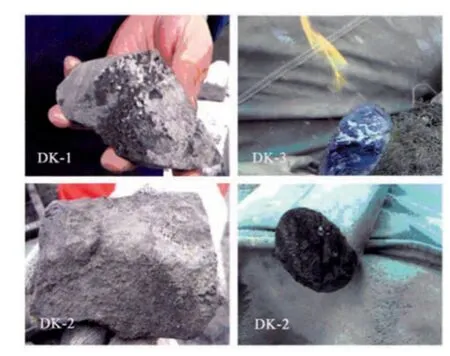
Fig.2.Gas hydrate cores from the QTPP[22].
A combined fracturing technology and depressurization method was employed to induce gas production from the permafrost hydrate deposits.The first step was to create fracture zone surround the horizontal production well in the reservoir rocks.In this work,in order to make the simulation of hydrate reservoir more realistic,the grid near the production well was divided in detail.As shown in Fig.3b,the grid around the production well was divided into a circle,which was very important for the implementation of horizontal well.The key to the feasibility of fracturing technology was to create fracture zone surround the horizontal production well in the reservoir rocks.This was to make the rock around the horizontal well have a better high permeability.The fracturing area was around the horizontal well,and it was considered that the length of the fracturing area is the same as that of the horizontal well.The fracture zone could provide channels for free gas flow to the production well.Then,the depressurization method was used to obtain a continuous gas production.The driving force ΔPW=0.97 PW0was employed because the gas production from NGH deposits was ineffective under limited driving force in QTPP[40].
2.2.Well configuration
The single horizontal well system was used to evaluate the gas production in this work.As shown in Fig.3a,the horizontal production well was alternately distributed in the middle of the HBL.Only a single rectangular unit was used because of the symmetry of the system.In other words,the distance between the two production wells in the single horizontal well system was 90 m.The production well radius rw=0.1 m was used to evaluate the spatial distributions of pressure,temperature,and hydrate and gas saturations during hydrate deposit dissociation.The horizontal production well was also used as the inflow channel for fracturing–fluids during the fracturing period.The properties of the production well were assumed to be φ=1.0,k=5.0×10⁻⁹m2(5000 Darcies),and a capillary pressure of Pcap=0 [40,41].The horizontal production well was assumed to be 1000 m in length.In the simulation system,the default of mesh grid of each meter of the horizontal production well had the same attribute.Hence,the length selection of horizontal well length has limited influence on the simulation results of this paper.But one thing to explain was that the rock around the production well could be fractured and broken by sections.This method could ensure that the horizontal production well could be constructed to the length of 1000 m assumed in this paper.Of course,in the actual construction,the length of the production well could also be reasonably selected according to the distribution of the reservoir.
3.Numerical Models and Simulation Method
3.1.The numerical code
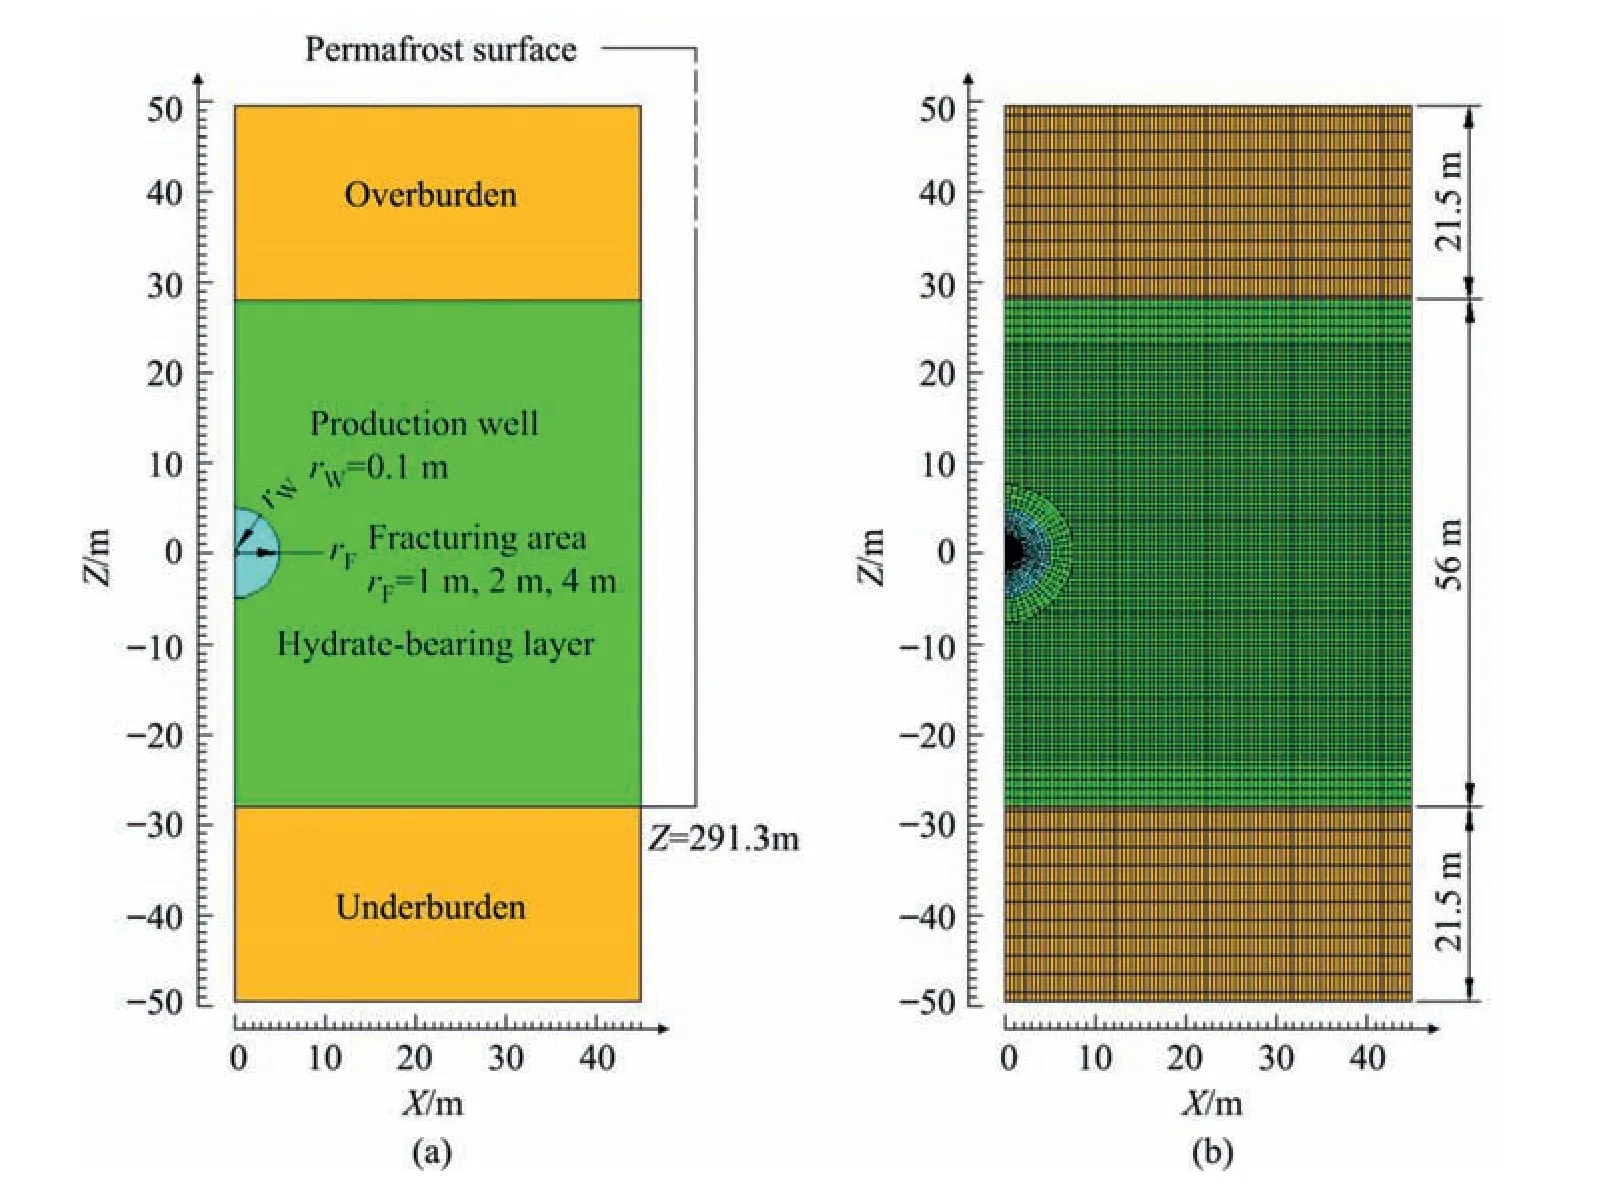
Fig.3.(a)Sketch of the hydrate reservoir at the site DK–2,and(b)the corresponding 2D hybrid mesh.
The simulation results were calculated using the parallel version of the TOUGH+ HYDRATE (T + H) code [42].The T + H as a compositional code was typically used to predict the dynamic properties of the gas hydrate formation and dissociation in multiple phases and components.The T + H simulator included both an equilibrium model and a kinetic model for different simulation scales.The equilibrium model was employed to simulate the hydrate dissociation process because of its better performance in field-scale hydrate deposits.The production period for the simulation calculation was 30 years.
3.2.Geometry and domain discretization
Fig.3 shows the geometry and the corresponding simulation grid of the single horizontal well system.The single horizontal well system consisted of three layers:an overburden layer(OB),a hydratebearing layer(HBL),and an underburden layer(UB).The flow properties and the permeable deposits were identical for these three layers.Their x locations were located in the area 0 ≤x ≤45.0 m.The simulation region extended from 213.8 m to 312.8 m below the permafrost ground.The thickness of each layer from top to bottom was 21.5 m,56.0 m and 21.5 m,respectively.The thickness of the total domain was 99 m.The OB and UB were considered to be adequate for the heat and mass exchange description because of its low intrinsic permeability.
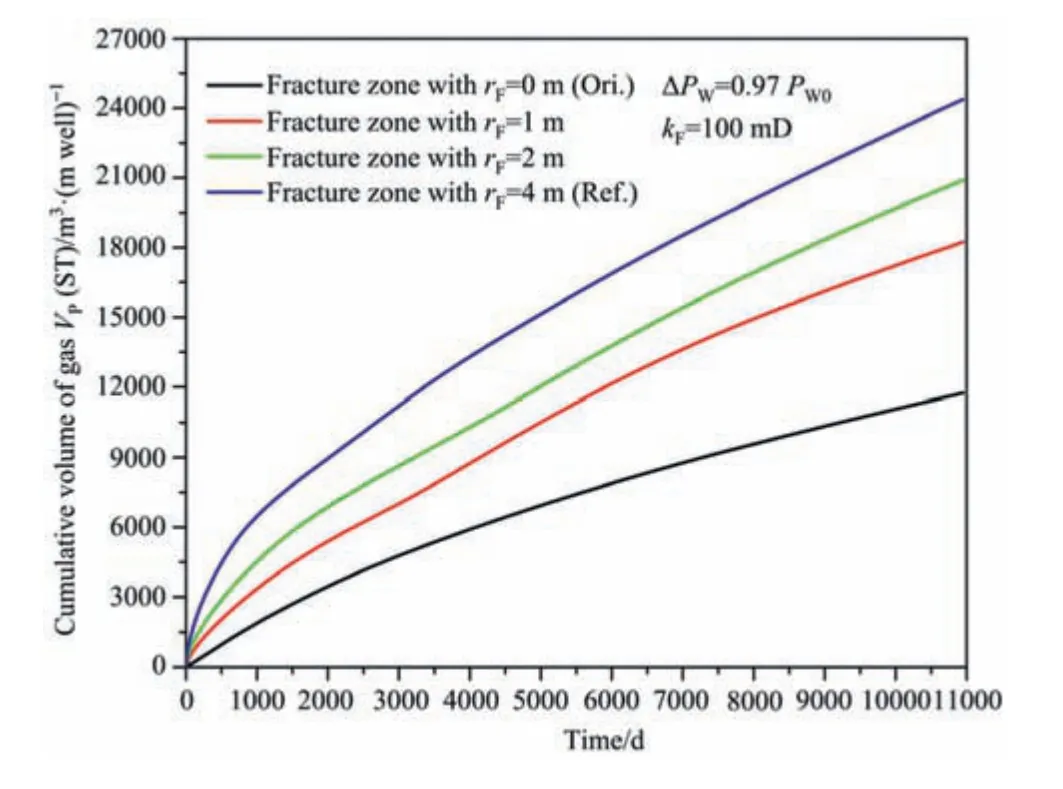
Fig.4.Evolution of the VP and its dependence on rF.
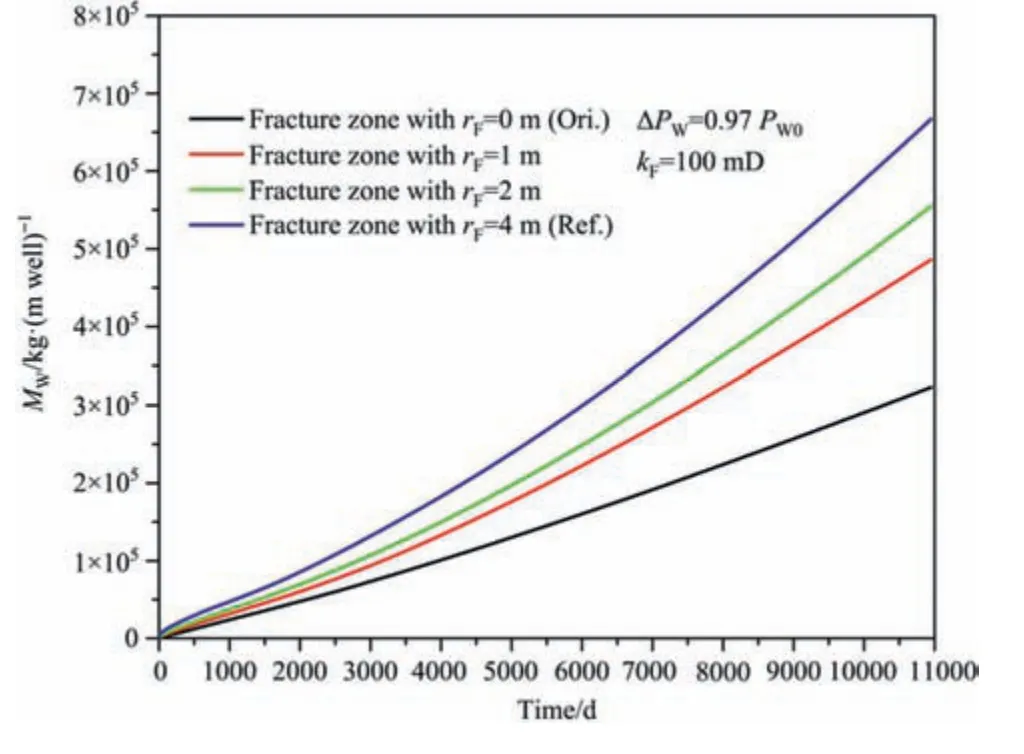
Fig.5.Evolution of MW and its dependence on rF.
In the Cartesian coordinate system,only one-half of the production well was placed in the middle of the HBL at the z=0 m,and its x location was 0 m.The fracture zone with a circumferential radius rFwas considered to be isotropic.The rF=0,1,2,and 4 m were employed to simulate the artificial fracture region in the reservoir rocks,respectively.The only difference between the HBL and the fracture zone was that the fracture zone had a higher intrinsic permeability.The two–dimensional(2D)hybrid grid shown in Fig.3b consisted of 12,588 elements.A progressively refined cylindrical mesh in the area r<7.5 m was used to exactly describe the pressure fluctuation and complex flow characteristics during the gas release from the hydrate deposits.The discretization along the x axis was uniform with a value of Δx=0.5 m.A very fine discretization(Δz ≤0.5 m)was used in the HBL,but it became coarse in the OB and UB to simplify the calculation.A single unit of the production well Δy=1.0 m was employed for simulation because of the uniformity along the horizontal production well.
3.3.System properties and initial conditions
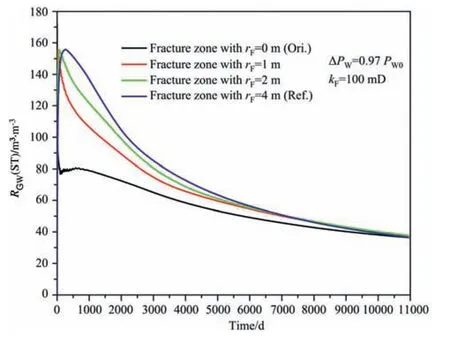
Fig.6.Evolution of RGW and its dependence on rF.
Table 1 lists the system parameters and properties of the simulation mode.The uppermost OB and the lowermost UB elements were inactive,which means the pressure and temperature conditions were constant over time.The initial temperature and pressure at the top and bottom boundaries were determined based on the geothermal gradient and the thickness of the permafrost layer underground,respectively.The initial temperatures and pressures of the OB,HBL,and UB were determined using the methods described by Li et al.[41,43].Initial temperature and pressure at the bottom of the HBL were 277.84 K and 4.19 MPa,respectively.The initial saturations of aqueous SAand hydrate SHwere selected as 0.60 and 0.40 for the HBL,respectively.The aqueous saturation SAin the OB and UB was assumed as 1.0.The porosities of the OB,HBL,and UB were 0.30.The intrinsic permeabilities of the OB,HBL,and UB were 1 mD.
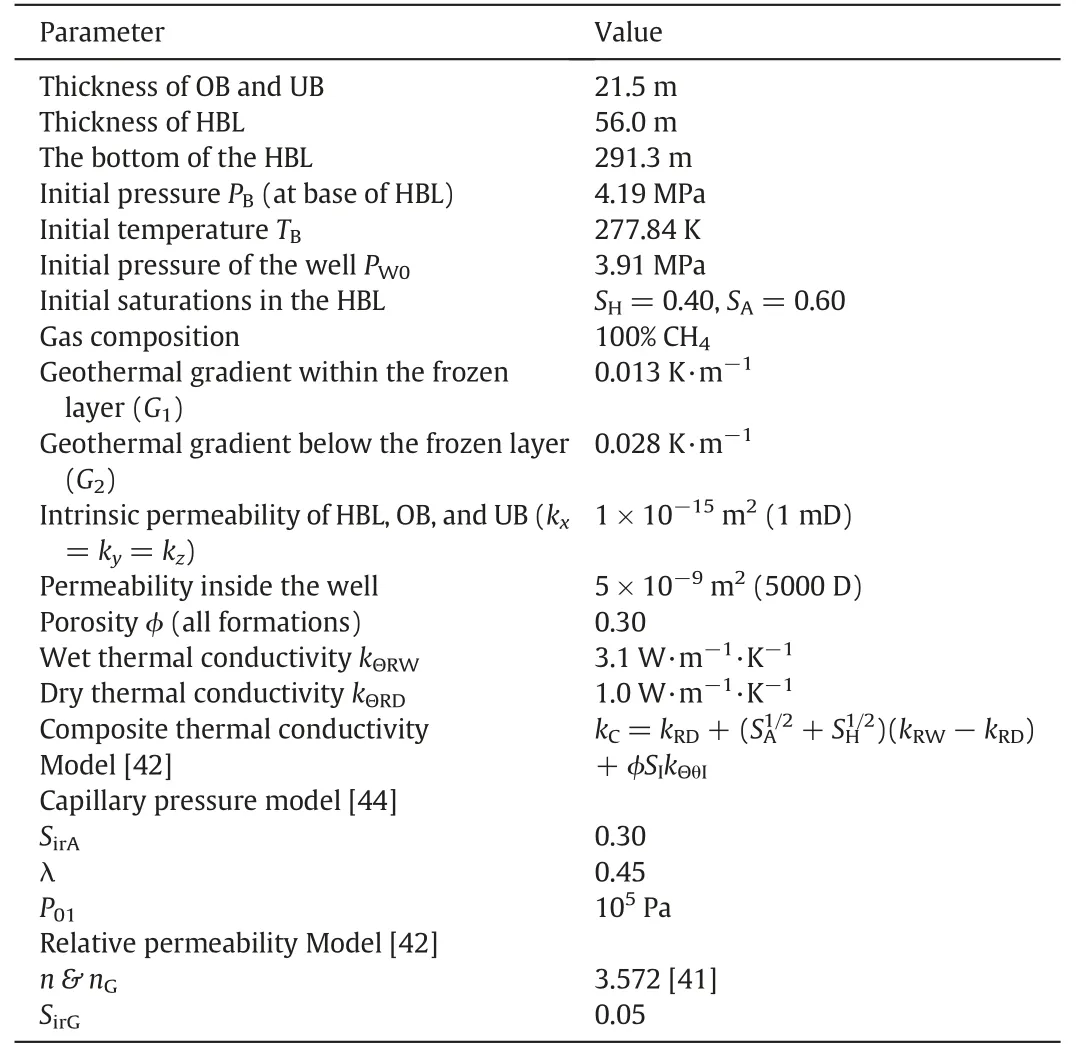
Table 1Physical properties and conditions of the hydrate reservoir at the site DK–2 in Qilian Mountain permafrost
4.Simulation Results
4.1.Production behaviour
In this work,the depressurization scenario using the single horizontal well was conducted to evaluate the gas production effects of the fracturing technology.The gas and water production behaviours were evaluated with different rF.All the cases were calculated for 30 years under the same ΔPW=0.97 PW0,and the same intrinsic permeability of the fracture zone kF=100 mD.The case of rF=0 m was set to be the original case(Ori.),and the case of rF=4 m was set to be the reference case(Ref.).
4.1.1.Gas and water production
Figs.4 and 5 show the evolutions of the cumulative volume of the produced methane gas VPand the cumulative mass of water production MWwith different rFover time.In these four cases,the VPand MWcurves were all characterised by a continuous increase during the production period.It was shown that the longer the rF,the larger the VPand MW,which means there was an obvious effect of the rFon the gas release from the hydrate deposits.The percentage of the dissociated hydrate increased from 22.2%to 45.7%as the rFincreased from 0 to 4 m.In each case,the gas production rate decreased,but the rate of water production rapidly increased during the latter few years.At the end of the 30 year production period,as shown in Fig.4,the VPin the original case was nearly 1.18×10⁴m3·m?1of well along the production well under standard state(ST),and the corresponding final MWwas 3.23×10⁵kg.In other words,the total gas production from the production well was nearly 1.18×10⁷m3.In addition,only 26.3% of the gas production was produced during the first 10 years,indicating the gas production behaviour was poor in the low-permeability sediments.
However,in the reference case,the VPwas greater than 2.43×10⁴ST m3·m?1of well,a large improvement compared to that in the original case.The increase of the gas production rate during the later stage indicated that the fracture zone caused by the fracturing technology promoted the pressure propagation velocity.The final MWwas 6.67×10⁵kg,and greater than 51.7%of the gas production was produced in the first 10 years,indicating the methane gas flow rate slowed in low-permeability deposits during the latter stage of the gas dissociation process.In addition,the effective influence on the hydrate dissociation rate of the rFgradually decreased.
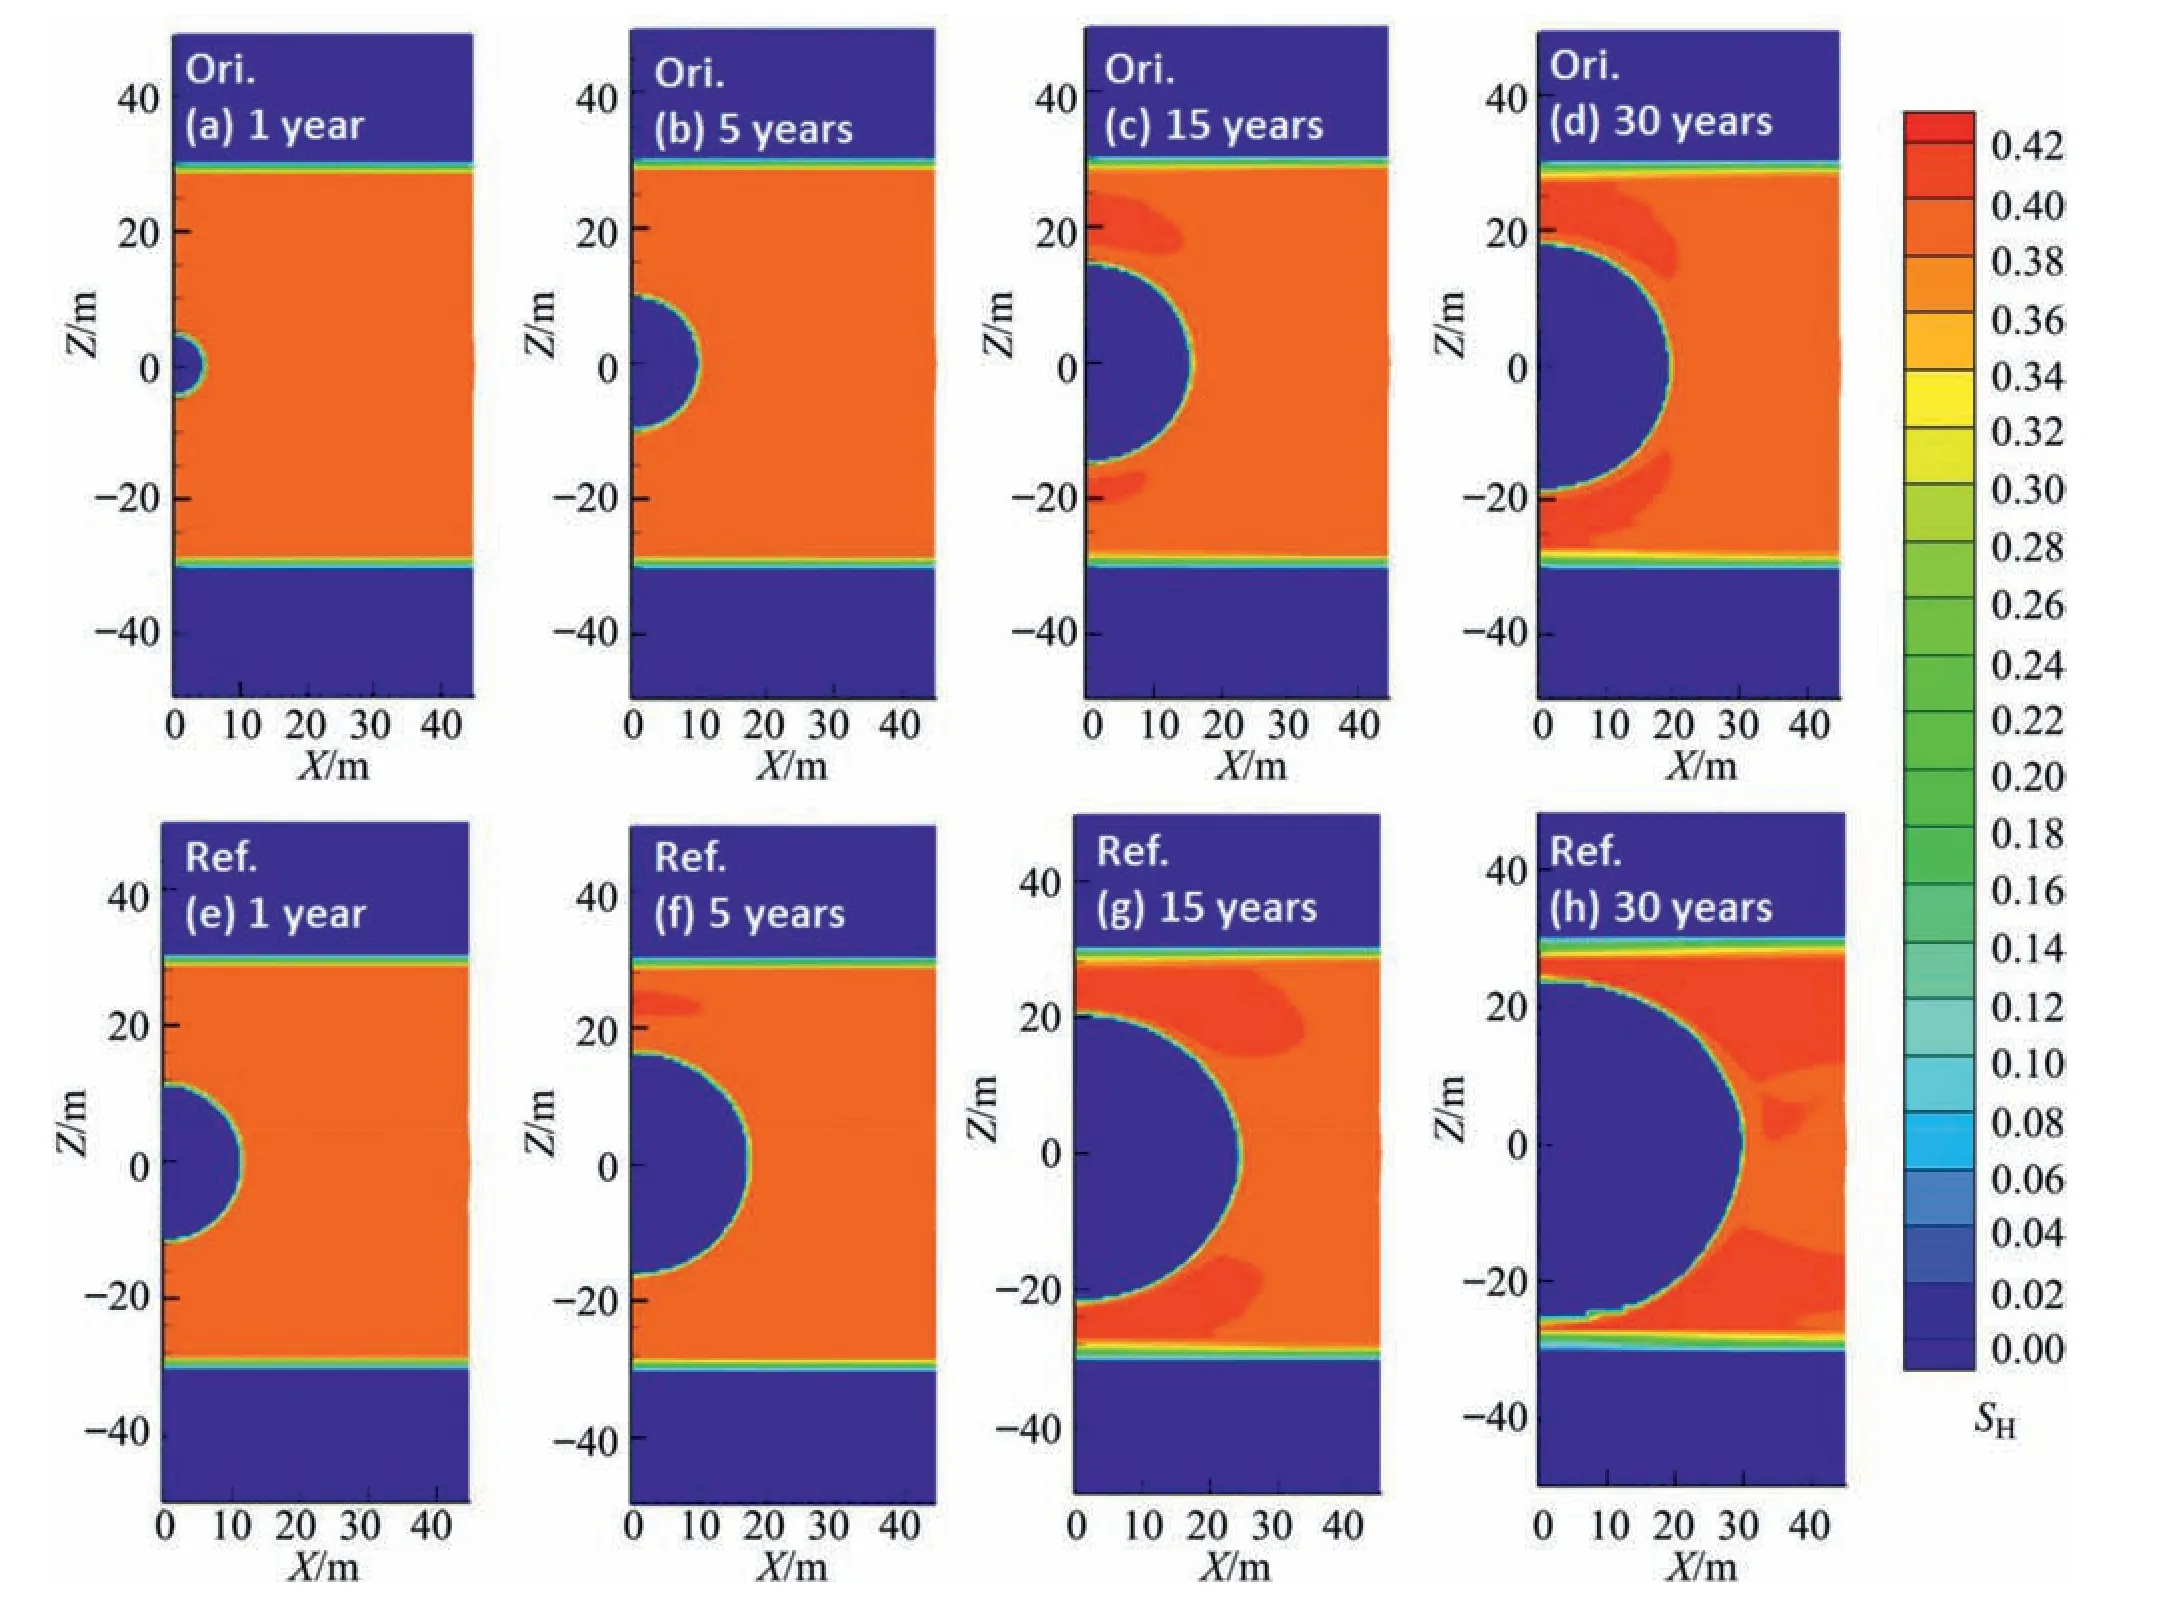
Fig.7.Evolution of SH overtime in the original case and the reference case.
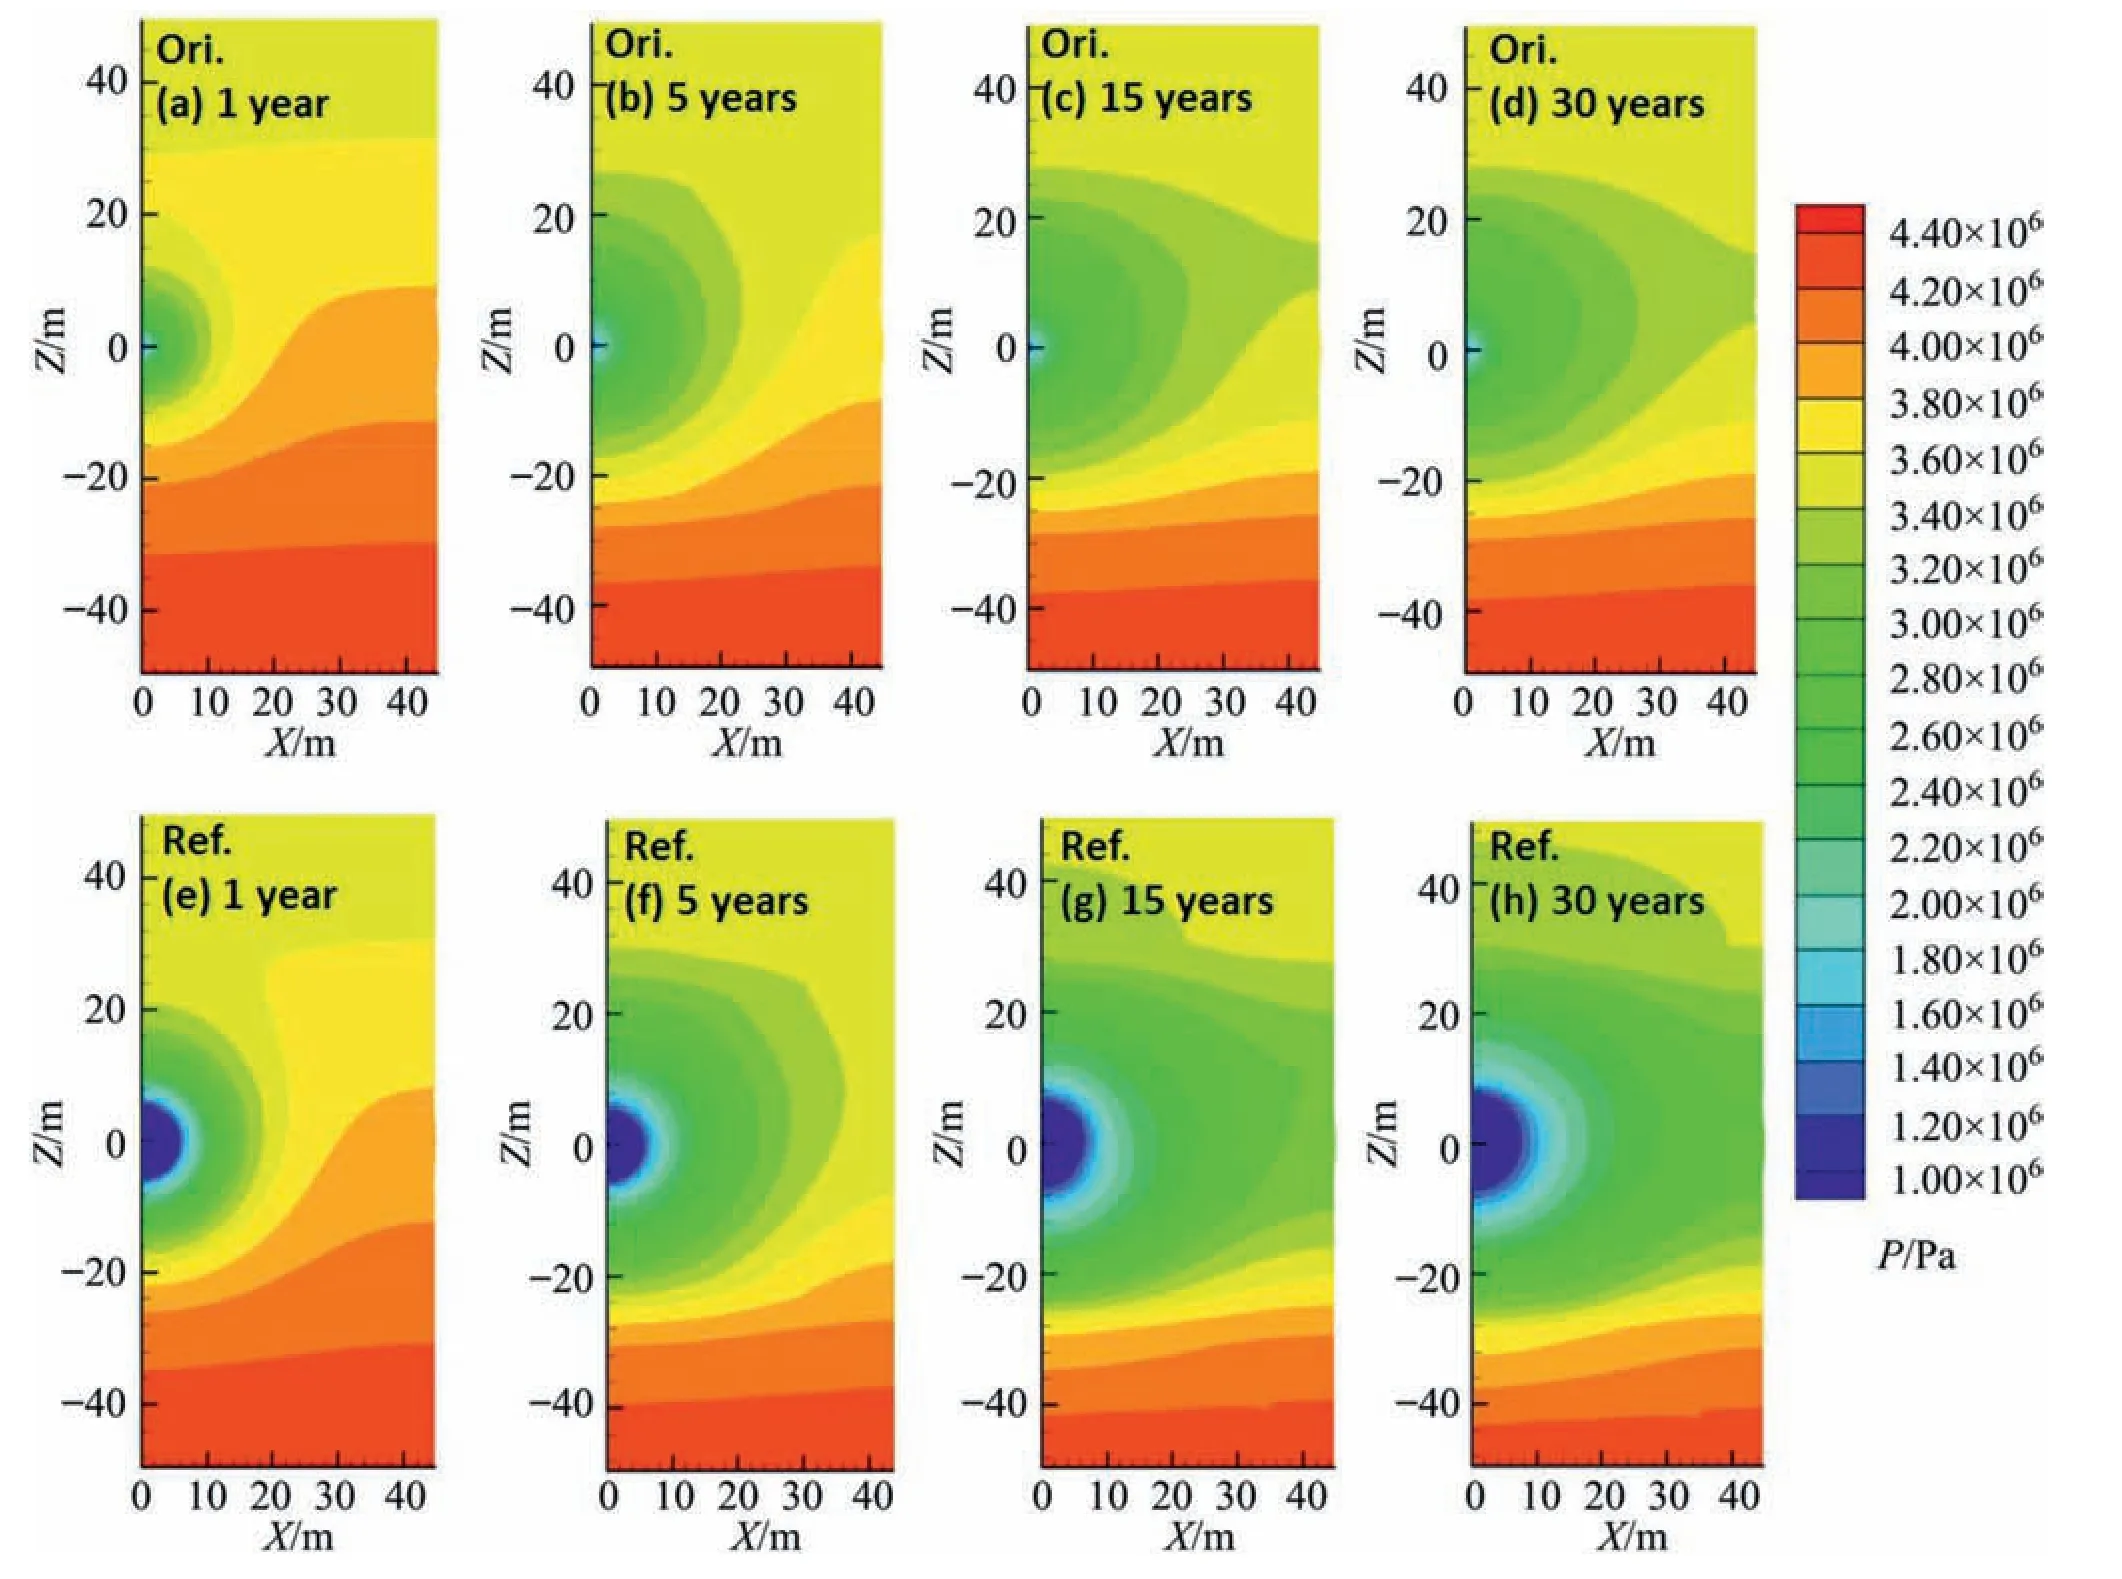
Fig.8.Evolution of the SG overtime in the original case and the reference case.
4.1.2.Gas-to-water ratio
Fig.6 shows the gas-to-water ratio RGW(RGW=1000 VP/MW)over time.The ratio curves sharply increased during the first 500 days and then gradually decreased.The RGWof the original case was less than that of the cases using the fracturing technology.During the production period of 500 to 7000 days,the RGWincreased as the rFincreased from 0 to 4 m.However,in the reference case,the RGWwas less than the case of rF=2 m after 7000 days,because the CH4remained in the hydrate deposits was at a low level.A similar situation occurred as the hydrate resources decreased,indicating that the fracturing technology contributed to an increase in the gas production rate and a decrease in the production time.The RGWimprovement was mainly concentrated in the previous decade and tended to stabilise after 10 years.In addition,the RGWexceed 100 m3of gas/m3of water in initial 2000 days,which was much greater than the previous study in the QTPP hydrate deposits[41,43].Hence,a significant conclusion that could be drawn from the RGWbehaviour was that the use of fracturing technology greatly enhanced the gas production rate.
4.2.Spatial distributions
4.2.1.Spatial distribution of SH
Fig.7 gives the spatial distribution of hydrate saturation SHover time in the original case and the reference case.The time points selected were t=1,5,15,and 30 years,respectively.In the original case,as shown in Fig.7d,the radius of the hydrate dissociation region was approximately 20 m.However,in the reference case(Fig.7h),the radius of the hydrate dissociation region was greater than 30 m,a great improvement for low-permeability hydrate reservoirs.The actual dissociation region in the original case of 30 year(Fig.7d)was not as pronounced as that in the reference case of 15 year(Fig.7g).The hydrate dissociation rate in the x axis was slightly higher than that in the z axis,because the pressures of the production wells would interact with each other during the hydrate exploitation.After this,the dissociation of the hydrate deposits gradually occurred in the direction of OB and UB.The increase of SHin the HBL boundaries indicated the formation of secondary hydrates,which played an important role in impeding the gas and water flow to the production well from the OB and UB.Notably,the hydrate dissociation area was symmetrically distributed in the domain along the middle of the production well.Hence,the ideal distance for the production wells was between 40 m and 60 m.In other words,the hydrate dissociation regions would finally connect to one another along the x axis when the distance between two production wells was less than 40 m.The comparison between the original case and the reference case showed that the application of fracturing technology had a promoting effect on the gas production.However,the effect on the hydrate dissociation was not particularly ideal during the later stages.The results of these comparisons indicated that fracturing technology combined with the depressurization method was a practical technique in dissociating methane hydrate from low-permeability hydrate deposits.
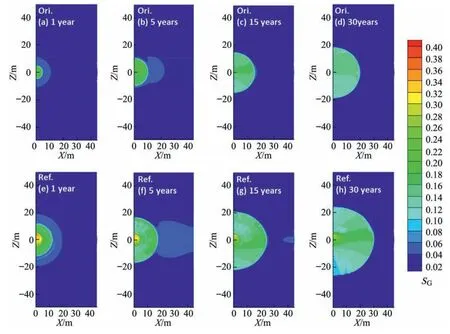
Fig.9.Evolution of the P overtime in the original case and the reference case.
4.2.2.Spatial distribution of SG
Fig.8 gives the spatial distribution of gas saturation SGover time in the original case (Ori.) and the reference case (Ref.).As shown in Fig.8a and e,during the first year,the free gas released from the deposits was mainly concentrated at the fracture zone.After this,the gas released from the hydrate deposits remained as free gas rather than being extracted from the reservoir because of the low permeability.The SGwas at a low level in the hydrate deposits,but at a high level in the production well because the free gas accumulated over time.The formation of secondary hydrate ensured that the gas could flow to the production wells rather than the upper and lower layers.A large amount of free gas still existed in the production area,and the free gas saturation was very small in the OB and UB.The gas distributions within the original sediments were very limited.This was because the undissociated hydrate deposits acted as a barrier role to prevent the gas and fluid movement.Therefore,improving the percolation capacity of low–permeability reservoirs was the key to increase the gas production.
4.2.3.Spatial distributions of P and T
Figs.9 and 10 give the evolution of the P and T spatial distributions over time in the original and reference cases.As shown in Fig.9d and h,the regions influenced by the depressurization in the reference case were greater than that in the original case.This situation was similar in the cases with the increase in the rF.The pressure propagation velocity was faster in the reference case compared to that in the original case.The pressure gradient spreads as the free gas and fluid flowing to the production well.The pressure fluctuation around the production well was tended to ladder distribution,which indicated that the hydrate dissociation process was relatively stable.In addition,the free gas and fluid mainly flowed to the hydrate HBL at the end of the simulation,because the pressures in the OB and UB were nearly constant.The pressure distributions in the OB and UB were nearly constant until the secondary hydrate decreased to a very low level.
The temperatures in the HBL were mainly affected by the heat convection caused by the gas and fluid flow.As shown in Fig.10,the temperature around the production well nearly decreased to 0°C in the reference case.In this study,through the simulation of gas production of hydrate reservoir in permafrost area,it was found that the effect of depressurization on gas production of hydrate reservoir in permafrost area with low permeability was limited.When a large driving force of depressurization was used,it could be clearly found that ice was produced near the production well in the simulated cloud chart.However,as the radius of the horizontal well was only 0.1 m,the area of ice production was very small compared with the whole simulation grid of 45 m.It could be seen clearly only after amplification in the distribution cloud map,so this paper did not draw the evolution process of ice production with time.In order to show that fracturing technology could reduce the impact of ice production,the cumulative gas production and the spatial distributions of T was to employed show this effect.The ice formation during the early stage of gas production was mainly caused by depressurization.The temperature decreased until the new temperature meets the equilibrium condition.There was a buffer period of pressure reduction before hydrate dissociation.The temperature in the OB and UB was approximately constant,indicating that there was limited fluid flow into the HBL from the OB and UB.The temperature at the bottom of the sediment was higher than that in the upper part because of the geothermal gradient.
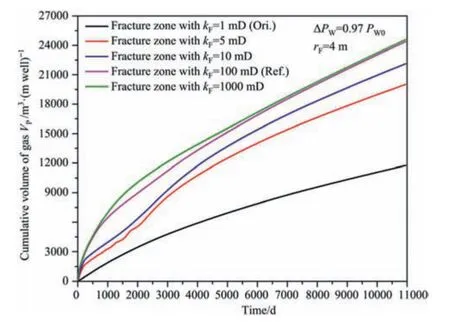
Fig.11.Sensitivity of gas production to kF.
4.3.Analysis of the dependent factors
4.3.1.Sensitivity to kF
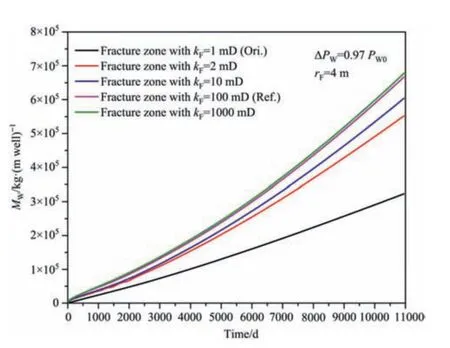
Fig.12.Sensitivity of water production to kF.
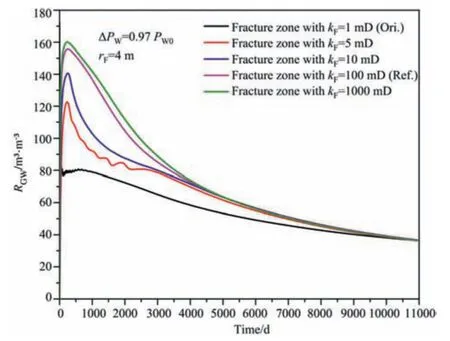
Fig.13.Sensitivity of the gas–to–water ratio to kF.
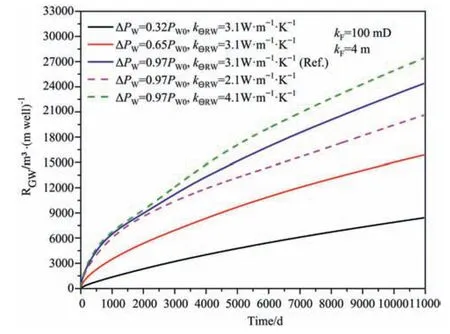
Fig.14.Sensitivity of gas production to ΔPW and K?RW.
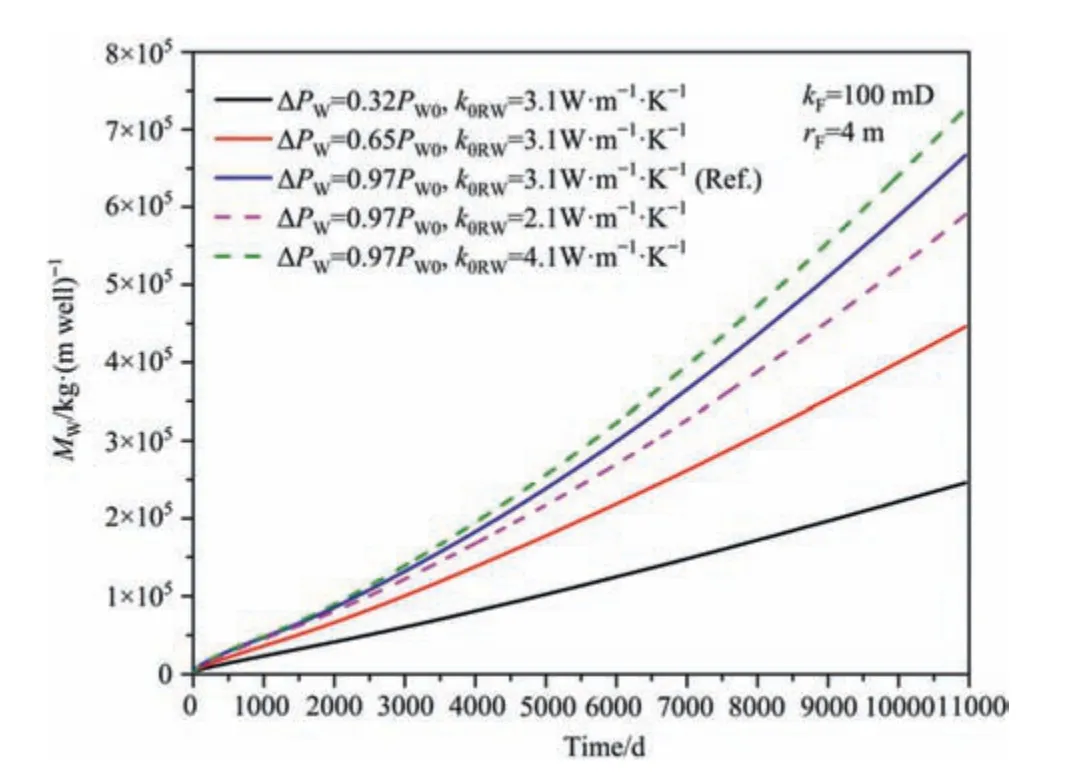
Fig.15.Sensitivity of water production to ΔPW and K?RW.
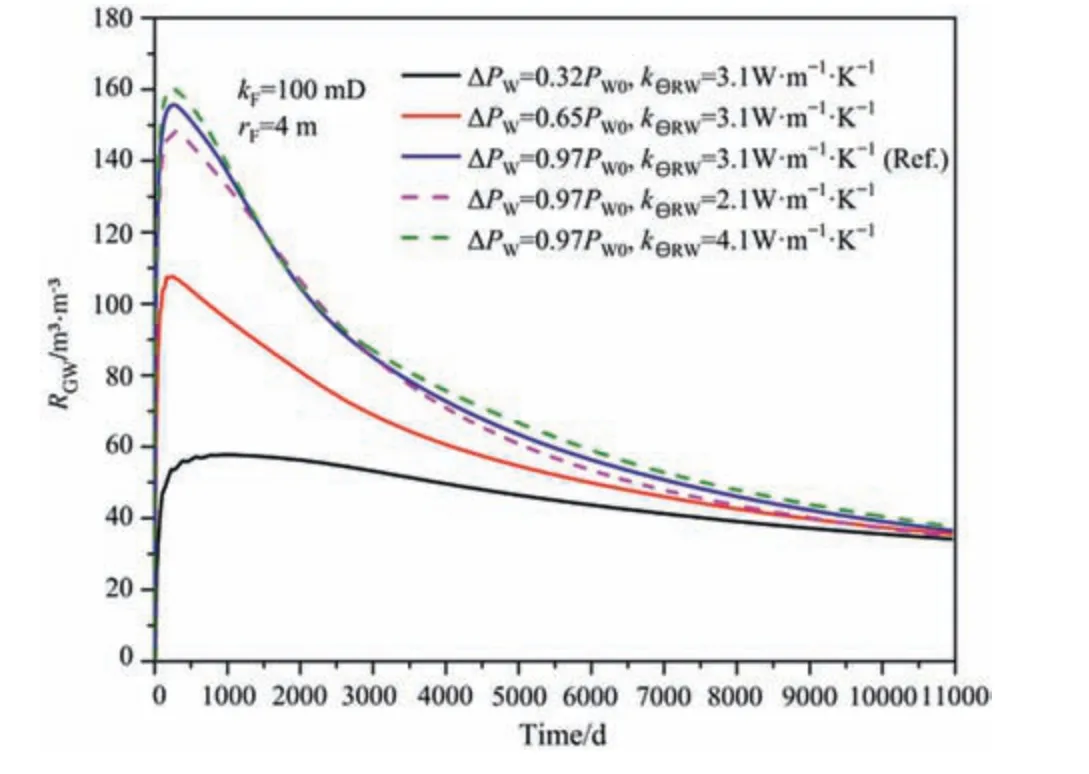
Fig.16.Sensitivity of the gas-to-water ratio to ΔPW and K?RW.
Figs.11–13 give the dependencies of kFon VP,MW,and RGW,respectively.The fracture zone with kF=1,5,10,100,and 1000 mD was used in each case under the same driving force ΔPW=0.97 PW0and circumferential radius rF=4 m.The VP,MW,and RGWall increased as the kFincreased from 1 to 1000 mD.As shown in Figs.11 and 12,the case of kF=5 mD,a very small expansion of kFcould result in a substantial increase in gas production and a relatively higher water production.When the kFwas greater than 100 mD,the influence on gas and water production was limited,which provided a practical guidance for the application of the fracturing technology.As shown in Fig.13,in each case,the RGWrapidly increased during the initial 200 days and then the RGWdecreased to a low level.The improvement in RGWcaused by rFwas mainly concentrated during the previous decade,similar to the case described for the evaluation of the production as previously mentioned.Hence,the increase in kFcould result in a better production performance.
4.3.2.Sensitivity to ΔPW
Figs.14–16 show the dependencies of ΔPWon VP,MW,and RGW,respectively.The fracture zone with rF=4 m,kF=100 mD and thermal conductivity K?RW=3.1 W·m–1·K–1was used in each case.When the ΔPWdecreased from 0.97 PW0to 0.32 PW0,both VPand MWsharply decreased.As shown in Fig.14,in the case ΔPW=0.32 PW0,the VPwas about 8.41×10³m3·m?1of well,only a third of that found in the reference case.However,it was near the result of 1.18×10⁴m3·m?1of well in the original case,indicating that the fracturing technology could effectively replace the effect of depressurization and reduce energy consumption.The reason for this result was that when a very high depressurization driving force was used,the ice produced was unfavourableunfavourable to the gas production of hydrate reservoir [45].The higher the driving force,the more ice produced.The ice produced mainly blocked the gas from entering into the production well.Therefore,once the rock near the production well was broken,the gas blocked by ice could enter into the production well smoothly,which promoted the further spread of depressurization pressure.As shown in Fig.15,the water production characteristics were similar to that of the gas production,the only difference was that the gas production rate gradually decreased and the water production rate gradually increased.A shown in Fig.16,RGWwas at a low level all the time,and the RGWincreased as the increase of the depressurization driving force.However,the effect of the depressurization driving force on RGWwas mainly in the first 20 years,mainly because the dissociation area was far away from the production well after this period.Hence,the gas production performance was more favourable under a higher depressurization driving force.
4.3.3.Sensitivity to K?RW
Figs.14–16 show the dependencies of the thermal conductivity K?RWon VP,MW,and RGW,respectively.The fracture zone with rF=4 m,kF=100 mD,and a driving force ΔPW=0.97 PW0was used in each case.In the reference case,as shown in Table 1,the K?RWof the fully saturated porous media used in this work was 3.1 W·m?1·K?1.As shown in Figs.14 and 15,VPand MWwere basically consistent in the three cases within 2000 days.Then,VPand MWincreased with the increase of the K?RW,but the fluctuation range was small.As shown in Fig.16,the RGWvalues in the three cases were basically equal.This result indicated that VPand MWwere not sensitive to K?RW,meaning that the heat conduction was not obvious during the hydrate dissociation.
5.Conclusions
In this work,the fracturing technology and depressurization method was combined to induce the gas production from the hydrate deposits at the site DK-2 in QTPP.Based on the simulation results,the following conclusions were drawn:
(1) The cumulative methane gas in the original case was nearly 1.18×10⁷m3in 30 years,and the cumulative gas production increased by 2.1 times as the rFincreased from 0 to 4 m.
(2) In the original case,only 26.3% of the gas production was produced during the first 10 years.However,greater than 51.7% of the gas production was produced during the first 10 years in the reference case.The RGWexceed 100 m3of gas/m3of water in initial 2000 days,much greater than the previous study in the Qilian Mountain permafrost hydrate deposits.
(3) VP,MW,and RGWall increased with the increase of the kF.When the kFgreater than 100 mD,the influence of the increase of the kFon production was limited.
(4) The gas production performance was more favourable with a larger depressurization driving force.Also,the RGWincreased as the increase of the depressurization driving force.However,the effect of the depressurization driving force on RGWwas mainly in the first 20 years,mainly because the dissociation area was far away from the production well after this period.
(5) The VPand MWwere not sensitive to K?RW,which indicated that the effect of heat conduction on gas production was not obvious during the hydrate dissociation.
(6) The effect of ice production on gas production by fracturing technology and depressurization method was limited.That was,fracturing technology could effectively reduce the influence of ice production on gas production.
Declaration of Competing Interest
The authors declare that they have no known competing financial interests or personal relationships that could have appeared to influence the work reported in this paper.
Acknowledgements
The authors are very grateful for the support of the Key Program of National Natural Science Foundation of China (51736009),National Natural Science Foundation of China(51676196,51976228),Guangdong Special Support Program(2019BT02L278),Frontier Sciences Key Research Program of the Chinese Academy of Sciences (QYZDJSSW-JSC033,QYZDB-SSW-JSC028,ZDBS-LY-SLH041),Science and Technology Apparatus Development Program of the Chinese Academy of Sciences (YZ201619),the National Key R&D Program of China(2017YFC0307306),and Special Project for Marine Economy Development of Guangdong Province (GDME-2018D002,GDME-2020D044),which are gratefully acknowledged.
Nomenclature
G1thermal gradient within the frozen layer,°C·m?1
G2thermal gradient under the frozen layer,°C·m?1
H permafrost thickness,m
ΔHccombustion enthalpy of produced methane,J
kFintrinsic permeability of the fracture zones,m2
keffeffective permeability,m2
krAaqueous relative permeability,m2
krGgas relative permeability,m2
kΘCthermal conductivity,W·m?1·K?1
kΘRDthermal conductivity of dry porous medium,W·m?1·K?1
kΘRWthermal conductivity of fully saturated porous medium,W·m?1·K?1
kΘIthermal conductivity of ice,W·m?1·K?1
MWcumulative mass of produced water,kg
P pressure,Pa
PBinitial pressure at base of HBL,Pa
P0atmosphere pressure,Pa
PWpressure at the well,Pa
ΔPWdriving force of depressurization,PW0?PW,Pa
PW0initial pressure at the well,Pa
r radius,m
RGWgas-to-water production ratio(m3of CH4/m3of H2O)
S phase saturation
T temperature,°C
T0permafrost ground temperature,°C
TBinitial temperature at the base of HBL,°C
t time,d
VPcumulative volume of produced CH4,m3
XSsalinity
Δx discretization along the x-axis,m
Δy discretization along the y-axis,m
Δz discretization along the z-axis,m
φ porosity
λ van Genuchten exponent—Table 1
Subscripts
0 denotes initial state
A aqueous phase
B base of HBL
cap capillary
F fracture zone around the production well
G gas phase
H solid hydrate phase
IrA irreducible aqueous phase
irG irreducible gas
n permeability reduction exponent—Table 1
nG gas permeability reduction exponent—Table 1
OB overburden
S salinity
UB underburden
W well
 Chinese Journal of Chemical Engineering2021年6期
- Chinese Journal of Chemical Engineering的其它文章
- Effects of coagulation-bath conditions on polyphenylsulfone ultrafiltration membranes
- Functional monodisperse microspheres fabricated by solvothermal precipitation co-polymerization
- Synthesized graphene oxide and fumed aerosil 380 dispersion stability and characterization with partially hydrolyzed polyacrylamide
- Synthesis and characterization of caprolactone based polyurethane with degradable and antifouling performance
- Removal of lead (Pb(II)) and zinc (Zn(II)) from aqueous solution using coal fly ash (CFA) as a dual-sites adsorbent
- Catalytic performance improvement of volatile organic compounds oxidation over MnOx and GdMnO3 composite oxides from spent lithium-ion batteries:Effect of acid treatment