Velocity-porosity relationships in hydrate-bearing sediments measured from pressure cores, Shenhu Area, South China Sea
Lin Lin , Jun Co, Jin Qin, Jiu-jing Shng Wei Zhng Jin-gn Lu Jin-qing Ling
a Guangzhou Marine Geological Survey, China Geological Survey, Ministry of Natural Resources, Guangzhou 510760, China
b Southern Marine Science and Engineering Guangdong Laboratory (Guangzhou), Guangzhou 511458, China
c Institution of Oceanology, Chinese Academy of Sciences, Qingdao 266071, China
Keywords:
Natural gas hydrates (NGHs)
Methane hydrate
P-wave velocity
Porosity
Saturation
Pressure-core
NGHs exploration trial engineering
Oil and gas exploration engineering
Shenhu Area
South China Sea
A B S T R A C T
Evaluating velocity-porosity relationships of hydrate-bearing marine sediments is essential for characterizing natural gas hydrates below seafloor as either a potential energy resource or geohazards risks.Four sites had cored using pressure and non-pressure methods during the gas hydrates drilling project (GMGS4) expedition at Shenhu Area, north slope of the South China Sea.Sediments were cored above, below, and through the gas-hydrate-bearing zone guided with logging-while-drilling analysis results.Gamma density and P-wave velocity were measured in each pressure core before subsampling.Methane hydrates volumes in total 62 samples were calculated from the moles of excess methane collected during depressurization experiments.The concentration of methane hydrates ranged from 0.3% to 32.3%.The concentrations of pore fluid (25.44% to 68.82%) and sediments (23.63% to 54.28%) were calculated from the gamma density.The regression models of P-wave velocity were derived and compared with a global empirical equation derived from shallow, unconsolidated sediments data.The results were close to the global trend when the fluid concentration is larger than the critical porosity.It is concluded that the dominant factor of P-wave velocity in hydrate-bearing marine sediments is the presence of the hydrate.Methane hydrates can reduce the fluid concentration by discharging the pore fluid and occupying the original pore space of sediments after its formation.
1.Introduction
Natural gas hydrates remain stable at relatively high pressure and low temperature.Since the 18thcentury,researchers have found that chlorine, sulfur dioxide, and other gases can form hydrates in the laboratory (Sloan ED and Koh CA, 2007).Natural gas hydrates in the natural environment were first discovered in the 1960s.Since then, there have been more and more studies on natural gas hydrates from the aspects of resources and environment (Collett TS et al., 2009;Chong ZR et al., 2016).
Natural gas hydrates are mainly found in marine sediments and permafrost.For the natural gas hydrates distributed in the marine environment, it is very important to understand itsin-situoccurrence states, not only to evaluate its energy potential but also to assess its possible environmental impact and geological hazard risk.The conventional drilling and coring technology are difficult to maintain the pressure and temperature of the sediments.Therefore, pressure coring technology is developed for these research requirements (Liu LL et al., 2021).The early applications are mainly used in the nature gas hydrates related research projects of the Ocean Drilling Program (ODP) and the hydrates investigation projects in the Gulf of Mexico and Nankai area of Japan (Tréhu AM et al., 2006; Abegg F et al.,2008).It is also one of the essential research methods in the gas hydrate reservoir evaluation and trial production conducted in China, Japan, and the United States recently.
But pressure coring was applied in only a few areas of the world due to its high cost.For the marine natural gas hydrates investigation and research, indirect measurement techniques based on geophysics are more common, in which acoustic detection (including borehole logging and seismic, etc.) is one of the main methods.Therefore, in-depth studies of the acoustic response of near-seafloor hydrates-bearing sediments are very helpful to accurately evaluate thein-situcharacteristics of gas hydrates.
At present, the effective media model proposed by Helgerud MB et al.(1999) and the improvements based on this model (Sava D and Hardage BA, 2009) are commonly used for unconsolidated marine natural gas hydrate-bearing sediments (Zhong GF et al., 2020).Although this kind of model is not like the ones based on the Biot-Gassmann equation (Lee MW and Waite WF et al., 2008), which needs to correct the empirical coefficient for different regions.But it needs parameters such as mineral component content to construct the matrix moduli, which still limits effective media models to evaluate gas hydrate reservoir based on conventional measurement data such as acoustic logging.
This paper attempts to use the data of pressure coring samples from the Shenhu Area in the north slope of the South China Sea to analyze the main factors affecting the acoustic velocity of hydrate-bearing sediments, and discuss their microscopic occurrence state.By comparing the data with the empirical model proposed by Erickson SN and Jarrard RD(1998), the authors suggested that the empirical model can be used to evaluate gas hydrates saturation under a lowsaturation condition.
2.Material and methods
2.1.Geological and survey background
The Shenhu Area is located in the continental slope of the northern South China Sea, south of the Pearl River estuary,covering the southern part of the Pearl River Mouth Basin.It is one of the earliest investigations areas of gas hydrates in China (Zhang HT et al., 2007; Su PB et al., 2021; Zhang XD et al., 2021).
In 2016, China Geological Survey undertook a gas hydrate drilling project (GMGS4) in the northern South China Sea and carried out pressure coring samples of nature gas hydrates at four sites in the Shenhu Area.Among them, Site 7 is located at the upper edge of the continental slope ridge,which has a relatively shallow water depth (< 1000 m ).While Sites 1, 2, and 3 are located in the area with relatively deepwater depth in the south (1200-1400 m; Fig.1).The distance between Site 1 and Site 2 is about 1 km, and the distance between other stations is about 5-10 km.

Fig.1.Location of pressure-core recovered sites at Shenhu Area during GMGS4.
The coring procedure is planned based on the analysis results of logging-while-drilling (LWD).LWD data is used to evaluate the depth interval of the natural gas hydrates layer at each site, and then pressure and non-pressure coring tools were used to recover samples as completely and continuously as possible from both within and outside the interpreted hydrate-rich-zones to conduct a comprehensive formation evaluation.
The distance between the actual position of coring boreholes and LWD evaluating boreholes is kept within 10 m to 25 m.According to the analysis results of LWD, the thickness of the gas hydrate layer in Site 1 is about 23 m(145-168 mbsf).Site 2 is about 30 m (140-170 mbsf).Site 3 is about 90 m (129-219 mbsf), and Site 7 is about 35 m(121-156 mbsf).Taking these layers as the target, pressure and non-pressure cores are recovered, which confirms the occurrence of structure-II gas hydrates (Zhang W et al.,2019).Based on the evaluated results, Site 3 was finally selected as the first marine gas hydrate resources production test target in China (Li JF et al., 2018).
2.2.Analysis procedure of pressure cores
The pressure coring equipment is the Pressure Core Analysis and Transfer System (PCATS) developed by Geotek(Schultheiss P et al., 2011, 2017), which is widely used in the investigation and research of natural gas hydrate in recent years (Abid K et al., 2015).PCATS can obtain a pressure core with a maximum length of 3.5 m and can be transferred to the analysis system for gamma density, acoustic velocity, triaxial stress measurement, and X-ray scanning imaging.After the completion of the above tests, the hydrate-bearing layer range can be determined and a plan of the subsampling process can be made.A total of 24 pressure cores were obtained from all four sites, and 62 of the sub-samples were cut for quantitative degassing.
Fig.2 shows the measurement results of gamma density and acoustic velocity of a pressure core at Site 1, coded as 05A, with a sampling distance of 0.01 m.As a comparison,the vertical measurement distance of LWD is about 0.1524 m.The LWD evaluations of Site 1 shows that the depth of the hydrate layer ranges from 145 m to 168 m below the seafloor,and the core sample 05A is close to the top of the hydrate layer (147.0-148.7 mbsf), and gas hydrates is almost distributed in the whole sample.
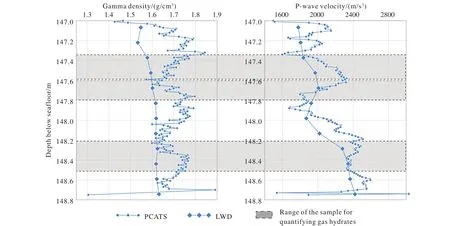
Fig.2.Gamma density and P-wave velocity measured by PCATS for core 05A at Site 1, and LWD results from the same interval.
The gamma density and acoustic velocity measured from the pressure core are close to the results of LWD, and the overall trend is consistent.One possible reason for the differences is the distance of LWD boreholes and coring boreholes ( >10 m).Other influential aspects are the differences between the two measurement methods and the environment of the measurements.
Sample 05A is divided into eight sections according to core scanning and measurements.The very upper and lower ends are usually not suitable for quantitative degassing, so three sections in the middle are taken, and the remaining samples are stored in liquid nitrogen as planned.Other pressure cores are also treated following this procedure.
2.3.Quantifying methane hydrates
The quantity of gas hydrates can be calculated indirectly by measuring the change of salinity in porewater after gas hydrate decomposition in the non-pressure core samples(Malinverno A et al., 2008).For pressure cores, a more direct measurement can be used (Collett TS et al., 2009; Yun TS et al., 2011).
Step-by-step depressurization allows the gas hydrates to decompose slowly and controllably.Gas collected during depressurization was analyzed using the onboard gas chromatograph to determine the composition of the gas released.The total released volume of methane and other hydrate-forming gases was determined by measuring the volume of gas expelled from the system and adding the volume of methane remaining in the system.Before calculating the concentration of methane hydrates, the total methane volume should be subtracted by the maximum dissolved amount of methane in the pore water asin-situconditions.
The maximum solubility of methane in pore water is calculated usingin-situtemperature, pressure, and salinity data according to the method given by Tishchenko P et al.(2005).Following their method, methane phase equilibrium curves at different depths at four sites can be drawn (Fig.3),from which it can be judged whether there is enough methane in the sample to exist in the form of methane hydrate before depressurization.

Fig.3.Methane phase diagrams of all four sites used to identify the possible status of pressure-core samples.
The theoretical molecular weight (124 g/mol) and density(0.91 g/cm3) of pure methane hydrate are used to estimate the volume of methane hydrate in the sample.The saturation of methane hydrate is obtained by dividing the pore volume of the sample, and the concentration of methane hydrate is obtained by dividing the total volume of the sample.
2.4.Calculating concentration of pore-fluid and sediments
The authors assume that in addition to methane hydrate,the main components in the core are only pore-fluid and sediments.The concentration of methane hydrate in the pressure sample has been measured and calculated as mentioned above, and the pore-fluid and sediments concentration can be calculated from gamma density measurement.If ρmis the average gamma density of the sample, there are:

The concentration and density of each component are noted as ρ and φ, the subscripth,f, andsrepresent hydrate,pore-fluid, and sediments respectively.
From the arrangement of (1), it can get:

Referring to the values commonly used in literature, the densities of hydrate, pore-fluid, and sediments are 0.92 g/cm3,1.024 g/cm3, and 2.7 g/cm3, respectively.The concentration of hydrate is known, and the above formula can be used to calculate the concentration of pore-fluid and sediments.
3.Results
3.1.Concentration of the components
The calculation above assumes that the guest molecule in the hydrate is dominated by methane (structure I gas hydrate),and any methane present beyond dissolved methane saturation was assumed to be in a methane hydrate phase or a free gas phase, depending on the calculated phase boundaries.By comparing the methane phase diagram with the total methane measurement results (Fig.3), it is found that there are some samples from the bottom of Sites 1, 2, and 3 that are under the stable region of methane hydrate, which does not conform to the assumption.In order to ensure the rationality of the subsequent analysis, the calculated results of seven samples that do not meet this assumption are excluded, and the calculated concentration of another sample is 0, which is also not included in the final result.
Fig.4 and Table 1 show a total of 54 validated results.It can be seen that the average concentration of the methane hydrates in Sites 1, 2, and 3 are similar, while the highest on average is Site 7.Other sites show strong heterogeneity of the methane hydrates concentration, except for Site 3.
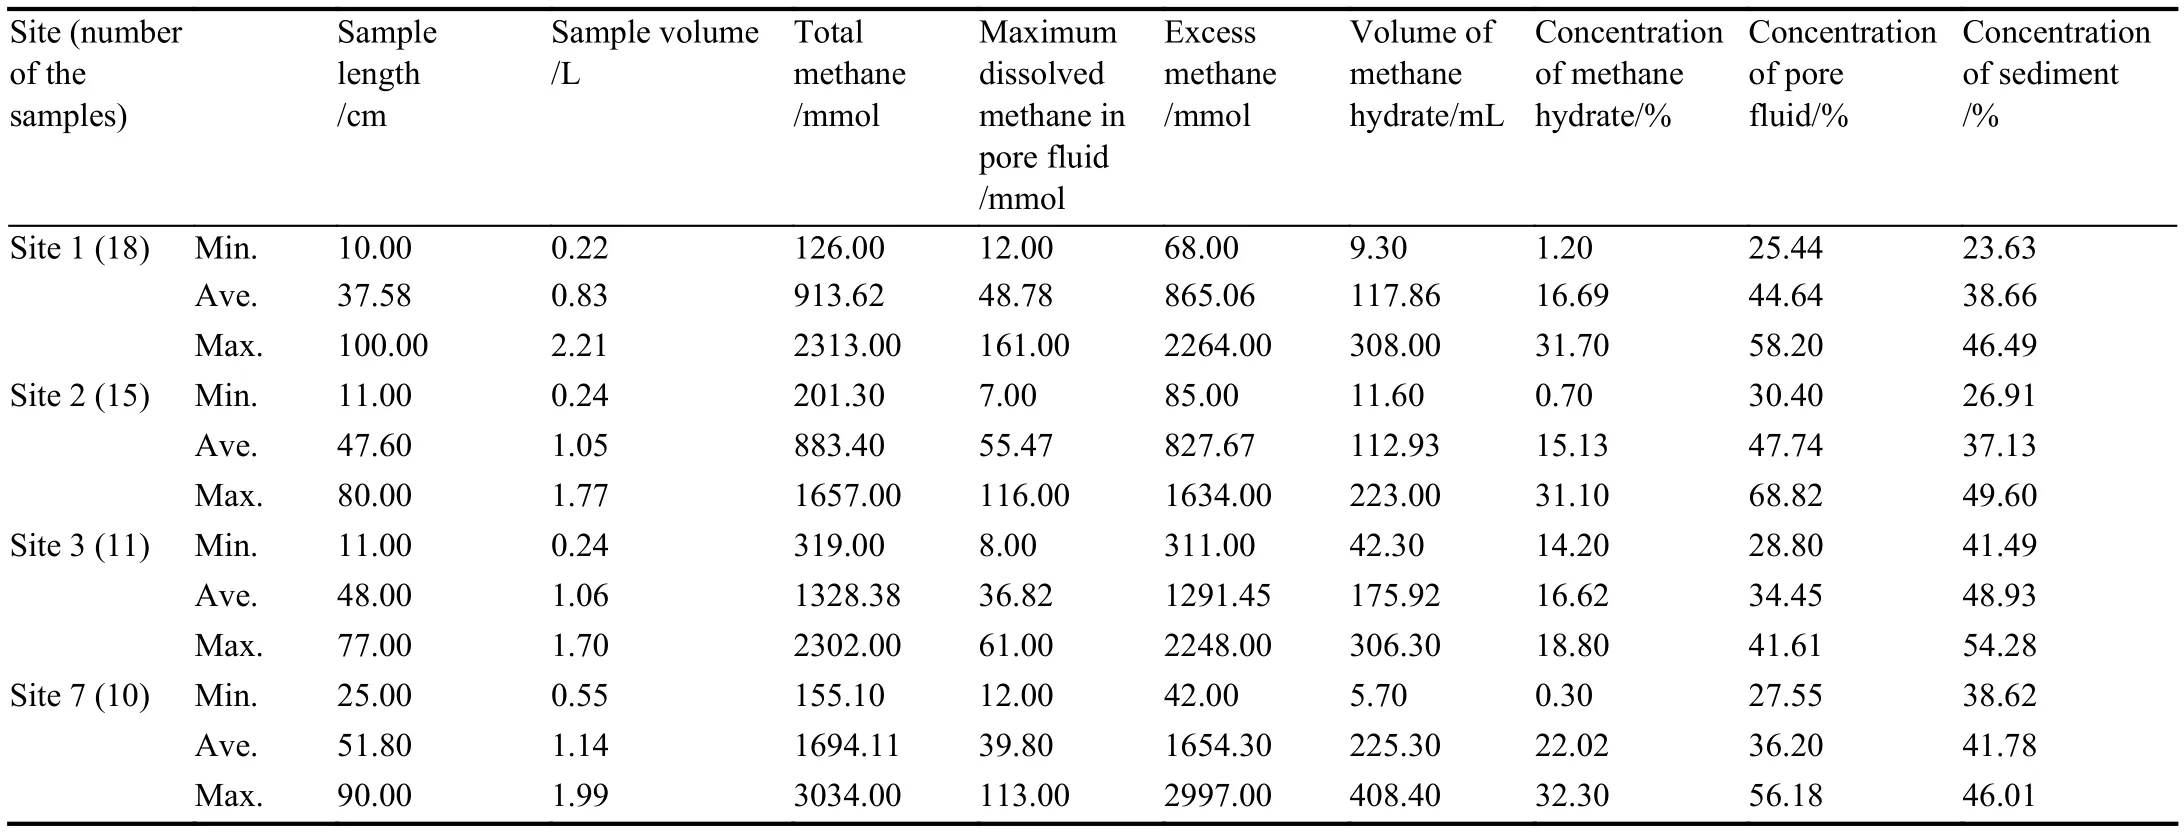
Table 1.Statistic table of pressure-core samples measurements.
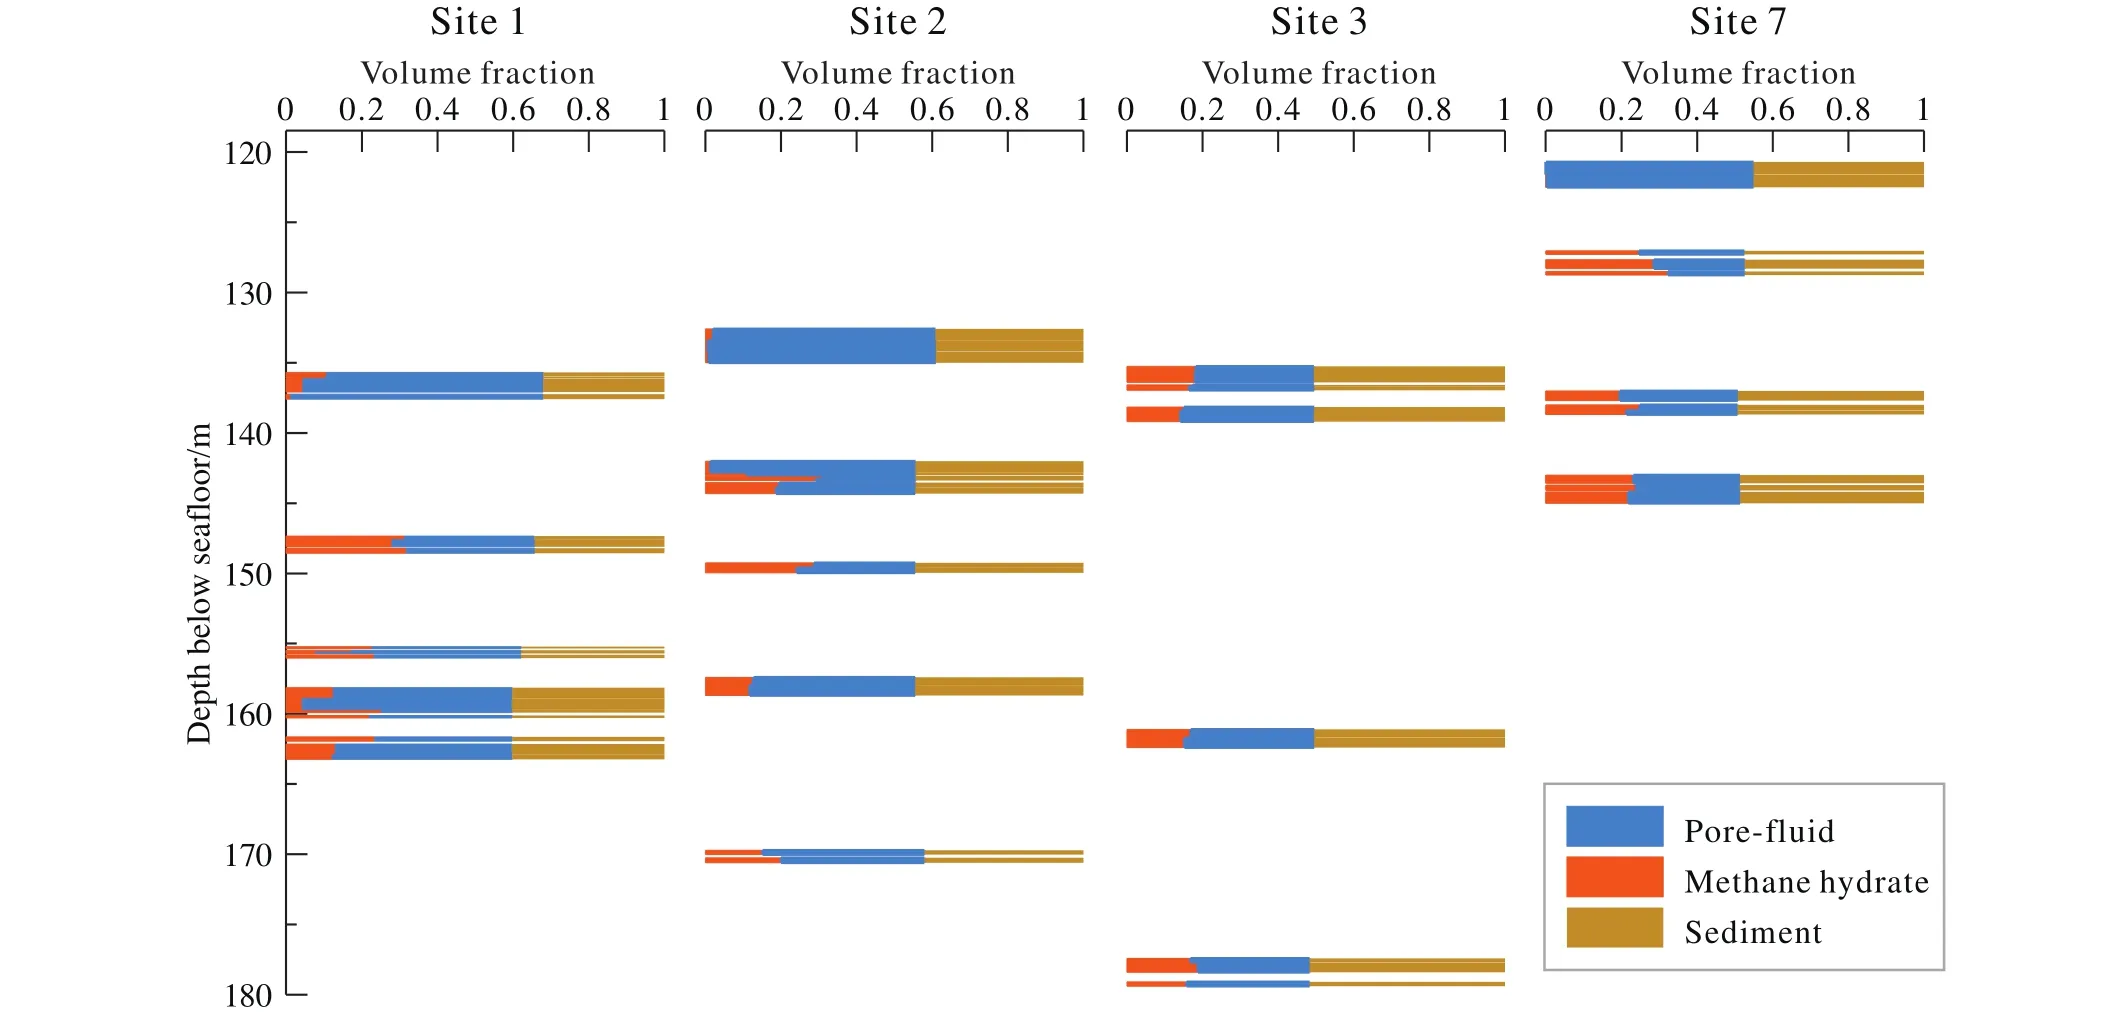
Fig.4.The concentration of methane hydrates, pore water, and sediments measured and calculated from pressure-core samples.
3.2.Relationships between P-wave velocity and each component
The spatial resolution of gamma density andP-wave velocity measured from pressure cores may be high enough to reflect the difference of hydrate occurrence in micro-scale.However, the methane hydrates concentration of the subsample can only be obtained through the depressurization experiment.To investigate its effect on theP-wave velocity,the averageP-wave velocity of each sub-sample is calculated,and the relationship between it and the concentration of each component is drawn in Fig.5.In addition, the correlation coefficient between each component concentration andP-wave velocity is shown in Table 2.
The correlation coefficients between the concentration of pore-fluid and methane hydrate andP-wave velocity are relatively high, indicating that in the unconsolidated hydratebearing sediments, theP-wave velocity is mainly controlled by pore-fluid and hydrates.And there is no obvious relationship between sediments concentration and P-wave velocity.
The average concentration of sediment in the samples at each site is about 37%-42%, which tends to increase slightly with the increase of depth (Fig.4), indicating that the unconsolidated hydrate-bearing sediments in the Shenhu area are generally in a normal compacted state.The formation of gas hydrates has no obvious effect on it, and most of the gas hydrates are formed and dispersed in the pore space of the original sediments.This is also consistent with the direct observation of the core (Wei JG et al., 2018).But its effect on the overall acoustic response of the sediments is significant,and there is an almost linear relationship between the concentration of the gas hydrates andP-wave velocity (Fig.5b).The regression result is slightly better using the secondorder polynomial fitting, which is:

withR2=0.764, and Root Mean Square Error (RMSE) =108.4.
There is also a strong correlation between P-wave velocity and the concentration of the pore fluid (Fig.5c; Table 2).A fitting with aRMSEof 153.2 can be obtained by using the nonlinear regression method.

Table 2.Correlation coefficients between the concentration of each component and P-wave velocity.

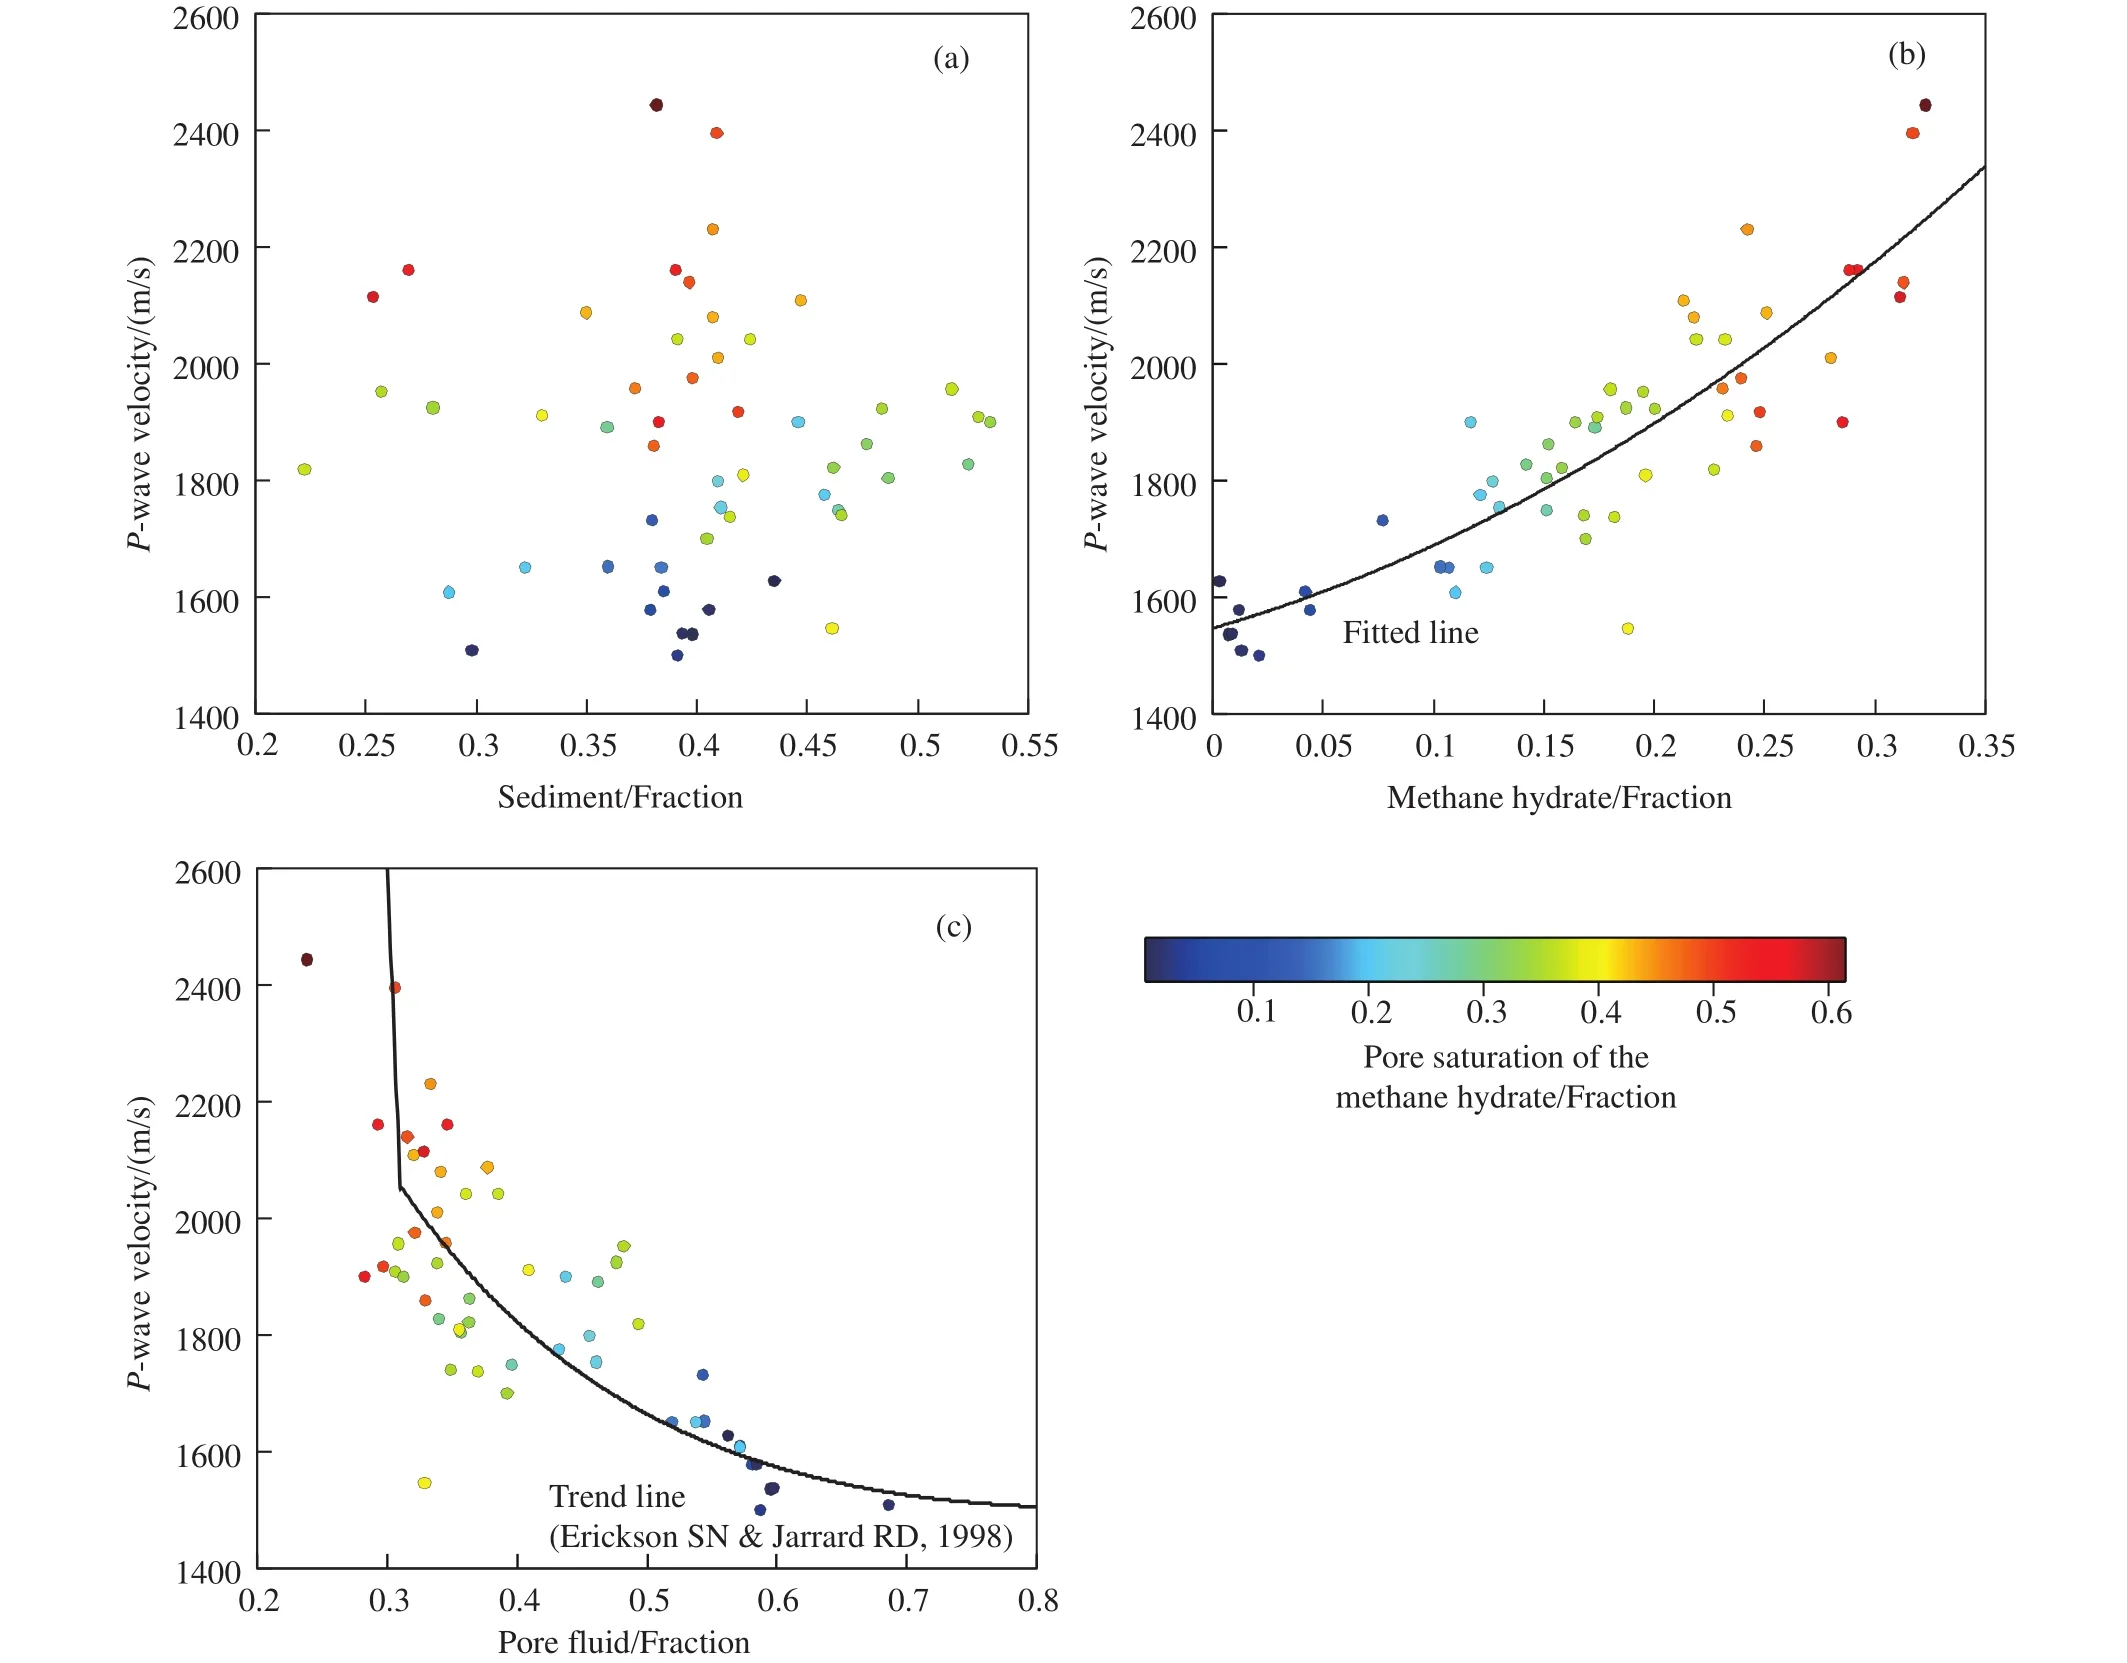
Fig.5.Cross plot of P-wave velocity and concentration of sediments (a), methane hydrates (b), and pore-fluid (c).Color represents the methane hydrates saturation of pore space.
An obvious abnormal sample can be found in the cross plot (Figs.5b, c).Its averageP-wave velocity is significantly lower (1547.6 m/s), but the concentrations of hydrate and fluid are 18.8% and 30.9%, respectively, which are confirmed to be caused by abnormal measurements.The sample has been removed before the fitting process.
4.Discussion
Leveraged by a detailed statistical analysis of ODP data from Amazon Fan, Erickson SN and Jarrard RD (1998) found that porosity is the main variable affecting theP-wave velocity in shallow unconsolidated sediments and that compaction and cementation affect the velocity indirectly through the change of porosity.The second variable is pressure, after controlling the porosity, theP-wave velocity still tends to increase with the buried depth, indicating that pressure is another influencing factor.Velocities of siliciclastic sedimentary rocks decrease rapidly with both increasing porosity and increasing clay content.But they found that clay content had no significant effect on velocity when the porosity was greater than the critical porosity.On the basis of these understandings, they use a large number of measured data to calculate a global empirical relationship between velocity and porosity of water-saturated and unconsolidated siliceous clastic sediments which are shown below.

whereVshis shale fraction.
The unconsolidated sediments in the shallow formation of the Shenhu Area are mainly fine-grained silty clay, rich in foraminifera (Su M et al., 2015).And the clay content of the hydrate-bearing zone is about 0.69%-1.03% (Li J et al.,2019).Therefore, the predicted velocity-porosity trend was calculated using Eq.5,Vsh= 0.01 to compare with the measured data from pressure cores (Fig.5c).It can be seen from the cross plot that there is a trend between the velocity and the pore fluid concentration and the trend of the measured data matches the empirical relationship, especially at the part where pore fluid concentration is larger than the critical porosity.Erickson SN and Jarrard RD (1998) proposed the global empirical relationship by combining multiple data sets and considered it to be widely applicable, which is also supported by the Shenhu data used in this article.
When the porosity is greater than the critical porosity, the fluid phase is load-bearing (Mavko G et al., 2009).Therefore,the influence of different types of sediment particles in different regions onP-wave velocity is less, the fluid content and formation pressure become the main factors affecting the velocity, which may be the physical basis for the wide applicability of the empirical relationship.
This inspires the authors to use this empirical relationship to estimate hydrate saturation.Let φtbe the original porosity of the sediments before gas hydrates formation, because the density of gas hydrate is close to the seawater, the measured gamma density is often used to calculate the φt:

where ρgammais the gamma density of samples, ρgrainandρfluidare the density of the matrix and the fluid.
The gas hydrates occupy part of the space filled by the original pore fluid, after the formation of hydrate, the actual content of the pore fluid should be:

The saturation of the hydrates in the poreSMHcan be estimated by using Eq.5-Eq.7.The results are close to the measured data at the low saturation condition (Fig.6).TheRMSEof predicted and measured saturation is 0.1366, and theR2is 0.0913.
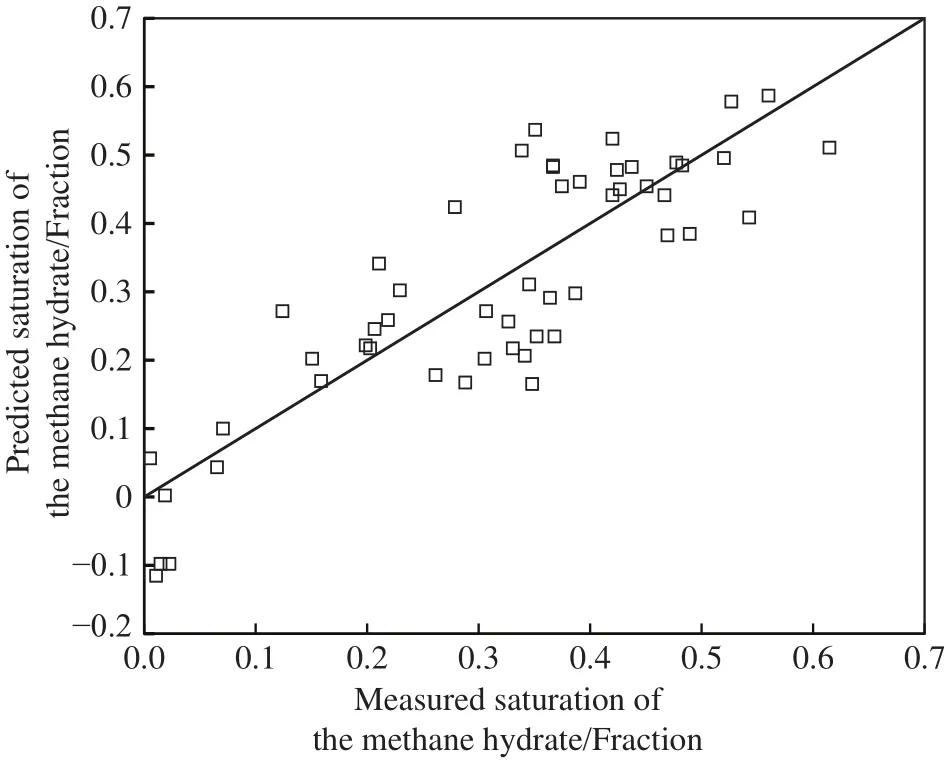
Fig.6.Comparison between the predicted saturation of the methane hydrates and the measured data.
In the effective medium model of Helgerud MB et al.(1999), the lower bound of Hashin-Shtrikman is used to characterize the case above the critical porosity, and the effects of pore and matrix geometry are also omitted.The empirical relationship further omits the elastic parameters of each component and only considers the content of each component, which brings convenience to the application and does not lose much accuracy when appropriate.
In some literature, “pore filling” and “fracture filling” are often used to distinguish the natural occurrence state of natural gas hydrate in marine sediments.through the above discussion, it can be considered that pore fluid should be higher than the critical porosity in most of the “pore filling”cases.The “fracture filling” usually refers to the existence of hydrate visible in the sample, which has occupied most of the pore space of the sediment, and even occupied the original space of the sediment particles when the concentration of hydrate exceeds the original porosity.In this case, the influence factors ofP-wave velocity are more complex, and it will be difficult to accurately characterize the acoustic response of the hydrate-bearing sediments only by using the concentration of each component.Therefore, it is difficult to use acoustic measurement data to accurately predict the concentration of the hydrate in such a case.
5.Conclusion
In this article, the concentrations of methane hydrate, pore fluid, and sediment are calculated using the measured data of pressure core samples in the Shenhu Area, and ranged from 0.3% to 32.3%, 25.44% to 68.82%, 23.63% to 54.28% separately.The effects of each component on the acoustic velocity of the hydrate-bearing sediments are analyzed, and the regression models have been derived.The results show that the gas hydrates are mainly dispersed in the pore, and the concentration of hydrate is the main influencing factor of the acoustic velocity.
When the saturation of gas hydrates is low that the pore fluid content is still higher than the critical porosity, there is a strong correlation between theP-wave velocity and the pore fluid concentration, indicating that the fluid is still loadbearing in the near-seafloor unconsolidated sediments containing natural gas hydrates in such condition.Therefore,the data of the Shenhu Area match well with the empirical relationship proposed by Erickson SN and Jarrard RD (1998).Based on this, the authors use the empirical relationship to calculate the gas hydrate saturation.Compared with the measured data, it is considered that this method can evaluate the seafloor sediment porosity and gas hydrate saturation properly under appropriate conditions.
CRediT authorship contribution statement
Lin Lin and Jun Cao conceived of the presented idea.Lin Lin performed the computations.All authors analyzed the data, discussed the results, and contributed to the final manuscript.
Declaration of competing interest
The authors declare no conflicts of interest.
Acknowledgment
This research was jointly supported by the National Natural Science Foundation of China (42076072), the project of China Geological Survey (DD20160211), and the Key Special Project for Introduced Talents Team of Southern Marine Science and Engineering Guangdong Laboratory(Guangzhou, GML2019ZD0506).The authors thank the guest editor Xu-wen Qin and anonymous reviewers for their indepth reviews and comments which greatly improved this manuscript.
- China Geology的其它文章
- China achieved fruitful results in oil-shale gas-coalbed methane exploration and development in 2021
- Formation mechanism, experimental method, and property characterization of graindisplacing methane hydrates in marine sediment: A review
- Molecular simulation studies on natural gas hydrates nucleation and growth: A review
- Distributed optical fiber acoustic sensor for in situ monitoring of marine natural gas hydrates production for the first time in the Shenhu Area, China
- Experimental investigation of hydrate formation in water-dominated pipeline and its influential factors
- Stability analysis of seabed strata and casing structure during the natural gas hydrates exploitation by depressurization in horizontal wells in South China Sea

