Experimental investigation of hydrate formation in water-dominated pipeline and its influential factors
Li Huang , Jia-le Kang , Xiao-ong Shen, Jian-ye Sun Qing-guo Meng Qiang Chen Gaowei Hu *, Chang-ling Liu Neng-you Wu
a Key Laboratory of Gas Hydrate, Ministry of Natural Resources, Qingdao Institute of Marine Geology, China Geological Survey, Ministry of Natural Resources, Qingdao 266071, China
b Laboratory for Marine Mineral Resources, Pilot National Laboratory for Marine Science and Technology, Qingdao 266071, China
c College of Marine Science and Technology, China University of Geosciences, Wuhan 430074, China
d State Key Laboratory of Oil and Gas Reservoir Geology and Exploitation, Chengdu University of Technology, Chengdu 610059, China
1 Both authors contributed equally to the paper
Keywords:
Pipeline
Water production
Circulation
Gas hydrate
Formation morphology
Gas concentration
Flowrate
NGHs exploration trial engineering
Oil and gas exploration engineering
Shenhu Area
South China Sea
A B S T R A C T
Blockage in water-dominated flow pipelines due to hydrate reformation has been suggested as a potential safety issue during the hydrate production.In this work, flow velocity-dependent hydrate formation features are investigated in a fluid circulation system with a total length of 39 m.A 9-m section pipe is transparent consisted of two complete rectangular loops.By means of pressurization with gas-saturated water, the system can gradually reach the equilibrium conditions.The result shows that the hydrates are delayed to appear as floccules or thin films covering the methane bubbles.When the circulation velocity is below 750 rpm, hydrate is finally deposited as a “hydrate bed” at upmost of inner wall, narrowing the flow channel of the pipeline.Nevertheless, no plugging is observed during all the experimental runs.The five stages of hydrate deposition are proposed based on the experimental results.It is also revealed that a higher driving pressure is needed at a lower flow rate.The driving force of hydrate formation from gas and water obtained by melting hydrate is higher than that from fresh water with no previous hydrate history.The authors hope that this work will be beneficial for the flow assurance of the following oceanic field hydrate recovery trials.
1.Introduction
With the maturing of production technology of oceanic hydrate deposits, a growing number of countries are trying to conduct the field hydrate recovery tests under the sea.The flow assurance during the hydrate recovery has become one of the focal problems, and it’s also a key factor to determine the success of oceanic gas hydrate production trails (Li CJ et al.,2016; Palermo T et al., 2017; Srivastava V et al., 2017).Nowadays, one of the prevailing production methods to dissociate gas hydrate is depressurization, which is also the only method employed during the China’s and Japan’s field oceanic hydrate production tests (Li CJ et al., 2016;Yamamoto K et al., 2017; Konno Y et al., 2017).Gas and water, as the two-phase products, would be respectively produced from drill pipe (gas production) or subsea choke line(fluid production) after separation during the hydrate dissociation process (Matsuzawa M et al., 2014).However,due to the limited separation efficiency, there would be some gases left in the choke line.Then gas hydrate can be regenerated when the temperature and pressure come into an available condition, resulting in an increasing risk of hydrate plugging (Hill T et al., 2010; Turner D and Grasso G, 2017).On the other hand, with the development of oil/gas reservoirs production, it will also become a high water cut system.Therefore, the investigation of flow assurance in a high water cut system is of particular importance no matter for gas hydrate or oil/gas production.
Current studies of the flowloop system are mainly focused on the multi-phase flow of water, oil and gas (Sum AK et al.,2009; Boxall J et al., 2009; Davies SR et al., 2010; Shi BH et al., 2011; Gong J et al., 2013).The mechanisms of hydrate blockage vary in different water cut systems.The whole hydrate deposition process in low water cut (oil-dominated)system can be divided into four stages, i.e., water entrainment,hydrate growth, agglomeration and plugging (Turner D, 2005;Zerpa LE et al., 2012).In the water entrainment stage, the temperature and pressure have not reached the equilibrium condition.It is a gas-water-oil mixed flow in this stage.And there are some water droplets wrapped in the continuous oil phase because of the shear force of the flow.Gas hydrates form as thin shell interfaces between the oil and the inner water droplet once the system reaches the available conditions.Afterwards, the viscosity of the flow increases as the hydrate-shelled water droplets aggregate to a cluster.When the hydrates accumulate to a certain degree, it can evolve to a blockage in the end.Joshi et al.studied a high water-cut mixed flow and reported that the hydrate formation process can be described as three distinguishing stages, i.e.,homogeneous flow, heterogeneous flow and bedding formation (Joshi SV et al., 2013).As the system temperature decreases, gas hydrates can be formed at the interface between the water and free gas and the hydrates distribute evenly among the water phase.When the concentration of formed gas hydrate reaches a certain value called transition concentration, the hydrate particles become unevenly distributed in the flow.As more hydrate particles aggregate,there would be a hydrate bed accumulated in the inner wall during the third stage.
Moreover, Joshi et al.’s results revealed that both the liquid loading and the salinity of the solution have no effect on the maximum hydrate transition concentration.It only increases with the increasing velocity of mixture flow.Tang CP et al.performed similar experiments and found that gas hydrates could be formed as three macrostructures: Slurrylike, sludge-like and their transition (Tang CP et al, 2017).The formed gas hydrates are reported to accumulate as the blockage when the initial pressure is 8 MPa and the water conversion percentage is 7% in their study.Andersson and Gudmundsson measured the mixed flow in both laminar and turbulent flow after the gas hydrate formed (Andersson V and Gudmundsson JS, 2006).It showed that the flow is homogenous in the laminar system and the effective viscosity would increase with the increasing hydrate concentration(<13 vol.%).Meanwhile, the hydrate concentration has no effect on the viscosity in the turbulent regime.The pressure drop in the study is explained as the migration of hydrate particles away from the wall.And this is similar to that of icewater system.Sakurai S et al.investigated the gas hydrate formation and accumulation in different flow systems in the transparent pipeline with 8-mm inner diameter (Sakurai S et al., 2014).It was observed that there would be a thin hydrate formed near the corner.However, no plugging would occur in the experiments, which is consistent with the results in the world’s first field hydrate production test in 2013 (Matsuzawa M et al., 2014).
In order to intuitively elaborate the hydrate formation and deposition process by means of pressurization, this work runs a series of experiments in the customized transparent high pressure flowloop equipped with two different types of corners.The gas load and circulation velocity which may affect the hydrate formation were also studied to provide basic data for production design in the following field oceanic hydrate production tests.
2.Experimental methodology
2.1.Flowloop facility
All the experiments were performed in a flowloop(QIMG_TFA) with a total length of 39 m, shown in Fig.1.The internal diameter of whole flowloop is 10 mm, and a 9-m section of the loop is transparent consisted of two complete rectangular loops (Point 1-9 in Fig.1, Sections 1-2, 3-4, 5-6 and 7-8 are horizontal sections, 2-3, 4-5, 6-7, 8-9 are vertical sections).The remaining 30-m part is made of stainless steel with outer diameter of 11.46 mm.The main section of the stainless steel part is a 28.5-m coiler, which is dipped in the Cooling Water Bath (CWB).And the connection part between the transparent loop and SS coiler is about 1.5 m.The coolant ethylene glycol is controlled by a customized chiller (ICL-3), whose working temperature range is -10-50℃.There are two visible windows located at the inlet and outlet of the coiler pipe to ensure the visual inspection of the flow.The transparent loops are made of polycarbonate plastic and are placed in a customized aircooling chiller (RGDJ-500) with a temperature range from-20-35℃.The outer diameter of the transparent loops is 30 mm withstanding pressure of 8 MPa.There are two cambered corners and two perpendicular corners (located at Point 2, 4,5, 7 respectively) in the two complete rectangular loops.The bending radius of the cambered corners is 15 mm (Fig.S1).Two high definition (HD) cameras (MV-EM200C) are located at a cambered corner and perpendicular one respectively.A high-speed video camera (AVT Bonito CL-400) is placed at a horizontal section.Three cameras are used to capture and record the flow performance in different locations in the loops.There are two high-pressure liquid mass flow meters(OFG2-1/2-H2O-8L/min-M-HP-16MPa) with precision of 0.1 L/min placed between the stainless-steel section and the transparent section.The whole system is circulated by a customized pump (designed for multiphase flow, the mode of pump head is 110MB100B-501000), which can be pressurized to 10 MPa and operate from 300 to 2000 r/min.A piston-container with a volume of 2.1 L is also dipped in the CWB to saturate and pre-cool the deionized water in it.A pump (YRD-pump 70) is connected to the system for the constant mass flow or constant pressure injection during the pressurization process.Each corner of the rectangular loops is mounted with a thermocouple (Pt100, with the tolerance of ±0.15℃) and a pressure transducer (Senex DG2111-B-50, with the tolerance of 0.1 MPa).And there are two thermocouples located in CWB and air-cooling chiller respectively.All the data of temperature, pressure and flow rate in the experiments are collected by a computer.
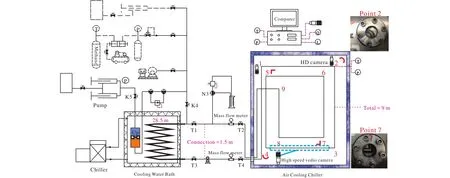
Fig.1.Schematic of the 39-m high-pressure flowloop QIMG_TFA.Main part is a 9-m transparent pipe with two complete rectangular loops.Point 2 and 4 are cambered corners, and Point 5 and 7 are perpendicular corners.The colorful piston-container is 2.1 L with lower part is highlighted in orange color.
2.2.Material and procedures
The liquid used in the experiments was deionized water,and methane gas was 99.99% of purity provided by BAPB Co.Ltd.It was noted from a couple of tests that no obvious gas hydrate formation and deposition were captured in the vertical section of the loops.Therefore, the high-speed camera was only placed in the horizontal section in the following work.
For preparing the experiments, the whole loop was rinsed and then was dried by an air compressor.The deionized water was automatically drawn into the loop by negative pressure after vacuuming.The amount of the injected water was recorded.The following processes can be divided into five steps, i.e., gas injection and water discharge, water saturating while circulating, pressurization, pressure maintaining with constant pressure injection and depressurization in the end.In the first step, the methane was slowly injected into the loop and the water was then discharged through the drain valve.When the desired amount of water was drained, the drain valve was closed and the whole flowloop was continuously pressurized by methane until 2.0 MPa.Then the circulating pump was set to a desired speed to circulate the mixed liquid in the loops.On the other side, 1.8 L deionized water was injected into the lower part of the piston-container in the CWB.The methane was then continuously filled into the lower part till the pressure reached 2.0 MPa.The two chillers were set to experimental temperature to cool the entire flowloop and the piston-container.The whole system was circulated for 12 hours before pressurization to make sure that the deionized water both in the piston-container and the loop were fully saturated with methane gas.
When the temperature of flowloop was decreased to the desired value and could maintain for one hour with the variations of temperature and pressure less than 1℃ and 0.1 MPa respectively, open the injection valve between the lower part of piston-container and the main flowloop.The deionized water was filled into the upper part of the piston-container at the high constant flowrate of 20 mL/min.Then, the pre-cooled methane-saturated water in the lower part of the pistoncontainer would be injected into the flowloop at the same rate.When the pressure in the loops approached the hydrate equilibrium pressure at the experimental temperature, the water injection rate was changed to a lower level, such as 10 mL/min, 5 mL/min or 2.5 mL/min.In this way, the moment of hydrate formation can be easily and clearly identified.Following hydrate formation, the constant flowrate injection was switched to constant pressure injection for 10 mins.This short duration is in order to make sure the experimental safety.And due to the same reason, the constant pressure injection was changed to a lower value to quickly dissociate the formed hydrate in the flowloop at the end of each experiment.All the experimental procedure is presented in Fig.2.And as the duration of the constant pressure and depressurization are short, these two are not the main parts of the experiment.
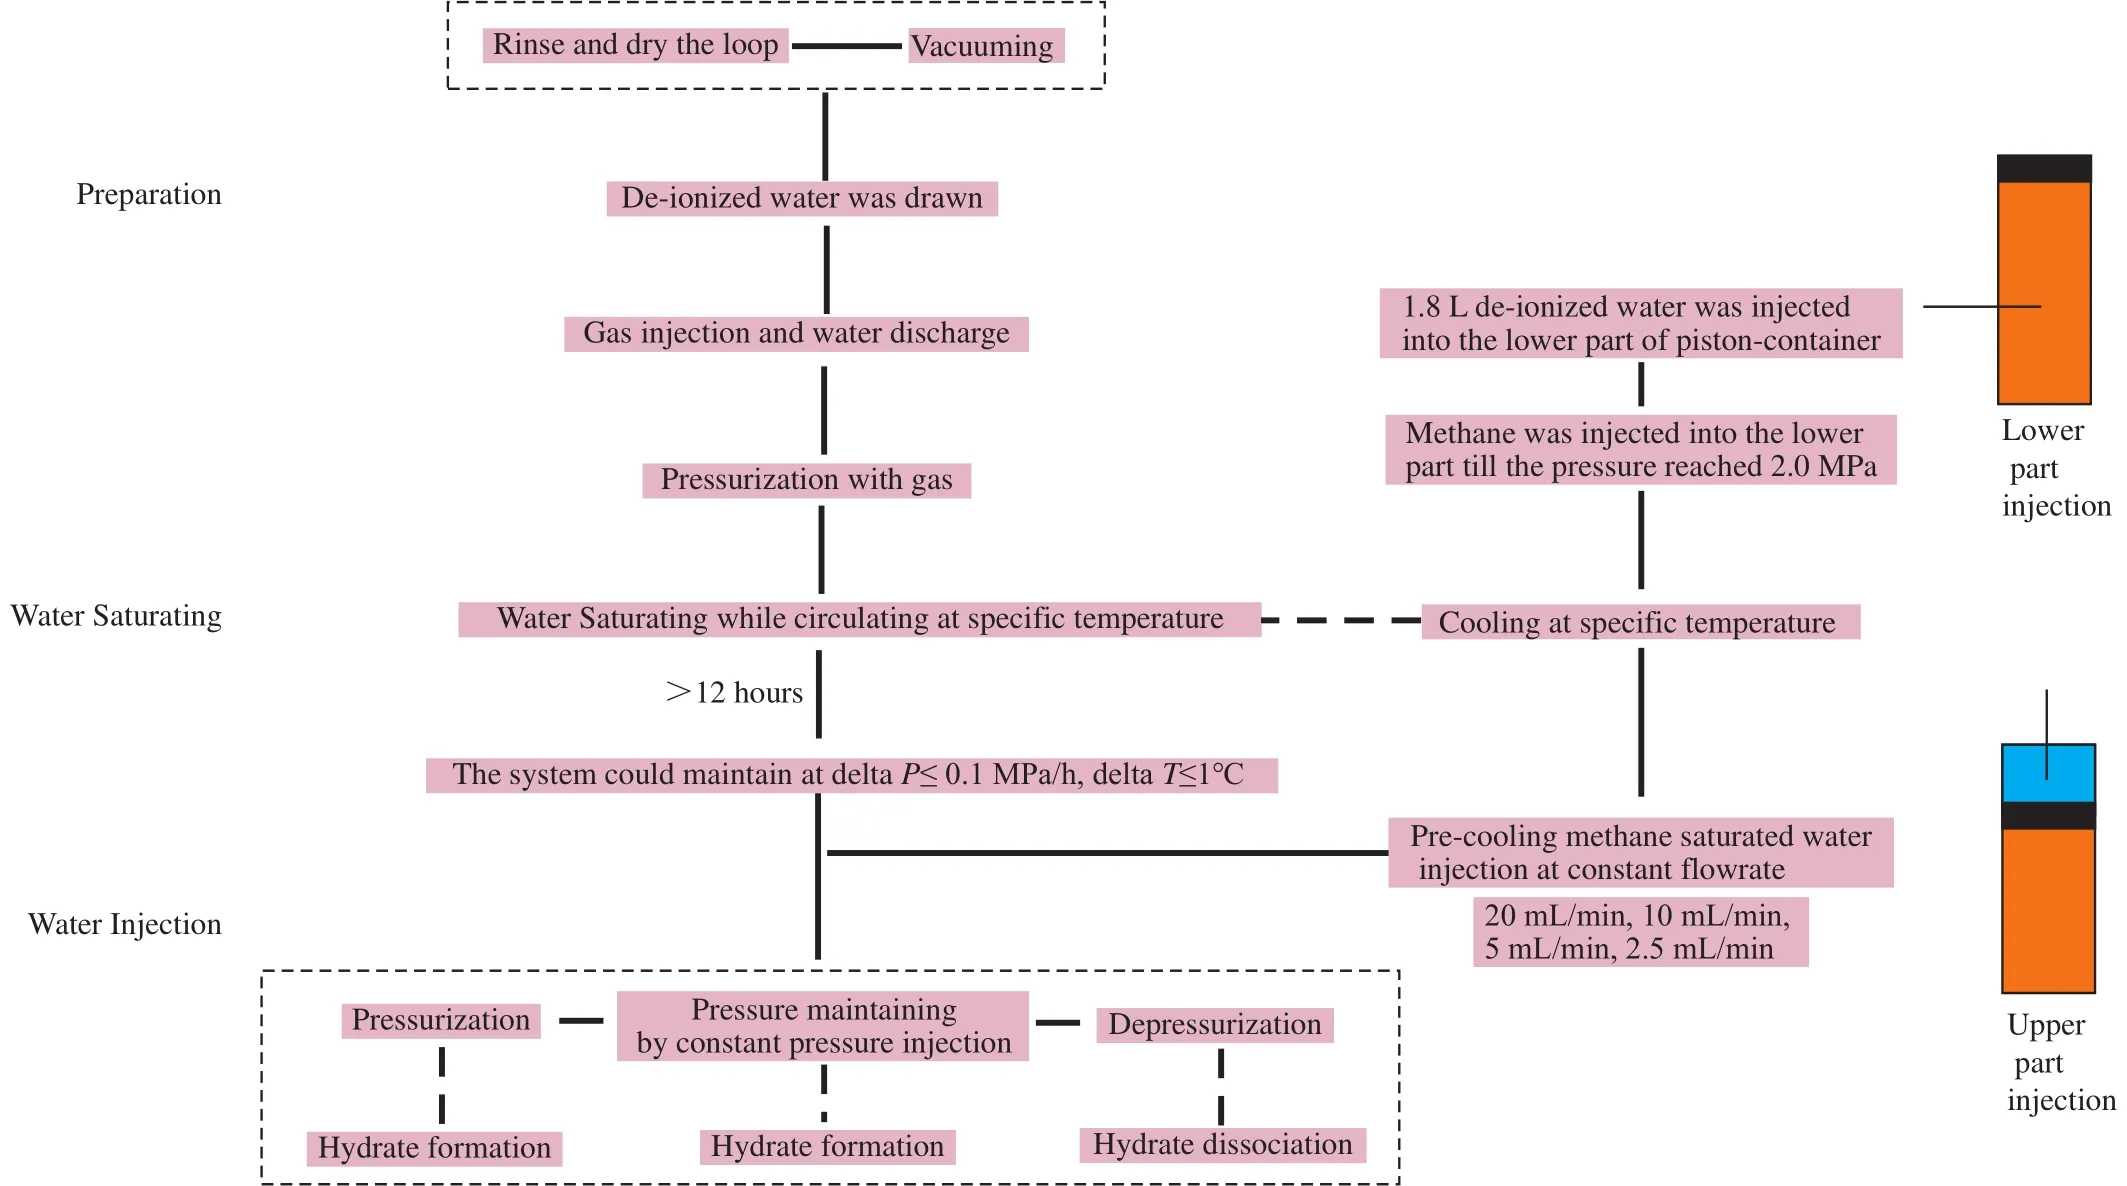
Fig.2.The flowsheet of the whole experiment procedure.
2.3.Gas fraction calculations
The deionized water was fully saturated with methane in the process of water saturating while circulating.The dissolved methane mode in this work employed Duan et al.’s prediction (Duan ZH et al., 1992; Duan ZH and Mao SD,2006).Then the total mole fraction of methane in the initial system of the flowloop can be estimated as:

WhereVwiis the volume of deionized water drawn into the loop after vacuuming,Vwdis the volume of water discharged from the loop through the gas injection, ρwandMware the density and mole mass ofthe deionized water respectively.ngiis the mole number of free methane in the loop andSgdiis the molality of methane dissolved in the water.
ngican be determined from the real-gas equation of state:

whereP0andT0are the stable pressure and temperature in the loop after long time circulation.Ris the gas constant value 8.314 J/(mol?K).Zg0is the gas compressibility factor and its estimation is based on Duan et al.’s prediction (Duan ZH et al., 1992):

wherePr0andTr0are relative pressure and temperature atP0-T0condition, their calculation method is as followingEq.4.Intermediate variablesB0,C0,D0,E0, andF0are the functions ofTr0, their estimations are asEq.5.βandγare constant 7.53970000E-01 and 7.71670000E-02, respectively.Vr0is methane relative molar volume, which can be determined fromEq.3.
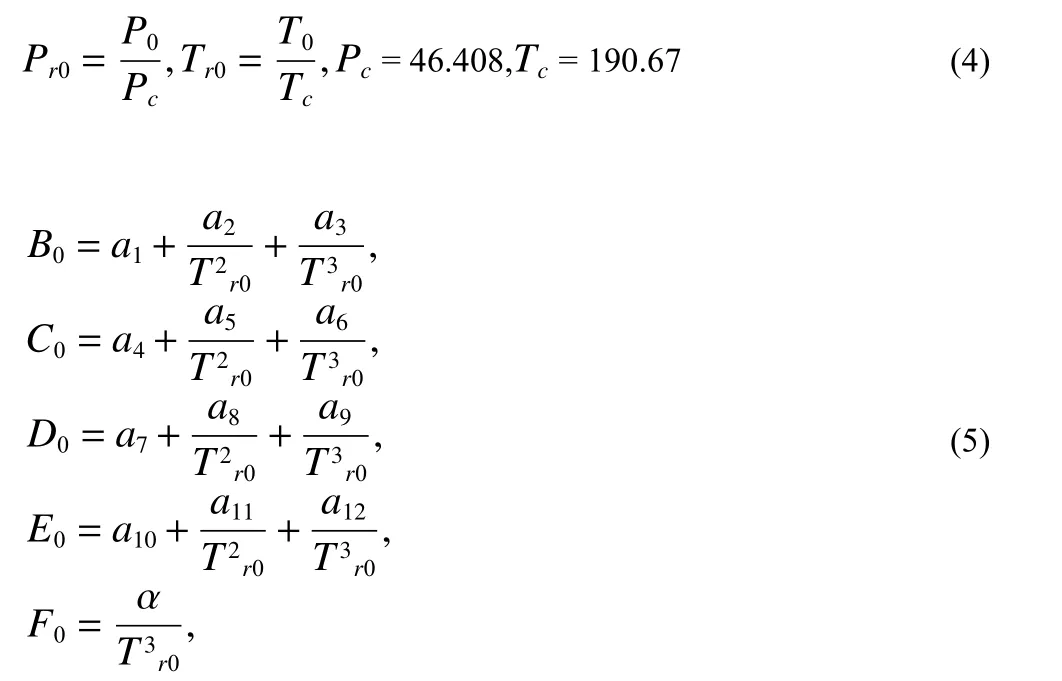
AmongEq.5,a1-a12and α are constants.a1=8.72553928E-02,a2=?7.52599476E-01,a3=3.75419887E-01,a4=1.07291342E-02,a5=5.49626360E-03,a6=?1.84772802E-02,a7=3.18993183E-04,a8=2.11079375E-04,a9=2.01682801 E-05,a10=?1.65606189E-05,a11=1.19614546E-04,a12=?1.08087289E-04, α=4.48262295E-02.Thus, the methane fugacity coefficient φgcan be also calculated at the knownP0,T0andZg0according toEq.6.

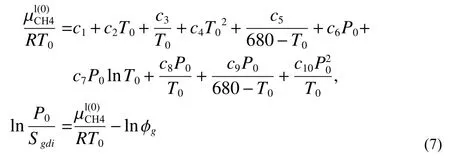
Thus, the methane solubilitySgdican be estimated byEq.7.
The conditions of experiments performed in the flowloop are listed in Table 1.The temperature and pressure are the average values of the temperature or pressure measured at the nine points at the transparent loop.Hydrate formation was investigated in a 100 vol% water system by varying the gas loading and circulating velocity.The methane mole fraction was varied from 3.5‰ to 6.6‰, mixing with the circulating speed from 300 to 1500 rpm.More detailed calculation method and the typical calculation can be found at our software copyright (2019SR0680096), which can be provided upon request.Moreover, the hydrate-formation systems in some experiments were repeated through sequential pressurization-depressurization cycles to investigate the“memory effect” (ME) of hydrate formation in the loops.
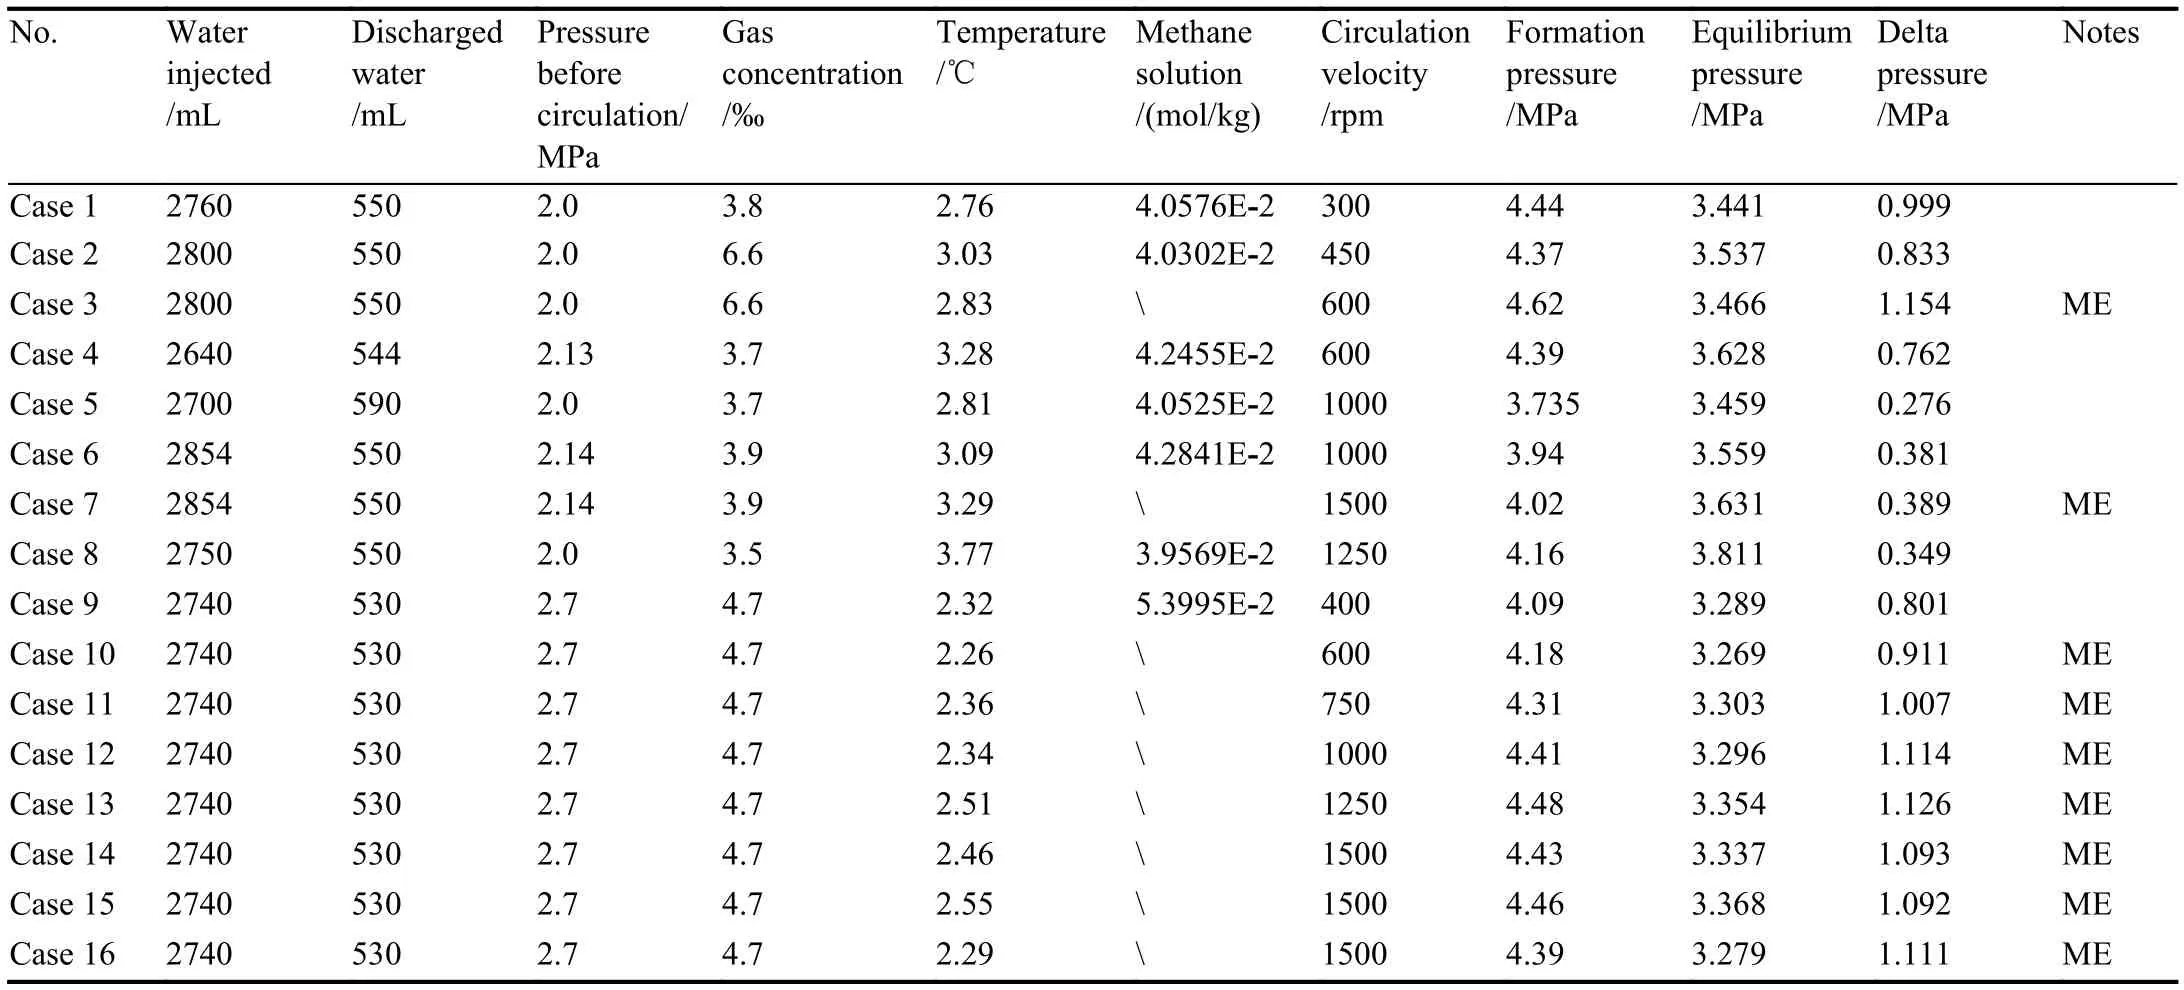
Table 1.List of the experimental conditions in the work.
3.Results and Discussion
3.1.Typical experimental run
Fig.3 shows Case 6’s temperature and pressure variations in the flowloop during the process of methane-saturated water injection.The pressure increasing is strongly dependent on the injection rate.Higher injection rate results in a higher pressure increasing rate.The onset of the hydrate formation is determined as the point when the pressure increasing rate starts to decrease caused by the expense of the methane nucleation.It also can be confirmed by a slight increase in the temperature at that moment in the inset of Fig.3, owning to the endothermic reaction of the hydrate formation.The cyclical fluctuations of the temperatures are due to the frequency conversion of the chiller, which cannot be eliminated because of the large size of the flowloop in this work.Since the variation trends of the temperatures are similar and the maximum difference is less than 0.4℃, the temperatures in the system are considered as uniform.
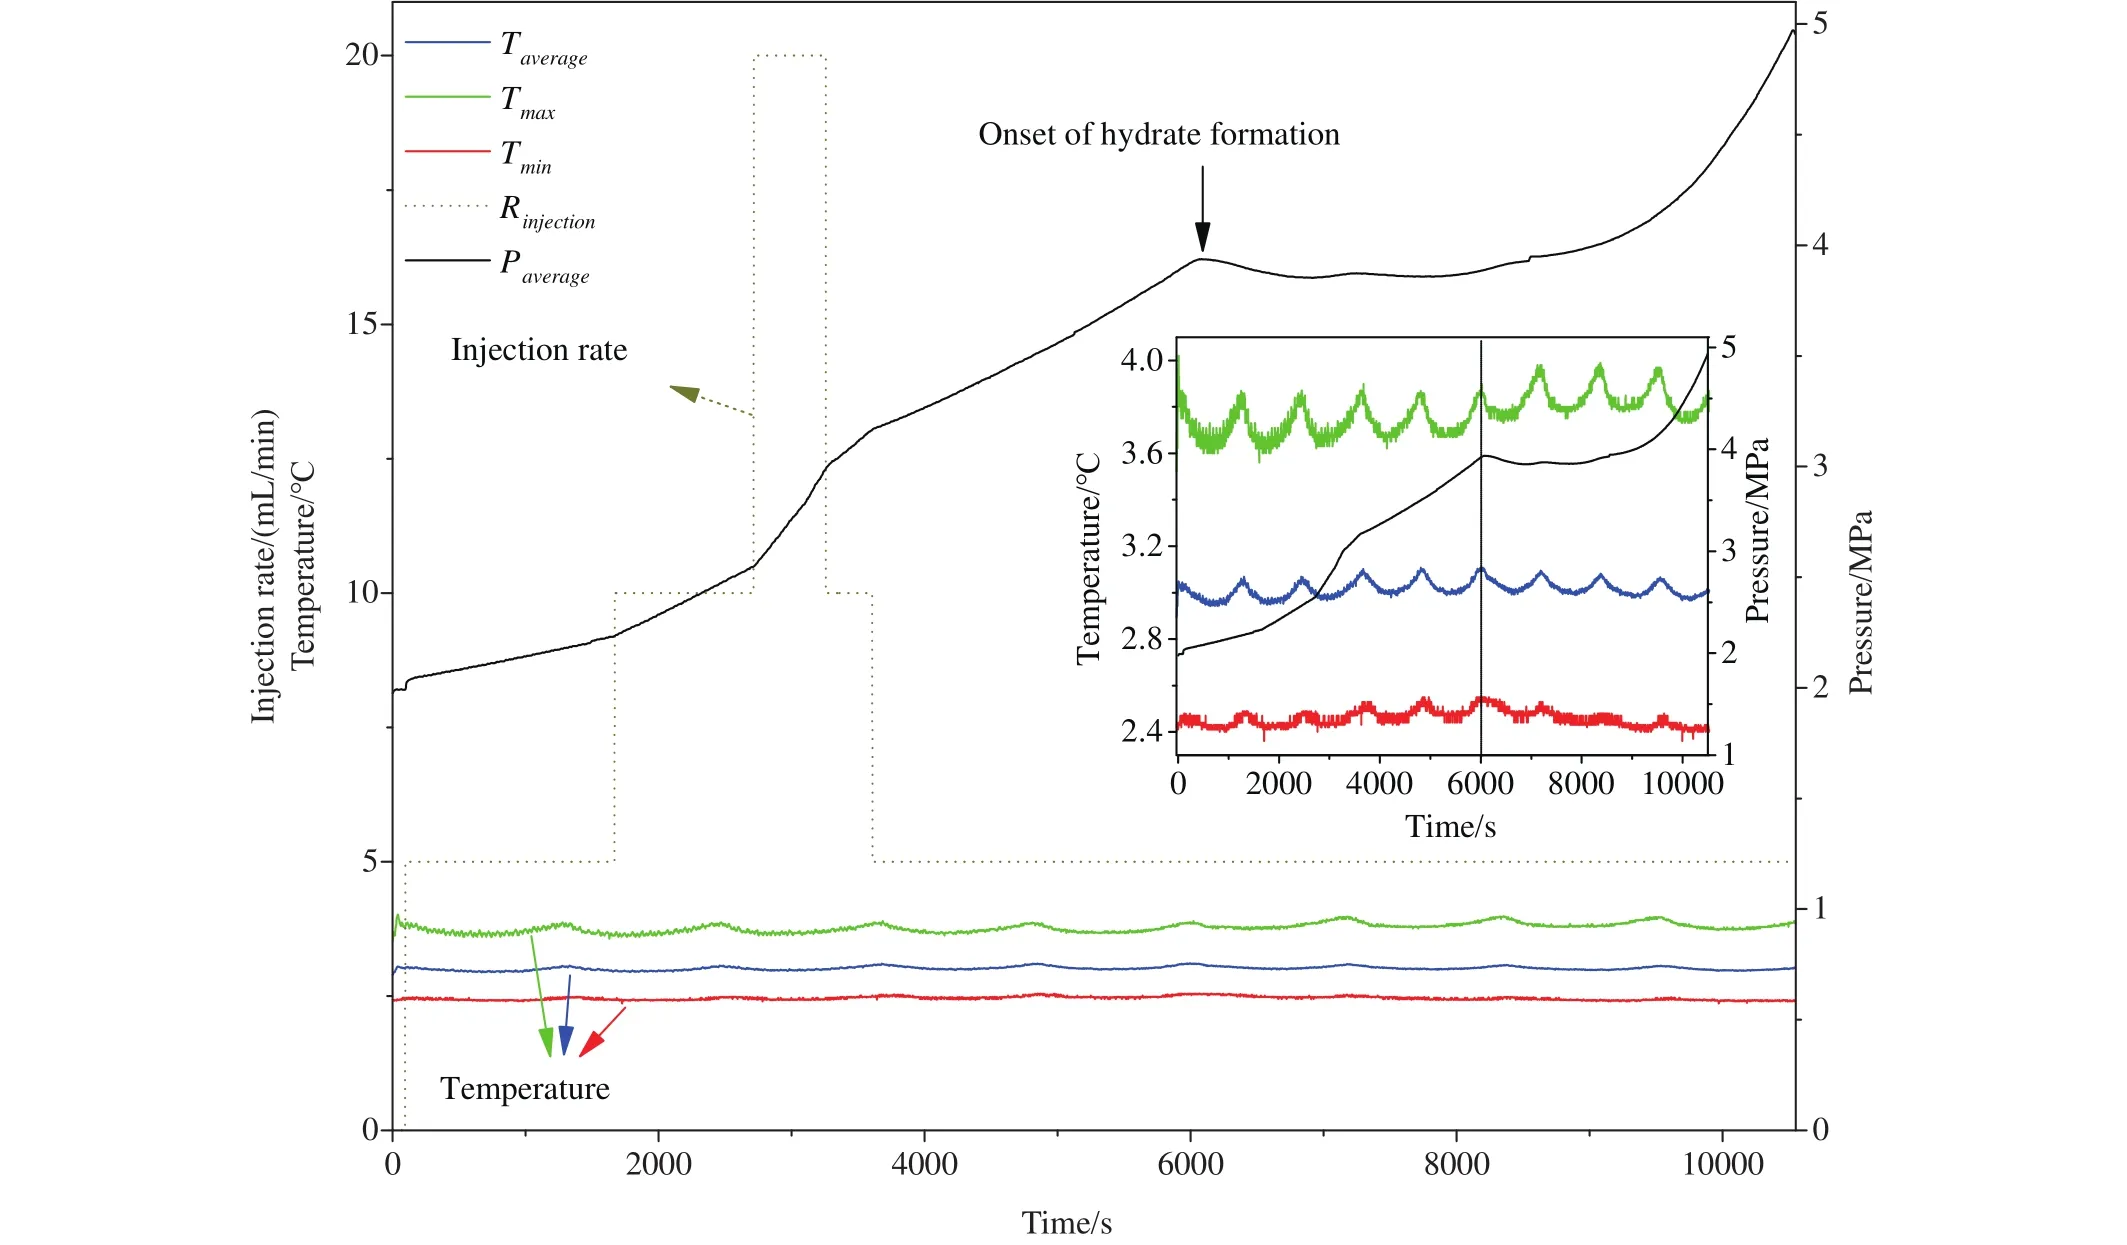
Fig.3.Variation of the temperature and pressure in the flowloop during the process of the methane-saturated water injection.Note: The three temperatures and one injection rate are both referring to left y-axis, which just the same value but different units.
The onset of hydrate formation in the typical experiment Case 6 is at 6053 s.The corresponding average temperature and pressure of the flowloop are 3.09℃ and 3.94 MPa,respectively.However, the equilibrium pressure at T=3.09℃can be calculated as 3.559 MPa according to the general expressionEq.8(Sloan ED and Koh CA, 2008; Moridis GJ,2003).

Where constantsd0?d5are ?1.94138504464560E5,3.31018213397926E3, ?2.25540264493806E1, 7.675591177 87059E-2, ?1.30465829788791E-4, 8.86065316687571E-8,respectively.Therefore, it suggests that there is a lag time of hydrate formation since the pressure reaches the equilibrium point.This phenomenon is quite popular in the hydrate nucleation during hydrate formation process in autoclaves(Chen J et al., 2019; Lim J et al., 2016), which is called‘induction time’.The induction times are normally stochastic and cannot be forecasted.However, on the other hand, the induction time is related to the driving force, which can be expressed as the pressure differencePbetween the experimental formation pressurePexpand the equilibrium pressurePeq(P=Pexp?Peq).The experiment results show that the driving force of the onset of hydrate formation depends on the circulation rate, which is discussed in the next section.
The increasing rate of pressure decreases with the formation of hydrates.Then the pressure retains nearly steady in the next stage, which is resulted from the fact that the rate of gas consumption caused by hydrate formation is comparable to the rate of water injection.Finally, the pressure starts to increase linearly again in the last stage as the continuous water injection at the rate of 5 mL/min.The transition from constant pressure stage to pressure-increasing stage could be the end of hydrate formation process, i.e., all the free gas was exhausted in this high water cut system.It should be noted that the pressure-constant period is not observed in all the experiments as not all the gas expense rate equals to the water injection rate.
3.2.Morphology of hydrate formation
The hydrate could be formed in two different ways in Case 6 during the process of the methane-saturated water injection, i.e., in the form of floccules in the two-phase flow system or as thin film covered the methane bubble.Some floccules are captured to stick to the inner wall or suspended in the water interface at the moment when the pressure increasing rate begins to decrease, shown in Figs.4b.The adhesive force between the hydrate and the inner wall is liquid bridge (Aman ZM et al., 2013).As the movement of liquid in the flowloop, the adhered hydrate particles slough off by the flushing of water.It can be observed in Figs.5.And there is a thin shell interface between the gas bubble and the liquid water, which can be distinguished by the irregular shapes of the methane and their non-integration in the loops,as shown in Fig.6.Actually, this is a common phenomenon during the two-phase hydrate formation in high pressure reactors studied by researchers (Turner D et al., 2009; Rao I et al., 2013).The successive bubbles in the flow system become smaller during the continuous pressurization process.When the circulation rate is relatively low (circulation ≤750 rpm),many gas-bounded hydrate floccules are captured to deposit at the upper wall.And in the early deposition stage, some clusters of hydrates at the lower layer moves along the hydrate layer at the flow direction as the liquid bridge between the different layers of hydrates is still not high enough to constrain the hydrate filmed bubbles.As the pressure continuously increases during the process of saturated water injection, all the hydrate filmed bubbles are sticked to the inner wall and cannot be moveable.Fig.7 shows that many hydrate floccules are deposited at the upper inner wall of the pipe when the system pressure is nearly 5.0 MPa (captured in Case 2).And they cannot be sloughed away by the flow, which is the same as the bedding layer in Joshi’s model (Joshi SV et al., 2013).Since the densities of the ice and hydrate are similar, the phenomenon of this kind of hydrate deposition is consistent with that in an ice system called fixed bed flow (Kauffeld M et al., 2005; Wang WC et al., 2014).
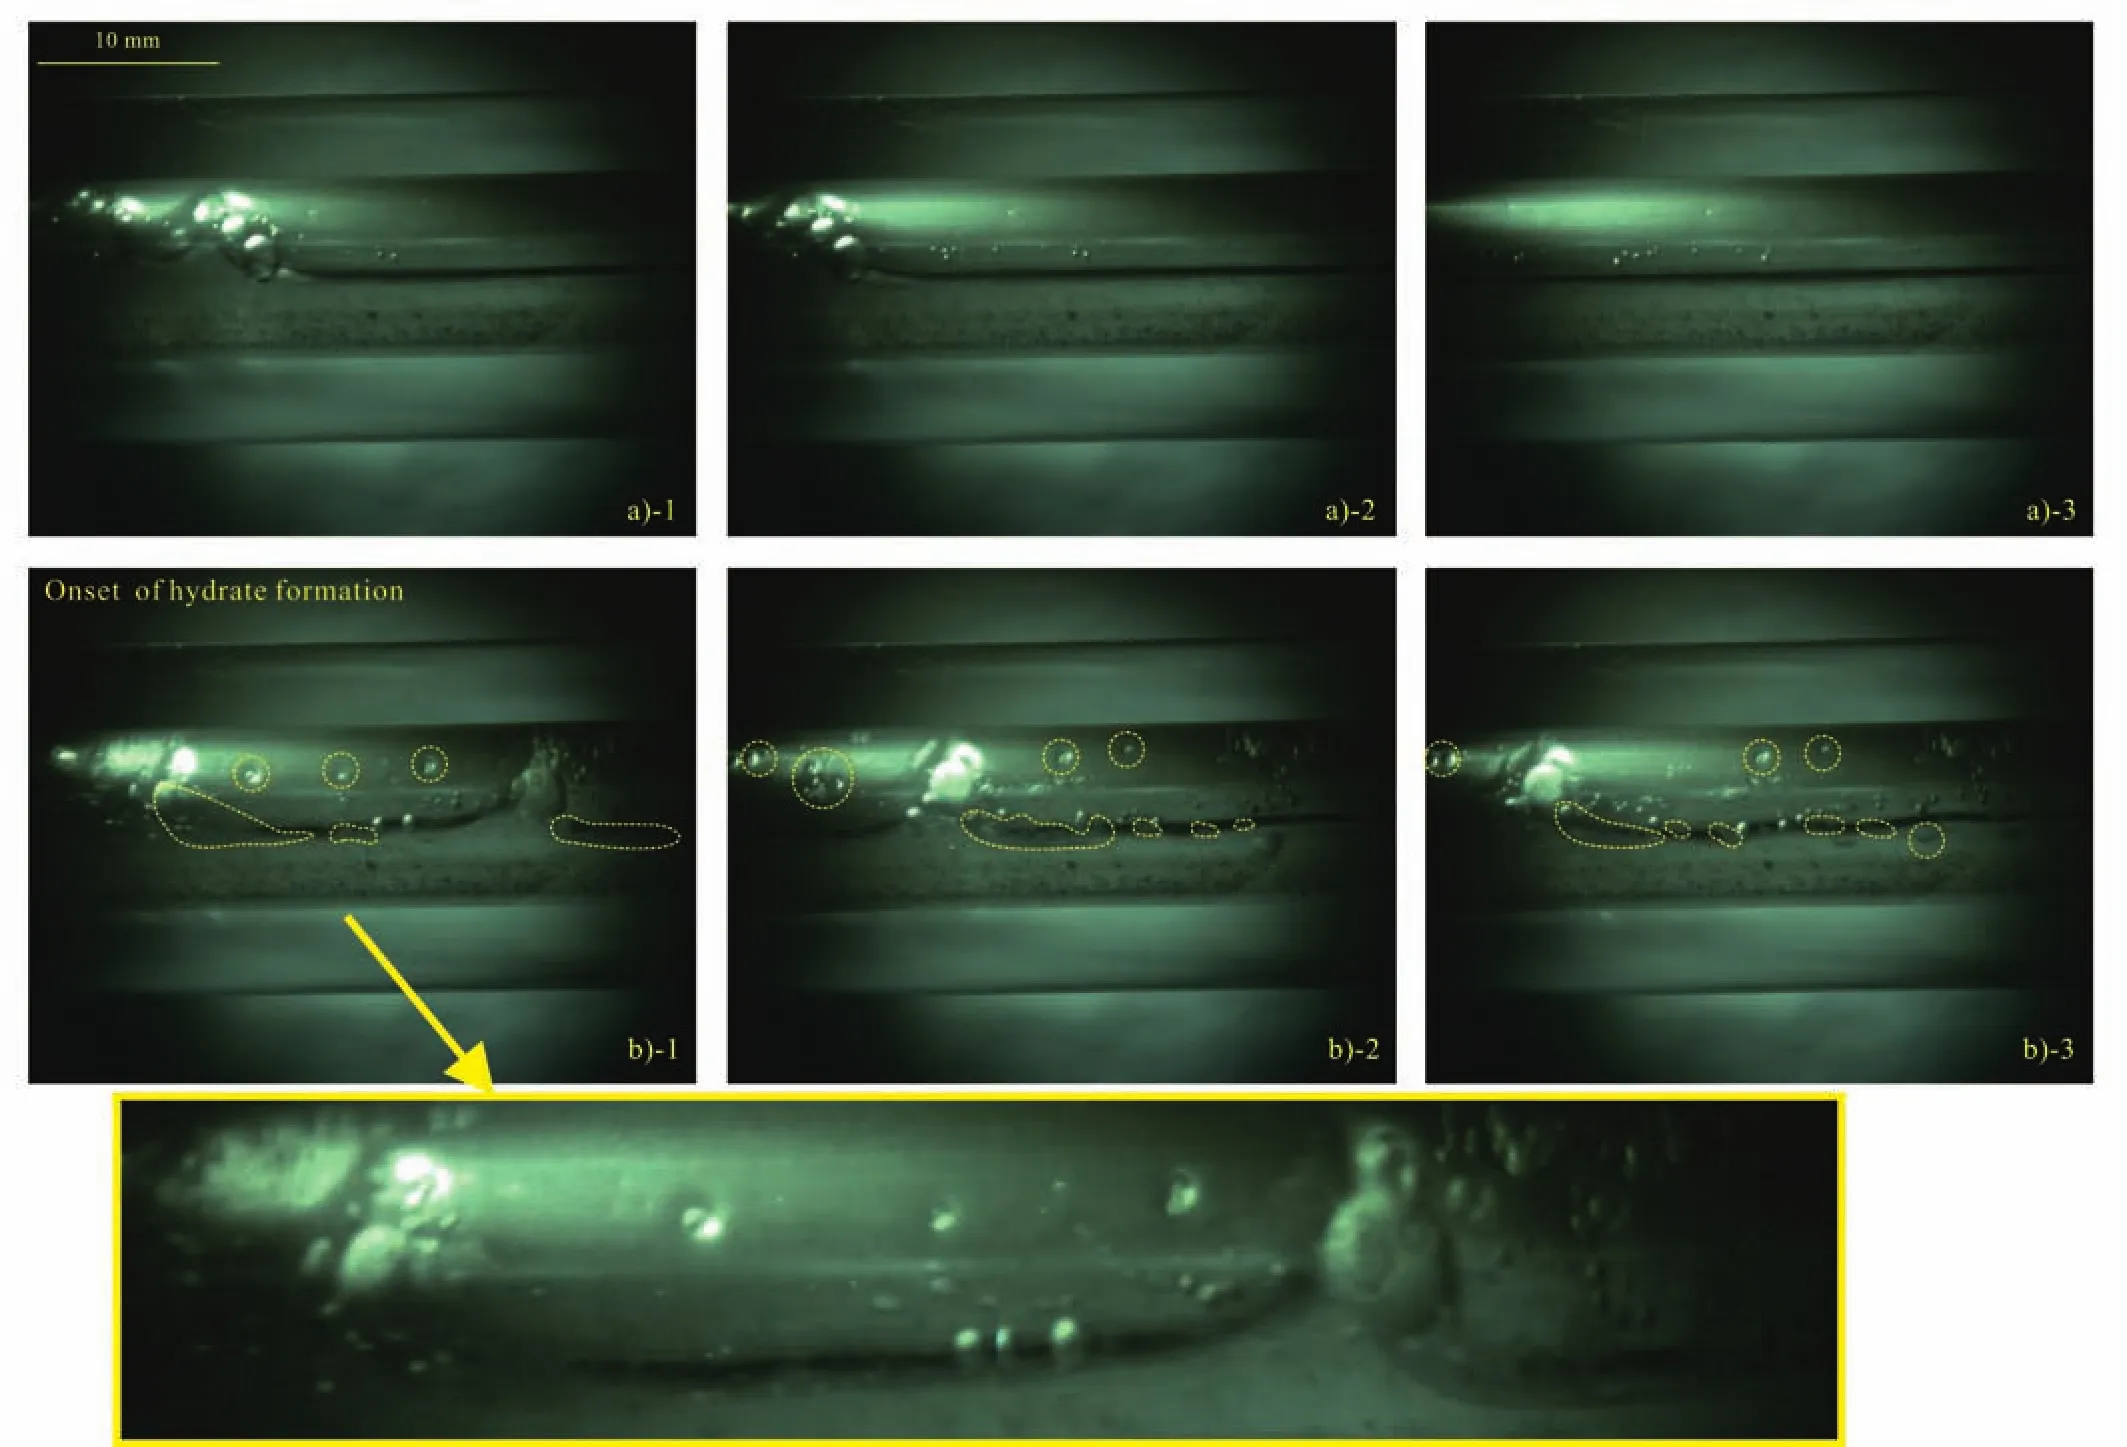
Fig.4.The images captured by the high-speed video camera at different moments.a1-3: the pressure in the system has not reached the equilibrium pressure and no gas hydrate can be observed; b1-3: the moment when the pressure increasing rate begins to decrease and some small hydrate particles are captured sticking in the wall.

Fig.5.The formed hydrates intermittently stick to the inner wall of loops and slough off due to the flushing of water flow.The yellow circle highlighted the formed hydrates and their locations are moving and no hydrates can be seen in (5)-(6).

Fig.6.The hydrate film between the gas bubbles captured by the high-speed video camera during the process of continuous gas-saturated water injection.The shape of the filmed hydrate is irregular and the gas bubbles cannot be integrated in the mixed flow.
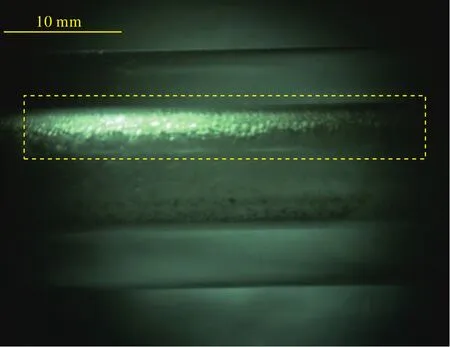
Fig.7.A deposited hydrate bed is captured to stick to the upper inner wall when the system pressure reaches 5.0 MPa.This hydrate bed is as the same as that in Fig.9, which are located in the two visual windows in the system.
Meanwhile, some small gas bubbles covered with hydrate shell can be observed at the cambered corner (testing point 2).Nevertheless, the hydrate shelled small bubbles would be sloughed away soon, shown in Fig.8.No hydrate shelled bubbles are captured in the perpendicular corner.It can be also seen through the visible windows that some hydrates are accumulated at the upper wall, narrowing the flow channel but no plugging occurs in the end (Fig.9).As the hydrateliquid mixture pattern is not so clear by the cameras at the higher circulation speed, especially after the moment that all the gas was consumed.A schematic Fig.10 can be proposed to depict the whole process of hydrate formation and deposit at two scenarios.When the circulation velocity is lower than 750 rpm, the five stages can be divided as Figs.10a, i.e.,saturating stage before pressure reaches the equilibrium condition, some hydrate floccules formation stage with bubbles getting smaller and irregular, continuous hydrate formation stage with bubbles becoming uniform, early hydrate bedding formation stage with some hydrate clusters moving along the lower bedding layer (Supporting information Fig.S2), final hydrate bedding formation stage with no moving hydrate can be seen.When the velocity is higher than 750 rpm, the experimental results show no hydrate bedding deposition.The formed hydrates are distributed in the flow water in the loops (Supporting information Fig.S3) and the amount increases as the gassaturated water injection, as shown in Figs.10b.
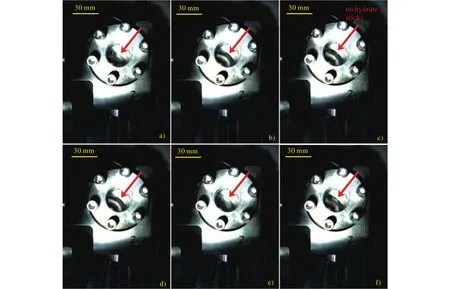
Fig.8.Hydrates are captured to intermittently accumulated in the right cambered corner.The hydrates are sticked at the different locations during the flow in figs (a), (b), (d), (e) and (f).There is no hydrate captured in fig (c).

Fig.9.Some hydrates deposited at the upper inner wall of the pipe through the visual windows.The two visible windows located at the inlet and outlet of the coiler pipe in the whole apparatus.

Fig.10.Schematic of whole process of hydrate formation and deposition at different scenarios.When the circulation velocity is lower than 750 rpm, the five stages are (1) Continuous gas phase, in which the methane bubbles are normally big.(2) Gas bubbles break, and the methane bubbles normally show irregular pattern in this period.(3) Gas bubbles break, in this period the methane bubbles are continuously broken and show relatively uniform.(4) Hydrate formation, it is early hydrate bedding formation stage, and some hydrate clusters are observed moving along the lower bedding layer.(5) Hydrate deposit stage, in this stage no moving hydrate can be observed and the flow channel is narrowed.When the circulation velocity is higher than 750 rpm, there are still five stages division and the first three stages are the same.However, in the forth stage, the formed hydrates are evenly distributed in the mixture flow.And in the fifth stage, the formed hydrates are increasing and no hydrate bed was observed, and the flow channel can maintain the same.
Fig.11 shows the flowrate variation measured by the liquid flowmeters in Case 6.The mixed flow in the pipeline is slug flow before all the free gas is converted to hydrate.And as the liquid mass flowmeters used in the experiments cannot accurately measure the flowrate of the gas-water mixture, the occurrence of gas makes the measurement curve vibration.Therefore, the pattern of the flowrate is pulsating.The flowrate increases as the system pressure raises during the saturated water injection process.And there is a slight decline in the pulsating pattern at 6053 s, which is attributed to the hydrate formation reducing the flow phase.While some hydrates are intermittently stuck to the wall, decreasing the flowrate through the liquid flowmeter.However, the flowrate increases again afterwards, which can be explained as the compensation of water injection.The pulsating pattern converts to smooth line with the pressurization proceeds.It is because the slug flow gradually becomes dispersed flow as the gas converts to the gas hydrate and no free gas is left in the flowloop in the end.And the flow becomes liquid and hydrate solid mixture, then the measured curve is smooth as litter gas is left in the loop.
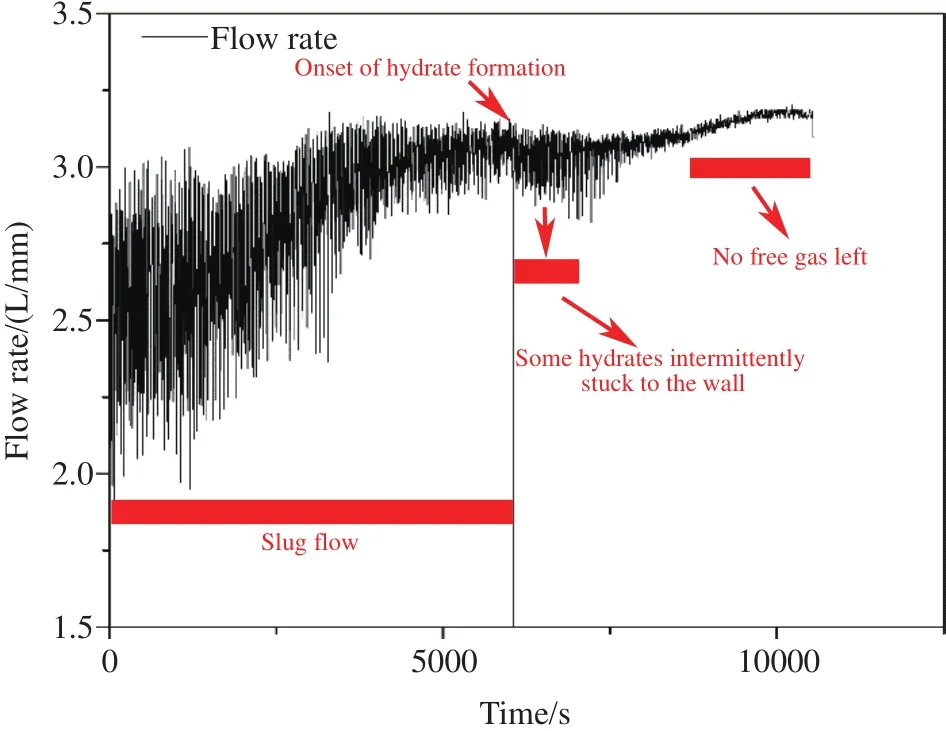
Fig.11.Flowrate variation at the entrance of the transparent flowloop.
The system is depressurized after all the free gas has converted to the hydrates, and the deposited hydrate bedding thins until none deposition can be seen.More successive bubbles appear again, which is a reversed progress of the hydrate formation in the system.
3.3.Calculation of methane dissolution and hydrate conversion
Some hydrates deposited in the inner wall after all the gas has converted into hydrate, narrowing the flow channel but no plugging can be observed when the circulation velocity is relatively low.When the hydration reaction of methane is described by the equation CH4+ 6H2O→CH4·6H2O, the amount of formed hydrate can be calculated by the mass balance of methane as the following equation,

Where,nsis the amount of hydrate formed,ntotgasis the total amount of gas consumed in the experiment.ndis(t0) is the amount of gas dissolved in the water of 2854 mL at the initial conditions (2.14 MPa and 18.5℃),ndis(Vliq-in) is the amount of methane dissolved in the distilled water injected during the pressurization stage (the volume of injected water is 899.7 mL, and the conditions are 1.985 MPa and 2.8℃ at this stage).Normally,ndis(t0) andndis(Vliq-in) can be calculated by the Duan and Mao’s methane-water two-phase solution thermal mode (Duan ZH et al., 2006), as discussed ahead.The results are 0.0913 mol and 0.0377 mol respectively.
Accordingly,nsis calculated as 0.6146 mol in the typical experimental case.And the amount of water consumed during the reaction is 66.38 mL, which is 1.78% of the total water.It is indicated that the hydrate would be formed after the system reached the equilibrium conditions.And the water conversion ratio would be 1.78% when the gas concentration is 3.9‰ and the system circulates at a speed of around 3 L/min.
3.4.Effect of water velocity on hydrate formation
Fig.12 shows the hydrate formation driving pressure(delta pressure = formation pressure - equilibrium pressure)for the different gas concentration and flowrate.It’s seen that the driving pressure decreases with the increasing pump circulation velocity.The stronger disturbance at higher speed results in complex distribution of successive liquid.Thus,larger contact area will be formed between the gas and liquid,which is beneficial for the hydrate formation.The gas concentration shows little influence on the driving pressure within the experimental range.It could be due to the fact that the difference of gas concentration condition is insignificant.On the other side, it is obvious that the driving force is larger than the fresh gas and water cases.This seems not in line with the “memory effect” of hydrate, in which the hydrate forms more easily from gas and water obtained by melting hydrate,than that from fresh water with no previous hydrate history.“Memory effect” is based on the induction time during which the hydrate formation pressure and temperature remains the same (Hiroshi O et al., 2010).And the precondition is that the melting temperature is not too high.Then the residual hydrate-like structure or the gas nanobubbles in the solution can still remain after hydrate dissociation, which are beneficial for hydrate re-nucleation (Sowa B and Maeda N et al., 2015; Zhao JF et al., 2015; Uchida T et al., 2016).However, if the hydrate system is heated sufficiently above the hydrate formation temperature, it is also reported that the“memory effect” will be destroyed (Sloan ED and Koh CA,2008).One recent research shows that the memory effect has a specific lifetime, which is below 16 hours in their study.The memory effect becomes vanished after that time and the time of hydrate nucleation could be longer.And this conclusion is quite consistent with the larger driving force in the memory hydrate formation even though their experiments are based on the pore-filling sediments.And it also should be noted that it is the driving force addressed as the delta pressure that being discussed in these experiments matters.The irrelevance relationship between the driving pressure and the gas concentration also shows the memory effect of hydrate formation on the driving force in some degree.But whether the hydrate cage structure has been destroyed during the depressurization process, more direct molecular-level investigations should be conducted to verify the hypotheses.
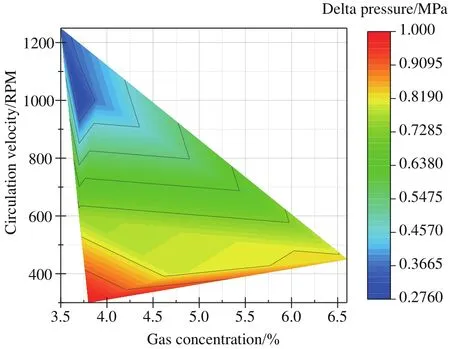
Fig.12.The hydrate formation driving pressure at different circulation velocity systems.
4.Conclusions
This study has investigated the hydrate formation and deposition process in a customized transparent high pressure flowloop.The following conclusions could be drawn by this research:
(i) There is a lag of hydrate formation since the pressure reaches the equilibrium condition in the flow regime.And the increasing rate of system pressure begins to decline when the hydrates start to form.
(ii) When the circulation velocity is lower than 750 rpm,hydrate formation process can be divided into five stages, i.e.,saturated stage, hydrate floccules formation stage, continuous hydrate formation stage, early hydrate bedding formation and final hydrate bedding formation stage.The hydrate bedding only deposits when the velocity is lower than 750 rpm.Otherwise, the formed hydrates distributed in the continuous fluid phase.
(iii) Although the formation of the hydrate bedding might narrow the flow channel of the loops, it does not cause plugging in the pipeline.
(iv) The driving pressure of hydrate formation decreases with the increasing flow velocity and it is larger in the memory experiments than that forms from fresh water and gas.The hydrate formation has memory effect on the driving pressure in the flowloop to some degrees.
CRediT authorship contribution statement
Li Huang: conceptualization, methodology, investigation,supervision, writing - original draft; Jia-la Kang: writing -review and editing; Xiao-dong Shen: Review and Editing;Jian-ye Sun, Qing-guo Meng, Qiang Chen, Chang-ling Liu and Neng-you Wu: Visualization; Gao-wei Hu: Funding acquisition.
Declaration of competing interest
The authors declare that they have no known competing financial interests or personal relationships that could have appeared to influence the work reported in this paper.
Acknowledgement
This work was funded by the National Natural Science Foundation of China (42076217, 41976205), Shandong Provincial Taishan Scholars Special Expert Project(ts201712079), Marine Geological Survey Program(DD20190231), and Shandong Natural Science Foundation(ZR2017BD024).And we are very grateful to Prof.Linga’s lab (National University of Singapore) for their help and guidance on this work.
Supplementary dataset
Supplementary data (Figures.S1-S3) to this article can be found online at doi: 10.31035/cg2022015.
- China Geology的其它文章
- China achieved fruitful results in oil-shale gas-coalbed methane exploration and development in 2021
- Formation mechanism, experimental method, and property characterization of graindisplacing methane hydrates in marine sediment: A review
- Molecular simulation studies on natural gas hydrates nucleation and growth: A review
- Distributed optical fiber acoustic sensor for in situ monitoring of marine natural gas hydrates production for the first time in the Shenhu Area, China
- Stability analysis of seabed strata and casing structure during the natural gas hydrates exploitation by depressurization in horizontal wells in South China Sea
- Application of wellhead suction anchor technology in the second production test of natural gas hydrates in the South China Sea

