Numerical simulation of carrier gas effects on flow field, species concentration and deposition rate in the chemical vapor deposition of carbon
YIN Teng, JIANG Bing-yan, SU Zhe-an, FAN Zhe-qiong, HUANG Qi-zhong
(1. State Key Laboratory of High-Performance Complex Manufacturing, Central South University, Changsha400083, China;2. State Key Laboratory of Powder Metallurgy, Central South University, Changsha400083, China)
Abstract: A 2D numerical model was established for simulating the chemical vapor deposition (CVD) of carbon in a vertical reactor. A full multi-component diffusion model was proposed to describe the diffusion of the gas species. The effects of Ar, N2 or H2 carrier gases on the flow field, species concentration and deposition rate of pyrocarbon were investigated using C3H6 as the carbon source. Results show that H2 improves the stability of the gas flow. The concentration distributions of CH4, C2H2, C2H4 and C6H6 are uniform in H2. The pyrocarbon deposition rate is lowered, but the uniformity of deposition is improved when H2 is used as the carrier gas compared with N2 or Ar. The simulation results agree well with the experimental ones.
Key words: Chemical vapor deposition; Diffusion; Simulation; Carrier gas
1 Introduction
Chemical vapor deposition (CVD) is an advanced technology which can be used to prepare pyrocarbon, nanofibers, carbon nanotubes and graphene[1-4]. CVD offers a lot of unique advantages such as versatility, reproducibility and cost effectiveness. CVD is a combined physical and chemical process that includes gas flow and chemical reactions. So the chemical and physical process should be considered at the same time to describe the CVD. However, the process is much difficult to study by trial and error methods because of the complexity of the interaction between the diffusion of the gaseous species and the deposition reactions of products. Numerical simulation is a promising tool for a deep understanding of the CVD. A number of woks on modeling CVD have been reported until now[5-7]. Hejun Li[8]used the parallel-consecutive model and the bimodal pore model to simulate the diffusion of reactants in the pores with different sizes. Pratyush[9]simulated the CVI in a vertical reactor. In his work, the Fick diffusion model was used to describe the diffusion. Zhang[10]used the Fick and Knudsen diffusion model to simulate the effects of methane partial pressure on the deposition rate of the reactants. Some published works have showed that the carrier gas plays an important role in the CVD. When H2was used as a carrier gas, the deposition reaction was inhibited by blocking most active sites to prevent an uncontrolled deposition of pyrocarbon[11].Li[12]simulated the H2inhibiting mechanism on the CVD. However, most of their works dealt with the chemical process and the chemical mechanism of the carrier gas. The effect of the carrier gas on the flow and diffusion of reactants was neglected by many researchers.
In the present work, a multi-component diffusion model is proposed to simulate transport phenomena of gas species. The effects of the carrier gas on transport phenomena of the reactants and intermediate products are studied. The deposition rate and uniformity are also calculated and analyzed. The simulation results were validated by corresponding experiments. This work will provide useful insights into CVD mechanism for further computational research.
2 Modelling
2.1 Physical model
Fig. 1 (a) shows the configuration of the CVD reactor. The CVD reactor is vertically mounted with an inlet at the bottom and an outlet at the top. The reactor consists of a cylindrical section (L1= 280 mm,D1=60 mm) which is covered by a piece of graphite paper on the inner side of the wall, and a conic
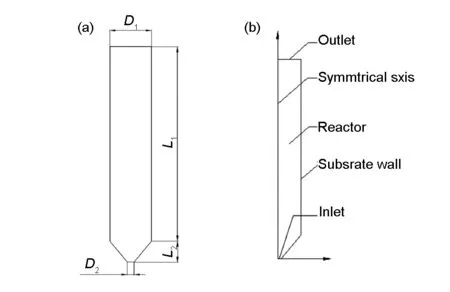
Fig. 1 Schematic drawing of the vertical CVD reactor:(a)physical dimensions and (b) 2D axisymmetric model.
section (L2=30 mm,D2=10 mm) which is at the bottom of the cylindrical section. Only half of the fluid zone is simulated due to its axial symmetry. In this study, propylene as the precursor, and hydrogen, nitrogen or argon as carrier gas are pumped into the CVD reactor. The deposition of pyrocarbon occurs on the surface of the graphite paper.
2.2 Assumptions and governing equations
The incompressible ideal gas law is used to describe the densities of gases. The laminar flow is assumed in this work. Heat generation by chemical reactions is neglected. All the reactions are regarded as irreversible first-order reactions. According to the assumptions mentioned above, mass conservation, momentum conservation, energy conservation, and species conservation equations are used[13].
The formulation of mass conservation is given as:
▽·(ρu)=0
(1)
whereρis the density anduis the velocity of the fluid.
The momentum equation is solved using the Navier-Stokes equation:
▽·ρuu+▽P+▽·τ=0
(2)
wherePis the pressure andτrepresents the shear stress.
The energy conservation equation is applied for the fluid domain:
CP▽·(ρuT)-▽·(λ▽T)=0
(3)
whereCPis the specific heat capacity of the gas mixture (J/kg/K);Tis the temperature (K),λis heat conductivity (W/mK).
The species transport equation incorporating the chemical reactions is used as follows:

(4)


(5)
D=[Dij]
(6)
whereNis the number of chemical species andYjis the mass fraction of speciesj. Because the mass fraction of the propylene is too large to be considered as dilute, the full multi-component diffusion model is used to solve the diffusion problem. In order to describe the multi-component diffusion, the [Dij] use a (N-1)×(N-1)matrix of the coefficients,Dijwhich can be defined by the equation[11]:
(7)
whereMiandMjare the molecular weight of speciesiandj, respectively (g/mol),Pabsis the absolute pressure (Pa),Ωis the diffusion collision integral andσijis the collision diameter.
2.3 Kinetic mechanism
The CVD reaction include homogeneous gas-phase reactions and heterogeneous reactions. The homogeneous reaction model, which consists of 19 species in 27 reactions, was used in this study[8]. The heterogeneous reactions model employ the deposition mechanism from Becker′s[1]research. Methane, acetylene, ethylene and benzene are the main deposition source in heterogeneous reactions. The temperature dependence of reaction rate is described by the well-known Arrhenius equation[14]:
(8)
wherekis the specific reaction rate,Tis the absolute temperature,Ris the ideal gas constant,Ais the pre-exponential factor andEis the activation energy. The pre-exponential factor and the activation energy used in this work is listed in Table 1[1].

Table 1 Original surface reaction kinetic data of various species.
2.4 Simulation conditions and the numerical method
The following boundary conditions are imposed. The inner and outer walls of the reactor are adiabatic. The no-slip condition is imposed at the walls. The surface reactions are carried out on the vertical wall where the temperature isTw=1 173 K.
In this simulation, The carrier gas is hydrogen, nitrogen or argon. The gas mixture, with a volume ratio of C3H6to carrier gas of 1∶10, enters the reactor with a velocityUin=0.1 m/s.
Fluent uses the finite volume methods to discretize the governing equations (Eq.1, Eq.2,Eq.3,Eq.4,Eq.8) that are then solved with a segregated solver. SIMPLE algorithm is used to and the first order upwind scheme is applied for the governing equations. A convergence criterion of 1×10⁻⁶is used to the residuals of continuity, momentum, energy and species balance equations. The computational mesh number in this work is 18 780, which are created by Gambit with quadrilateral elements.
3 Results and discussion
3.1 Validation of simulation model
An experiment is carried out to validate the simulation model. The size of the experiment reactor is the same as the simulation model. The wall is heated at
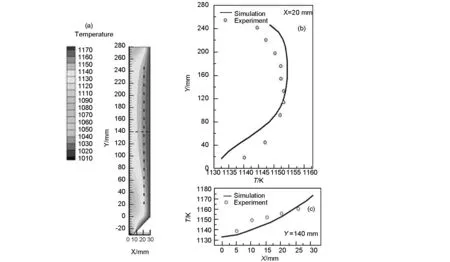
Fig. 2 The simulation and experiment results of the temperature in the reactor: (a) temperature contour of the reactor, (b) the simulation and experiment results for the temperature at X=20 mm and (c) the simulation and experiment results for the temperature at Y=140 mm.
1 170 K. The temperature distribution inside the reactor is measured by thermocouples at different parts in the reactor. Fig.2(a) shows the simulated contour of the temperature in the reactor. The temperature near the wall is higher than that in the center part of the reactor. Because the wall is used for heating element. The gas near the wall is heated by the heating element. So the temperature of the gas near the wall is high. The gas in the center part is heated through heat convection transfer. The gas at room temperature flows continuously through the reactor from the inlet to outlet. So the reactor is continuously cooled down in the center part. As a result, the temperature in the center part is lower than that near the wall. The dash lines in Fig.2(a) (X=20 mm and Y=140 mm) represents the positions used for extraction of the calculated and measured temperatures. Fig.2(b) shows the simulation and experiment results for the line of X=20 mm.The temperatures increase and then decrease from bottom to top for both simulation and experiment results. The maximum and minimum temperatures appears at the similar position. The average temperature is around 1 140 K for the calculated and measured results. The maximum difference of the temperature between the simulation and the experiment is less than 10 K. Fig.2(c) shows the simulation and experiment results for the line of Y=140 mm. The temperature increase from center to the wall in both results. The maximum difference of
the temperature between the simulation and the experiment is less than 12 K.Therefore, it is reasonable to conclude that the simulation model is reliable.
3.2 Effect of carrier gas on the gas flow field
Fig.3 shows the flow field contours in the CVD reactor with the velocity colored in proportion to their magnitude (m/s) for clear visualization. As the figure shows, the velocity is maximum at the inlet and decreases as the gas approaches to the wall in all cases. Fig.3(a) shows that the flow field is steady when H2is used. As observed from the Fig.3(b) and (c), there is a circular region existing between the inlet and the wall. No such region is observed for the H2case. The velocity value of the flow is negative (visible in blue: -0.04~0 m/s). It means that the direction of the velocity is changed. As a result, the stability of the flow field is decreased when N2or Ar is used.
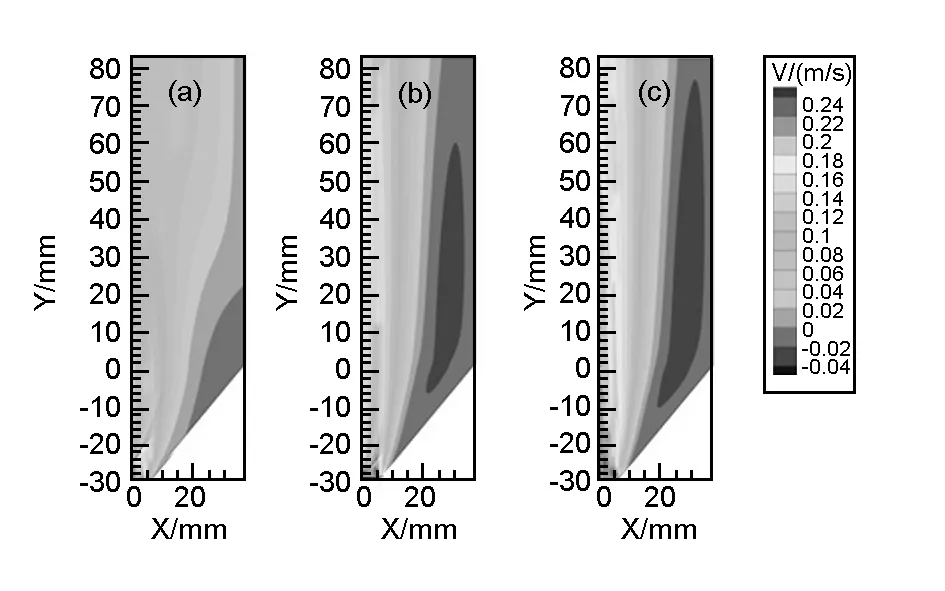
Fig. 3 Gas flow field in the reactor when the carrier gas is (a) H2, (b) N2 and (c) Ar.

Fig. 4 Velocity vector contour when the carrier gas is (a) H2, (b) N2 and (c) Ar.
In order to investigate the circulation part of the flow, a 30×30 mm2region is extracted and the velocity vectors are shown in Fig.4. Fig.4(a) shows the velocity-vectors in the H2case. Most of the flow is a steady flow. In a small region (x=20-30 mm,y=0-15 mm) near the inlet, the direction of the flow is changed and some turbulence emerges. Fig.4(b) and Fig.4(c) shows the velocity-vectors in the N2and Ar cases, respectively. The velocity vectors are similar in both cases. The vector contours show two part of gas flow with different directions. The turbulence region in the N2and Ar cases is much bigger than that in the H2case. Compared with the three cases, it can be concluded that the stability of the flow field can be improved by using H2as a carrier gas.
The stability of the flow can be described by the Reynolds number[15]. Equation 9 shows the Reynolds number:
(9)
whereρis the density of the gas (kg/m3),vis the velocity (m/s),Dis the reactor diameter (m),ηis the dynamic viscosity(Pa·s) andγis the kinematic viscosity (mm2/s). With the value ofReincrease, the turbulence of the fluid increases and the stability of the fluid field decreases.
Table 2 shows the kinematic viscosity of H2, N2and Ar[16, 17]. The kinematic viscosity of the gas mixture increases in the order of Ar, N2, H2. As the kinematic viscosity of the gas mixture increases, theReof the fluid decrease. As a result, the stability of the flow field can be enhanced.

Table 2 The kinematic viscosity of the carrier gases.
3.3 Effect of carrier gas on concentration distributions of species
Since CH4, C2H2,C2H4and C6H6are the main byproducts and deposition sources, it is important to examine changes of concentration distributions of these species along the wall substrate. Fig.5 shows the molar concentrations of major chemical components found at the substrate along the wall in H2, N2
and Ar. The molar concentrations of CH4(a), C2H2(b), C2H4(c) and C6H6(d) are plotted as a function of the axial distance from the inlet.
The molar concentrations of CH4, C2H2, C2H4and C6H6in the H2case are much lower than those in the cases of N2and Ar. The molar concentrations of the byproducts in the Ar case is highest among the three cases. In order to investigate the uniformity of the species, the concentration variance (S2) is used, which is defined as:
(10)

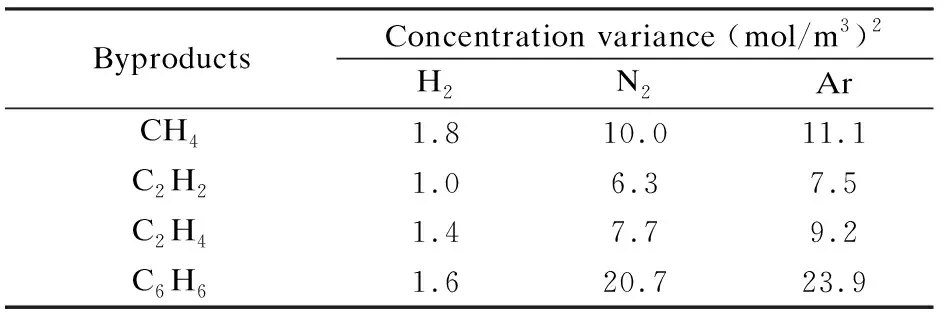
ByproductsConcentration variance (mol/m3)2H2N2ArCH41.810.011.1C2H21.06.37.5C2H41.47.79.2C6H61.620.723.9
3.4 Effect of the carrier gas on deposition process
Fig.6 shows the simulation results of deposited pyrocarbon distribution in the H2, N2or Ar cases.From the picture, the average deposition rate of the pyrocarbon in H2is much lower than in N2or Ar. Along the height of the wall, the deposition rate increases along the axial distance from the inlet below the height of 200 mm. After then, the deposition rate decreases along the wall because of the consumption of the carbon source and byproducts. However, the deposition rate in H2is much uniform than in Ar or N2.
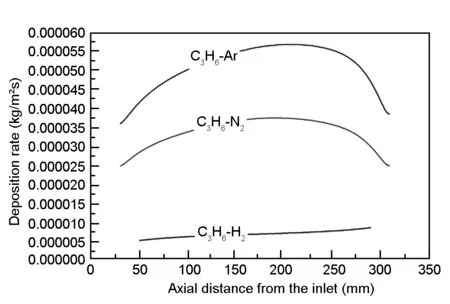
Fig. 6 The deposition rate along the substrate wall with different carrier gases.
4 Deposition experiment
4.1 Experimental details
According to the simulation results, deposition experiments are carried out under the similar conditions to the simulation experiments. A vertical reactor is mounted with the gas inlet in the bottom and the outlet on the top. Graphite paper is employed as the substrate in the deposition experiments. C3H6is used as the carbon source, and H2, N2or Ar is used the carrier gas. The detailed experiment parameters are listed in Table 4.
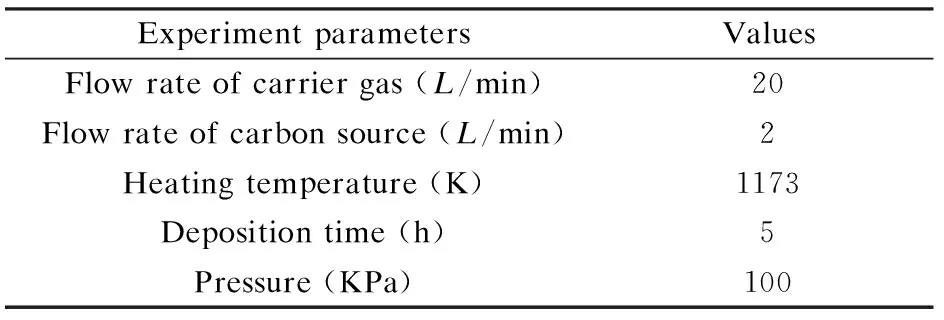
Table 4 The CVD experimental conditions.
4.2 Experimental results
In the experiment, the deposition rates can be measured by the thickness of the pyrocarbon on the graphite paper. Fig.7 shows the deposition rate at different heights of the substrate. According to Fig.7, the deposition rate in the carrier gas of H2is much lower than that in the N2and Ar cases. When N2or Ar is used as the carrier gas, the deposition rate increases along the height of the substrate below the height of 180 mm or decreases along the substrate above the height of 180 mm, respectively. The deposition rate is relatively more uniform when H2is used as the carrier gas, which agrees well with the simulation results.
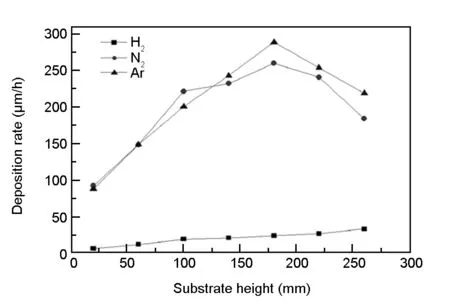
Fig. 7 Deposition rate with different carrier gases as a function of substrate height.
Fig.8 presents surface morphology of the deposition carbon in different carrier gases. The deposition carbon presents a spherical cap morphology. The average diameters of the cap are 50, 80 and 80 μm when H2, N2and Ar are used as the carbon sources, respectively. Apparently, the diameters of the cap in N2(Fig.8 (b)) and Ar case (Fig.8 (c)) are much larger than that in H2(Fig.8 (a)), which implies that the reaction is much fast when N2or Ar is used as the carrier gas. However, Fig.8(a) shows a smooth and uniform morphology, which implies that H2helps to improve the uniformity of the pyrocarbon deposition.

Fig. 8 SEM surface images of pyrocarbon prepared with different carrier gases: (a) H2, (b) N2 and (c) Ar.
5 Conclusions
This paper has employed a full multi-component diffusion model to simulate the CVD. The effects of H2, N2and Aron as the carrier on gas flow, species concentration and deposition rate have been investigated. As shown in the results,H2can improve the stability of the flow field. The reactant component distribution is much more uniform in H2than that in N2or Ar. Although the deposition rate is lower in H2compared with in N2or Ar, the deposition uniformity is much improved when H2is used. Under the existing operating conditions, the simulation results of this study have good agreement with the experimental ones.
- 新型炭材料的其它文章
- 磷酸活化法活性炭孔隙結(jié)構(gòu)的調(diào)控機制
- A dramatic improvement in the tensile strength of fullerene needle-like crystals
- Synthesis of porous graphene-like carbon materials for high-performance supercapacitors from petroleum pitch using nano-CaCO3 as a template
- 鋰氟電池用高倍率氟化多壁碳納米管正極材料
- One-pot synthesis of N, S co-doped photoluminescent carbon quantum dots for Hg2+ ion detection
- 酚醛氣凝膠/炭纖維復(fù)合材料的結(jié)構(gòu)與燒蝕性能

