A numerical simulation case study of the coastal currents and upwelling in the western Persian Gulf
Hesmeddin Mehrfr , Msoud Tori Azd , Kmrn Lri , As-Ali Ali-Akri Bidokhti
a Department of Natural Resources and Environment, Islamic Azad University, Science and Research Branch, Tehran, Iran
b Department of Marine Science and Technology, Islamic Azad University, North Tehran Branch, Tehran, Iran
c Institute of Geophysics, University of Tehran, Tehran, Iran
Abstract The present study employed COHERENS model as a three-dimensional hydrodynamic model to address the coastal currents in the western Persian Gulf with a horizontal resolution of 2-minutes of latitude and longitude.The obtained results suggested that Iranian northwestward coastal currents developed from January to April and experienced their maximum intensity from June to August when the rate of the surface inflow current increases through the Strait of Hormuz and the stability of the seasonal thermocline becomes gradually stronger.The simulation results reflected that expansions of the thermocline area began by the arrival of the warm season.Under such circumstances, some stronger coastal currents were generated in summer.The strong coastal surface current in the vicinity of the western part of Iranian coasts flew southeastward, while the reverse current flew with a northwestern direction in the seabed.The obtained results suggested that a consequence of the influence of salinity flux, especially on the Iranian coasts, the speed of currents increases.The findings of this study showed that more kinetic energy was accumulated along Iranian coasts.Moreover, the current vectors on Iranian coasts were greater than those on Arabian coasts, which in turn resulted in the creation of the upwelling currents along western Iranian coasts.
Keywords: Coastal Currents; COHERENS Model; Numerical Simulation; Persian Gulf (PG); Upwelling.
1.Introduction
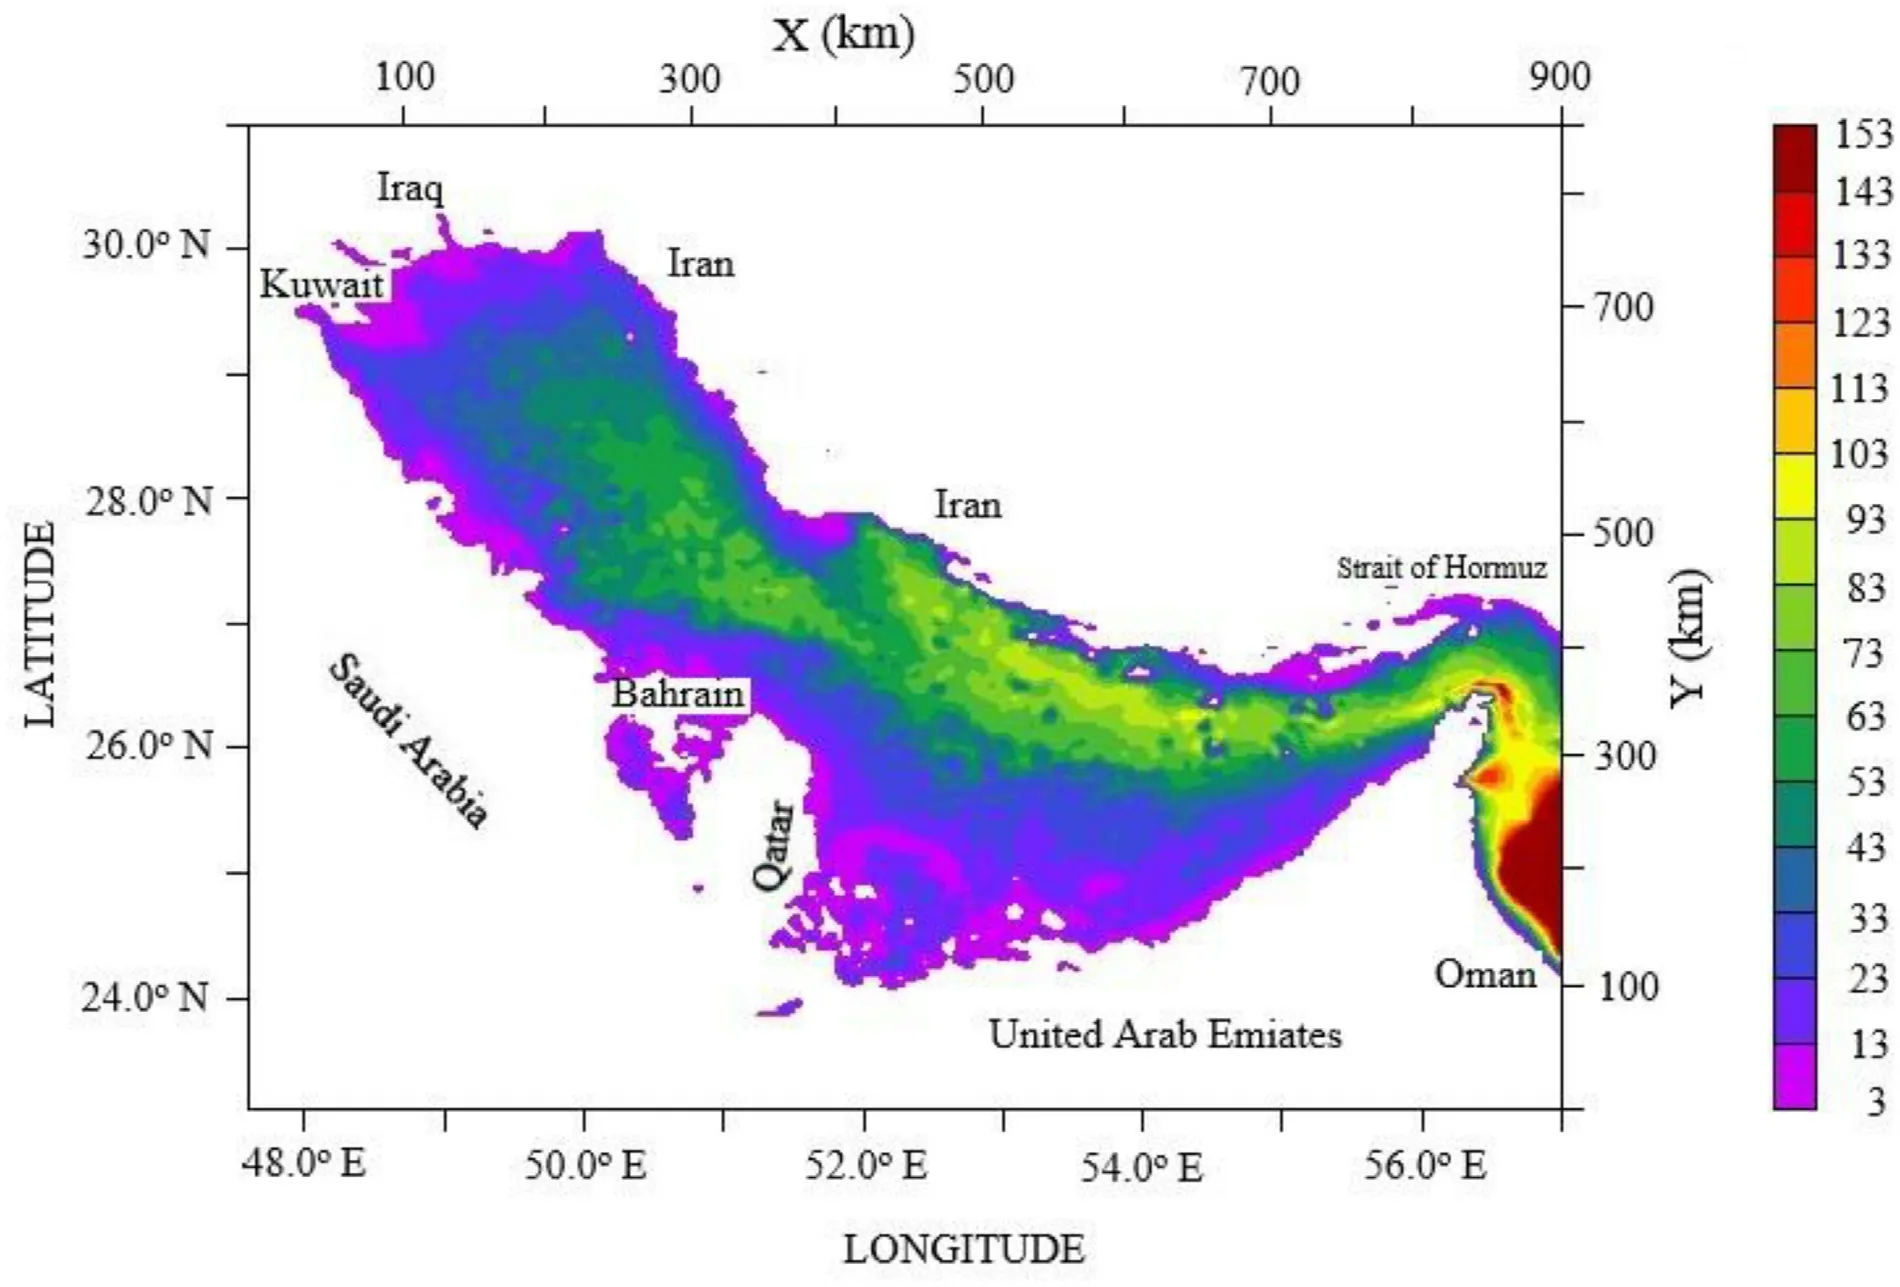
Fig.1.Geometry and location of the coastline based on ETOPO-2 data with a horizontal resolution of 2-minutes latitude and longitude.
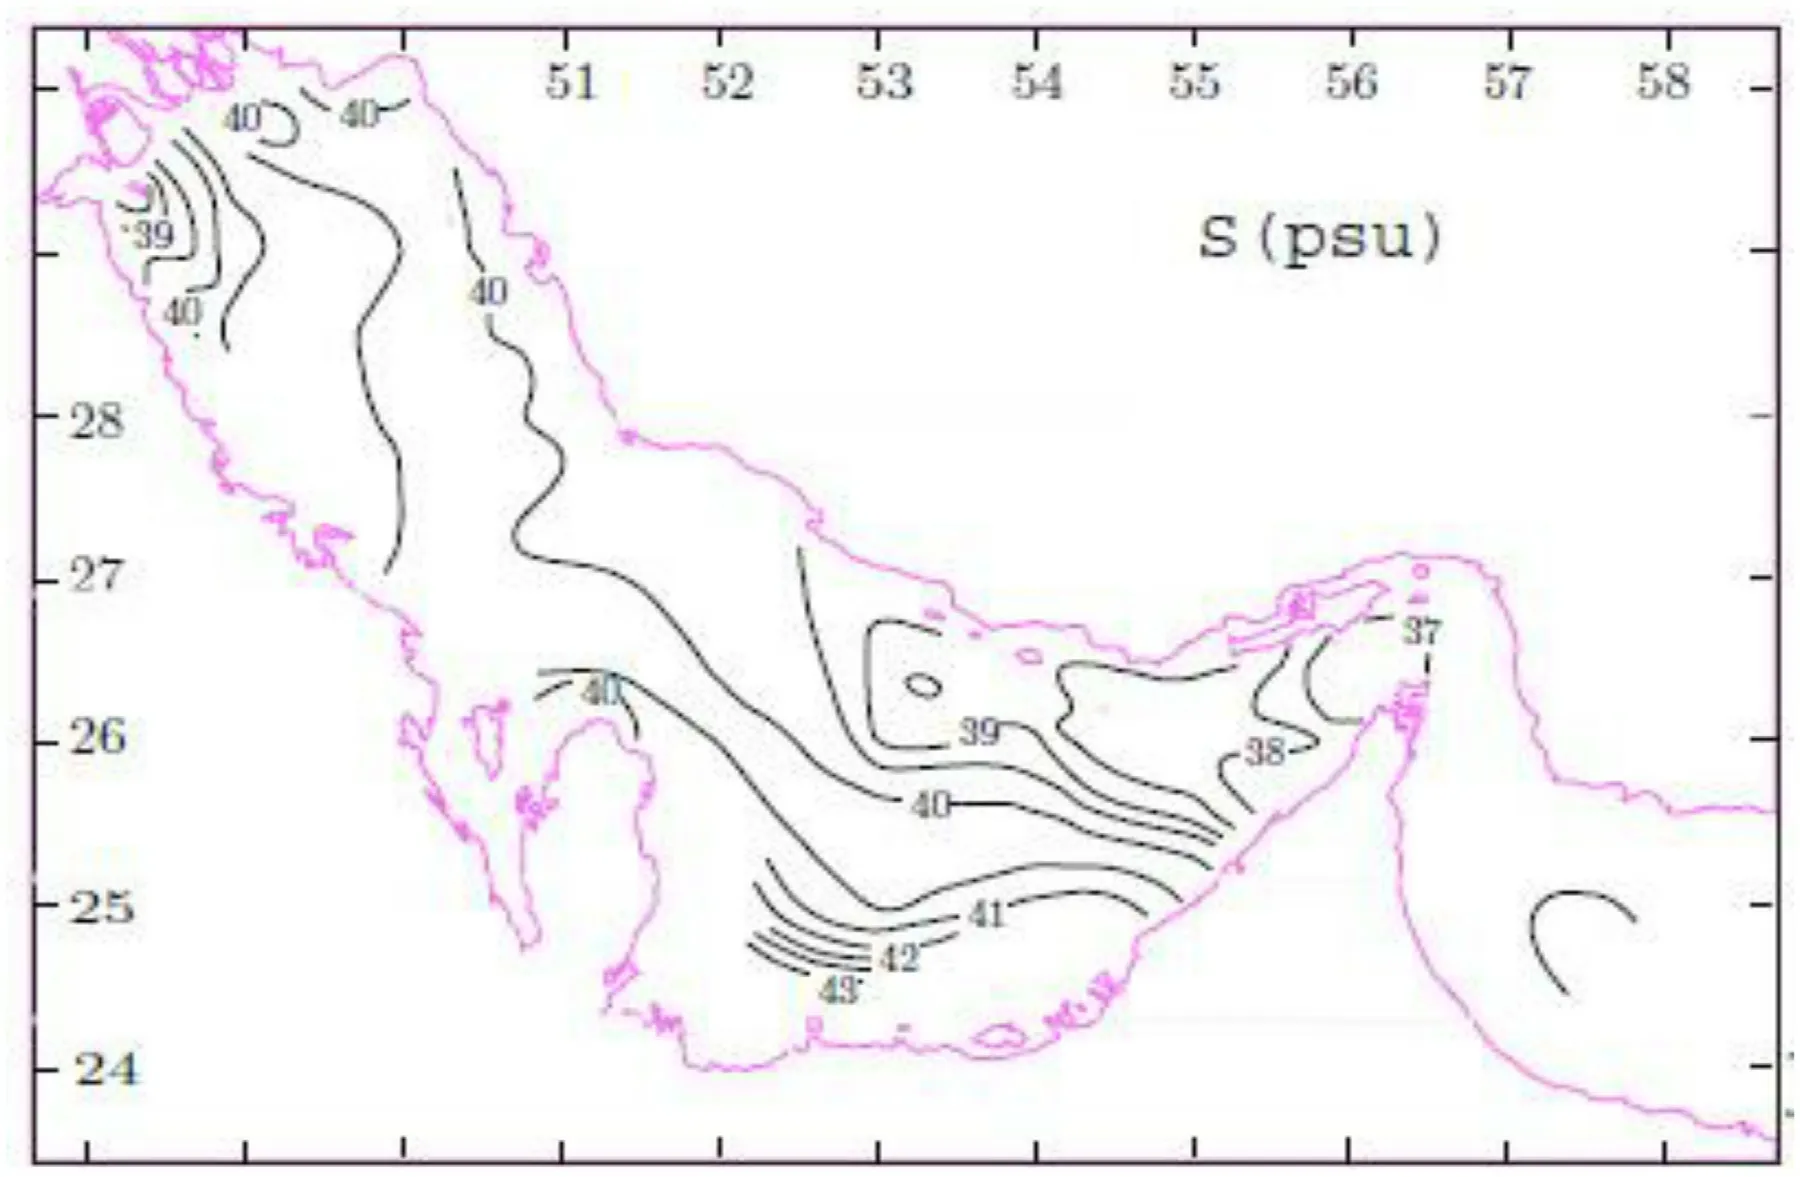
Fig.2.The map of surface salinity in winter [16] .
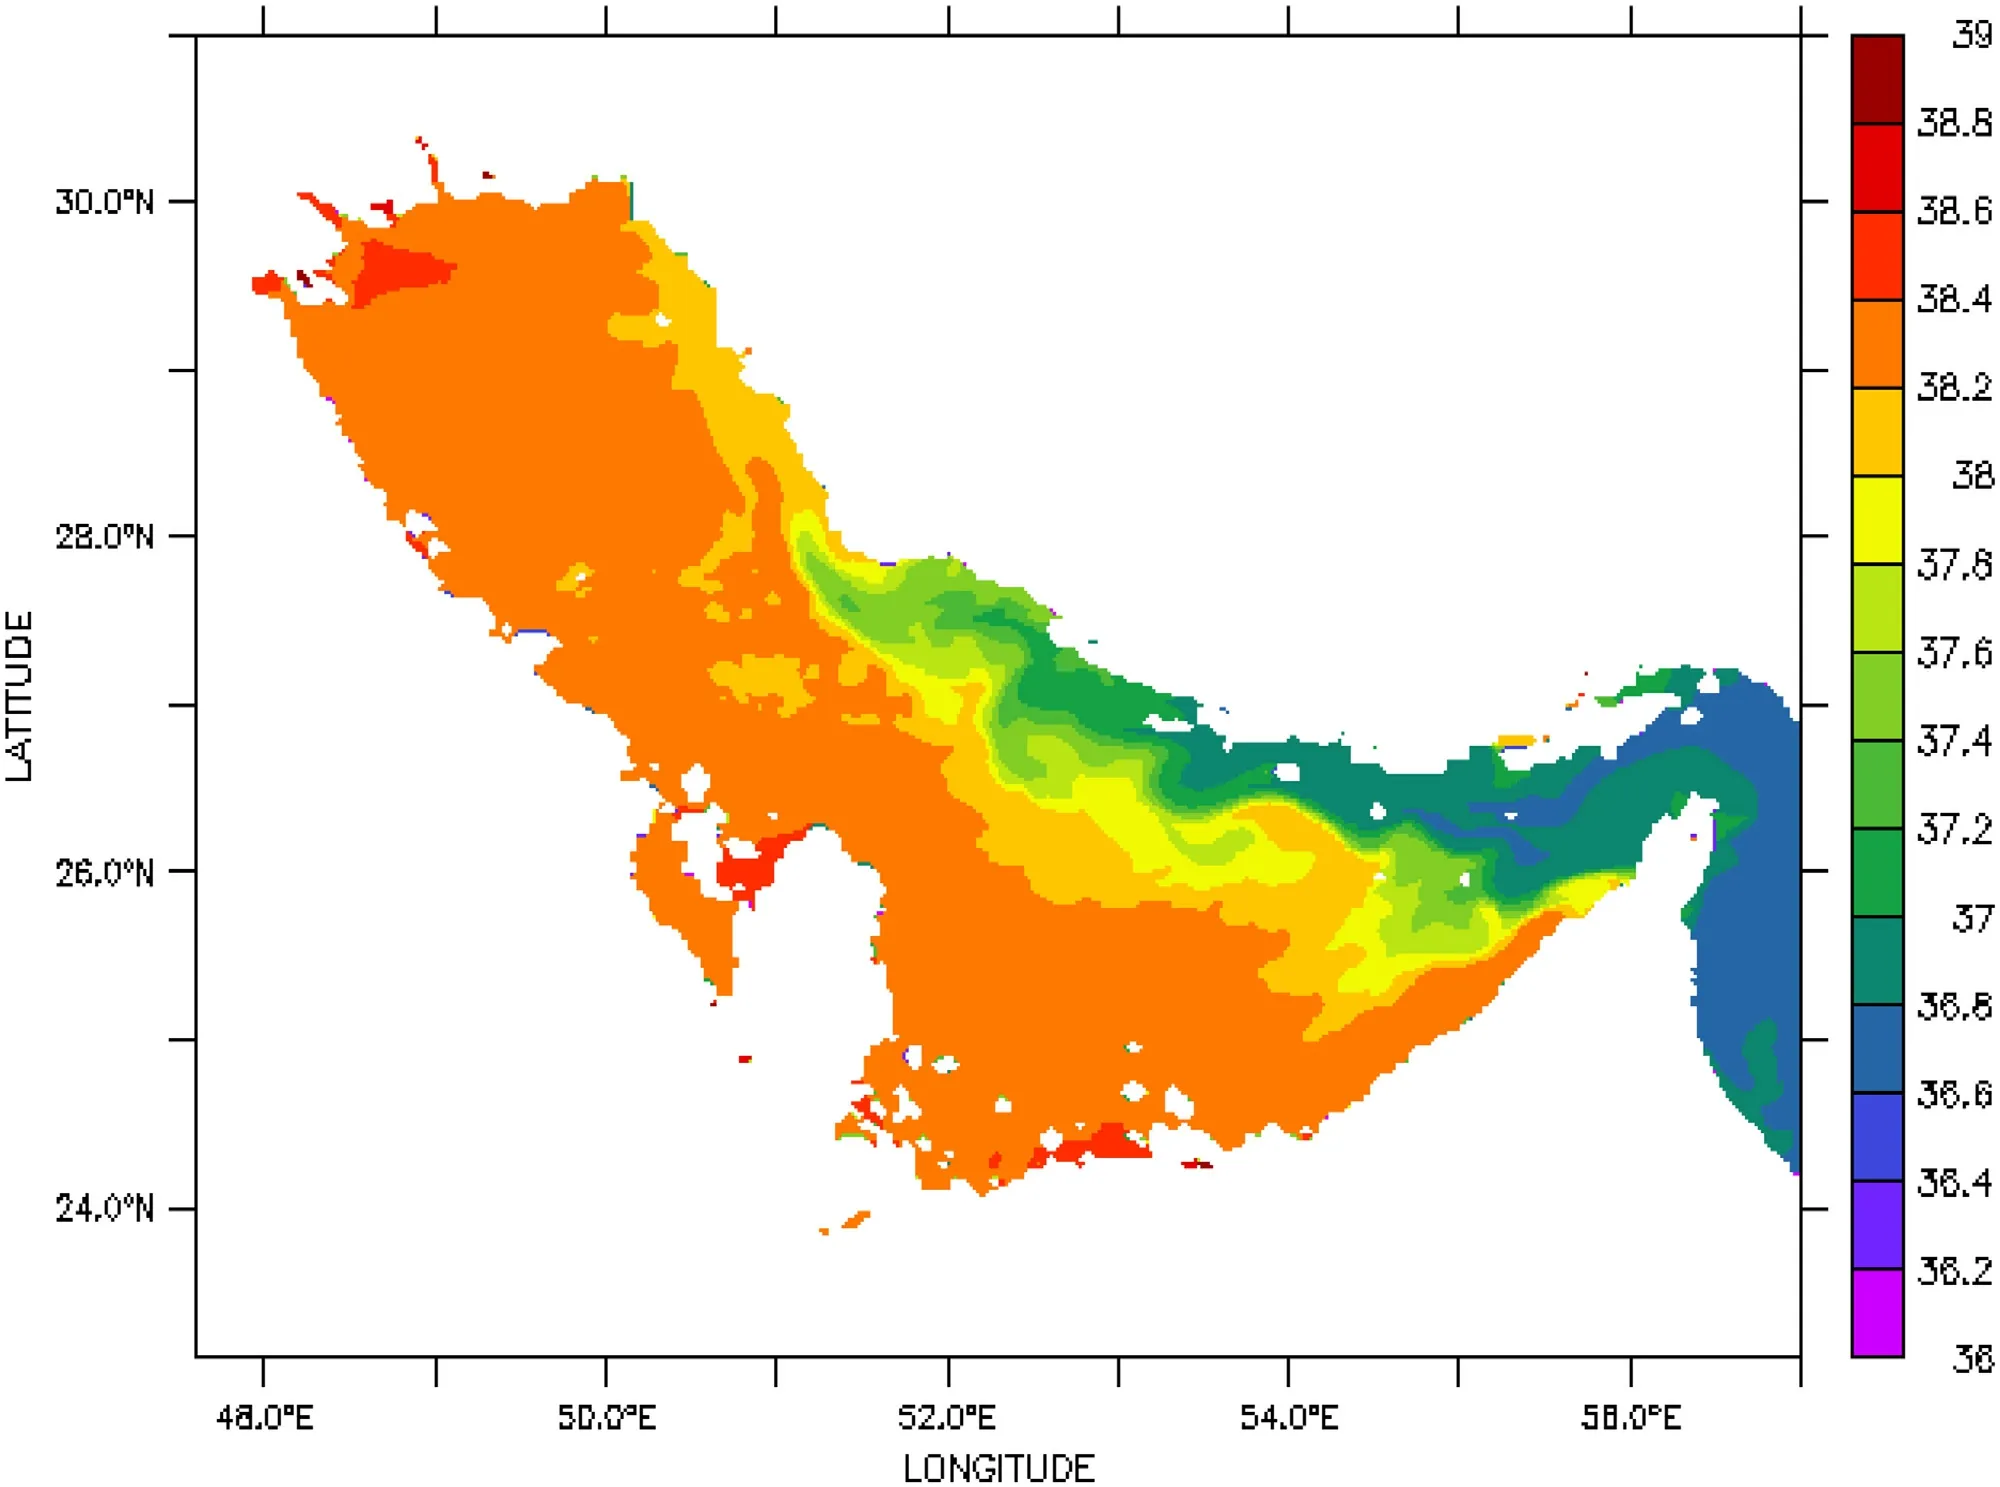
Fig.3.The mean of simulated salinity in winter.
Persian Gulf is a semi-closed shallow basin with a depth of about 35 m and is connected to the Sea of Oman through the Strait of Hormuz [1] .The circulation of the Persian Gulf is firstly dependent on northwestern prevailing winds, buoyancy flux, and its momentum, is secondly related to thermohaline circulation, and is finally affected by tidal effects.Generally, the basin-scale gyres in the Persian Gulf are cyclonic and in- clude the following two parameters: 1.Iranian coastal currents that flow northwestward and cross the Strait of Hormuz along the northern boundary of the basin with a speed of more than 10 cm/s and 2.The currents in the southern part of the Per- sian Gulf that flow southeastward.A large number of these currents are generated by the pressure gradient rather than being affected by the northwestern winds.Tidal effects can be ignored in this regard except in the Strait of Hormuz and along the Iranian coasts [2] .Thoppil and Hogan [3] , similarly, simulated northern wind effects in the Persian Gulf in winter and investigated the northern wind events from 20 November to 5 December as the most suitable time interval.They indi- cated that the occurrence of northern winds can result in cool- ing of the surface water up to more than 10 °C in the north- ern and shallow areas.The results of their model revealed that extreme winds not only induced the general circulation of the Persian Gulf but also generated the northwestward cur- rents from the Strait of Hormuz to 52 °E toward the Iranian coasts with a speed of 25-30 cm/s [3] .Kampf and Sadrinasab [4] simulated the general circulation of the Persian Gulf.The findings of the mentioned study revealed a constant pattern of a clockwise current in the northern coast of the Persian Gulf, which included a resistant coastal jet stream flowing south- eastward with a maximum speed of 10 cm/s along the Iranian coast.Hosseinibalam et al.[5] used COupled Hydrodynami- cal Ecological model for REgioNal Shelf seas (COHERENS) to estimate the circulation of the Persian Gulf that was af- fected by the wind stress and thermohaline surface flux.The results of the mentioned model indicated a correlation be- tween the rate of output currents flowing through the bottom of the Persian Gulf and the input surface currents flowing from the Indian Ocean Surface Water (IOSW) into the Per- sian Gulf.They demonstrated that the heat fluxes played a prominent role in the general circulation of the Persian Gulf.Wind stresses generated southeastward surface currents with a speed of 5 cm/s along the Iranian and Arabian coasts in the Persian Gulf during spring and summer.By Razavi et al.[6] a comprehensive measurement program is designed whose main objective is to collect sufficient and reliable input data for current forecast simulations in the Persian Gulf which in turn would provide reliable and realistic current parameters, by employing 3D hydrodynamic modeling.The results of this research are of help to understand the gulf-scale processes of the Persian Gulf.Torabi Azad and Mehrfar [7] estimated the variability of the coastal jet stream in the Persian Gulf and indicated that formation of the coastal jet stream was related to the pressure gradient.As the dynamics of such transports are non-quasi-geostrophic and non-linear, the value of dimen- sionless Rossby number can be considered as 1.In addition, the transport of the water mass toward the Iranian and Arabian coasts due to the geostrophic balance as well as the blow of the prevailing northwestern winds could generate two strong jet streams on the margins of the involved regions.
In this research, first the target area, the model settings, and some forces applied to the simulation of the model were introduced.Subsequently, the results of the simulation of the coastal currents, the formation of coastal jets over different months and seasons, and upwelling in the western Persian Gulf at a basin-scale setting were provided.
2.Materials and Methods
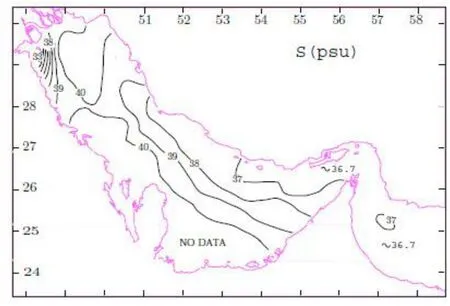
Fig.4.The map of surface salinity in summer [16] .
A COHERENS numerical model was used to simulate the currents.The studied region contained the Persian Gulf and one part of the Sea of Oman between 23.1 to 31 degrees north and 47.6 to 57 degrees east.The geometry and loca- tion of the coastline were smoothed based on the ETOPO- 2 data with a horizontal resolution of 2-minutes of latitude and longitude.To eliminate the numerical instability of the model, the minimum and maximum depth were considered to be 3 meters on the coastline and 150 meters in the Sea of Oman respectively, which had no significant impact on the obtained results ( Fig.1 ).In order to use the multi-layered models with a non-level bottom, it was necessary to have a vertical array that considered the entire oceanic zone as a unique layer.Consequently, a vertical sigma array was used in the present study.In fact, it helped the researchers to con- sider the same number of layers all over the target region [8 , 9] .In a vertical coordinate system with a vertical sigma array, there are an equal number of vertical columns of wa- ter at each depth of the water volume.In the present study, 10 vertical layers were considered for sigma.To provide the Courant- Friedrichs-Lewy (CFL) stability condition for two- dimensional and three-dimensional simulations, time intervals of 20 and 600 seconds were selected, respectively.Consider- ing that the k-1 Mellor-Yamada turbulent closure [10] has a higher range than k-e model and according to the previous findings [4 , 11–13] , a k-1 model of turbulence was used in this study.Additionally, the formulation of the Smagorinsky model was applied to the horizontal distribution plot [14] .The average of the daily atmospheric forces (wind speed compo- nents, air temperature, relative humidity, cloud cover, precip- itation, and river discharge) was calculated over a period of 50 years (1960-2010) on the basis of the NOAA data and was then applied to the model.The salinity resource, tem- perature resource, and density were considered as 38 psu, 22 °C, and 1027 kg/m3, respectively [15 , 16] .Under the above- mentioned conditions, a climatic stability was obtained during the running of the model over 10 years.The results extracted from the data obtained in the 10th year were used to study the seasonal variations of the Persian Gulf currents in this research.
3.Results
3.1.Verification of the simulated results
To verify the model, the salinity field was extracted from the surface to the depth of 15 m in winter and summer and was compared with the results of Reynolds [17] ( Figs.2–5 ).Although the model underestimated the maximum salinity, the salinity distribution pattern was consistent with the ob- tained results.Mohandsi et al.[11] showed that the selection of turbulence schemes was effective for estimating salinity.The mentioned study also revealed that the k-l schema fitted the salinity field in the Persian Gulf better than the other tur- bulence schemes in the COHERENS model that was used in this study.
3.2.Formation of the Coastal Currents
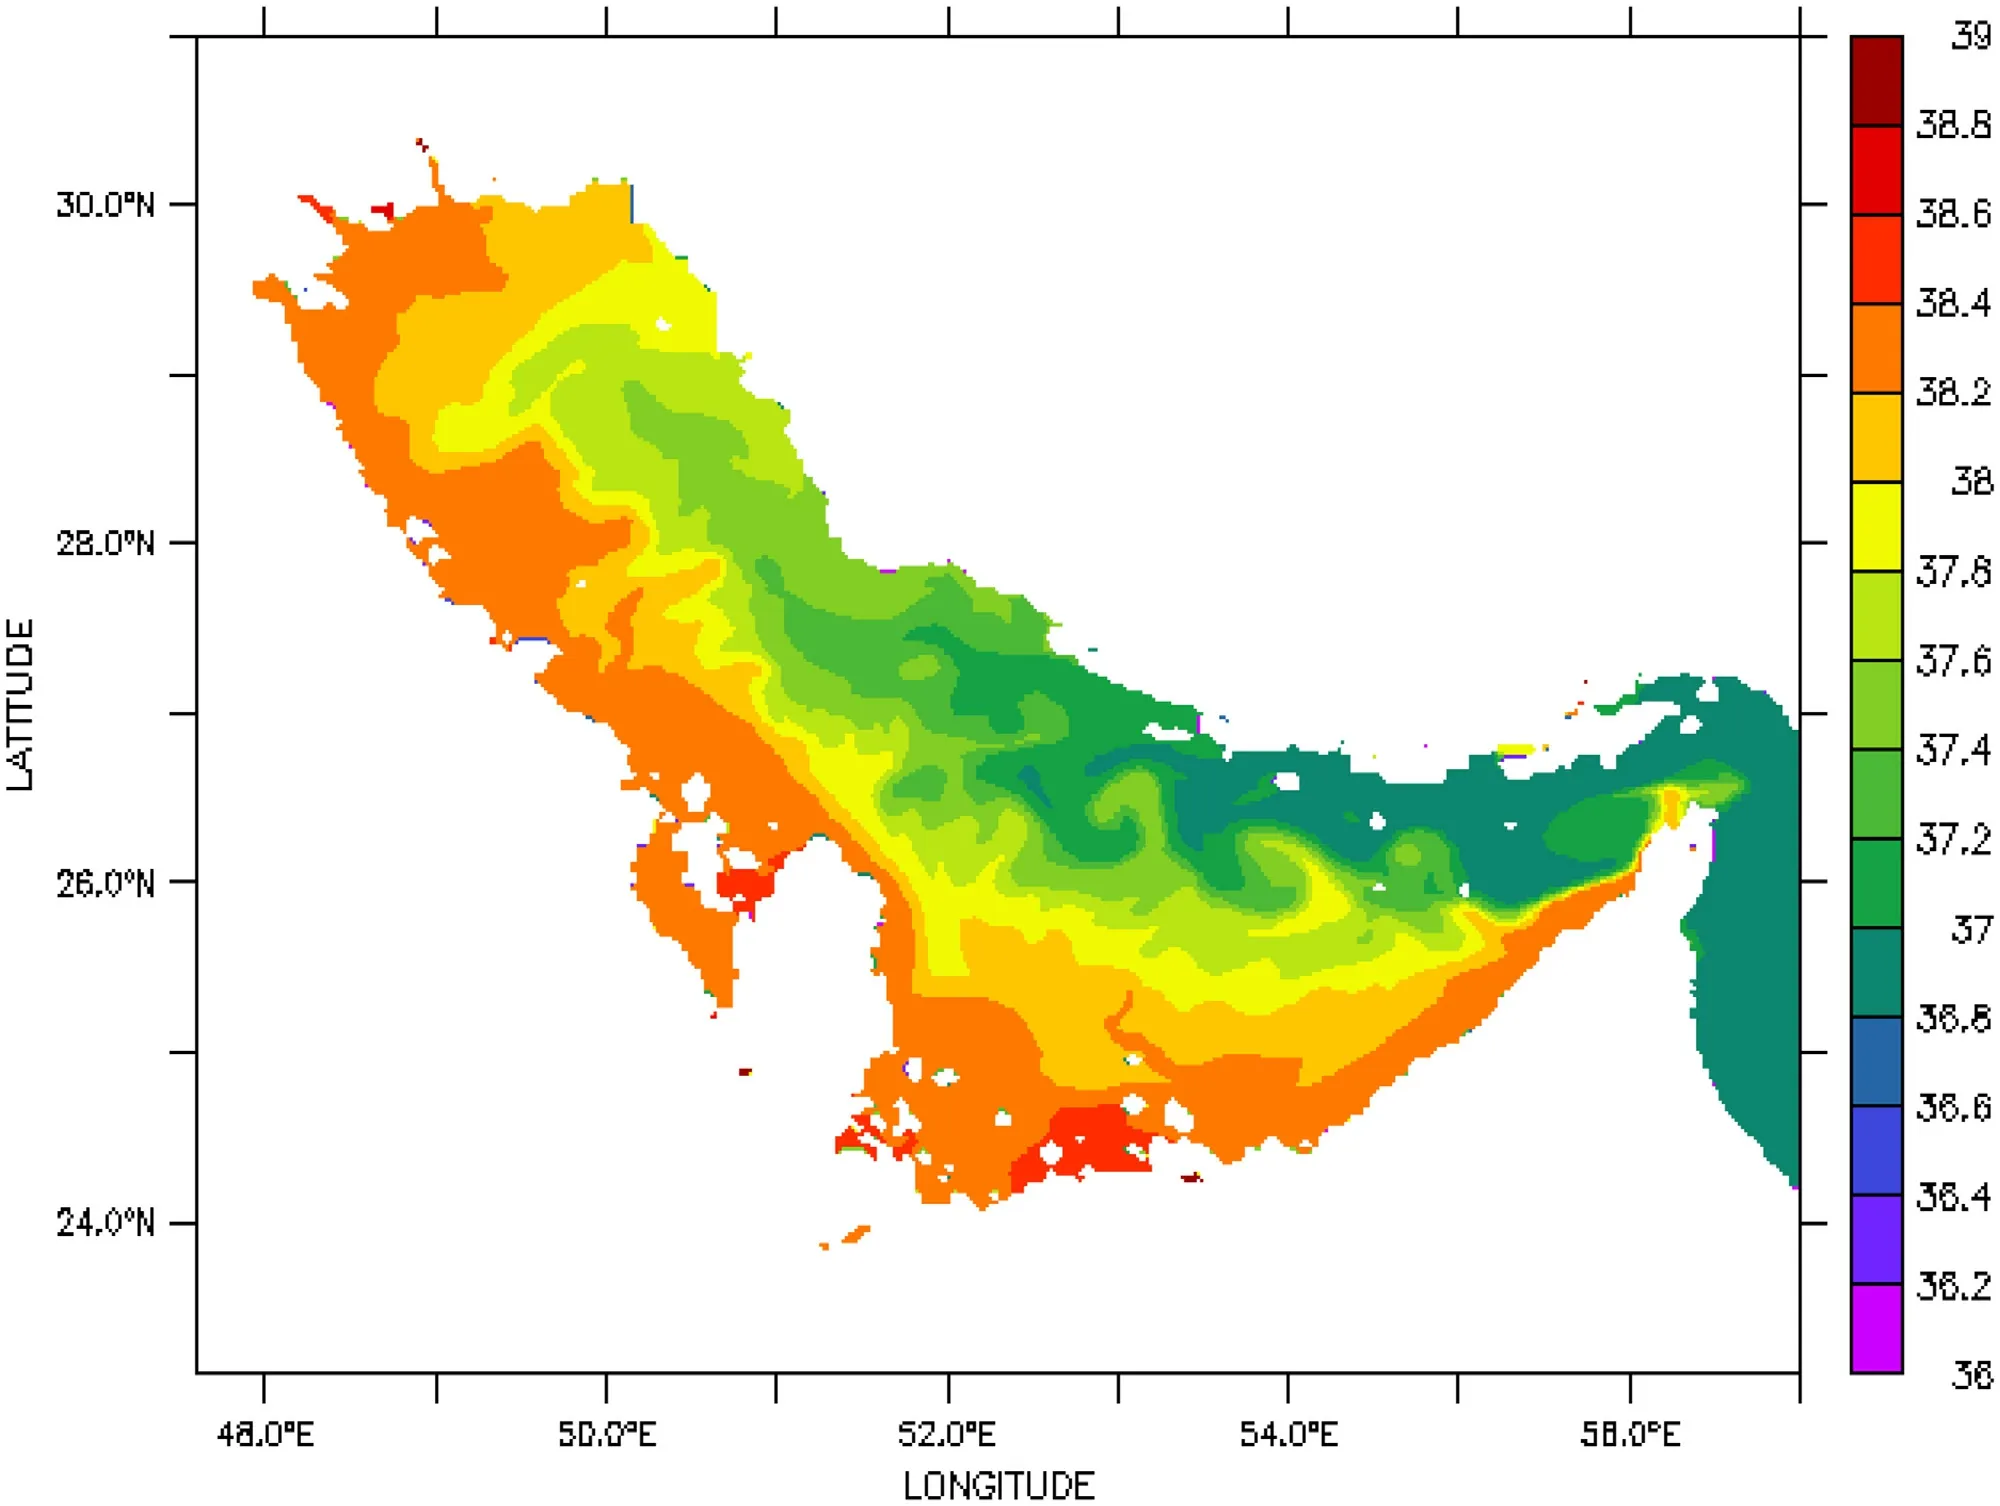
Fig.5.The mean of simulated salinity in summer.
Fig.6 (a-f) represent the simulation results of the current vectors in the Persian Gulf.Average daily wind datasets were applied to the model during a climatological period of about 50 years.In the basin-scale setting, the results of the em- ployed model in this study were similar to the general cir- culation and were in a good agreement with the observations of Reynolds [17] and previous studies [2 , 11] .The northwest- ward currents on Iranian coasts were developed from January to April ( Fig.6 a,b).The mentioned currents experienced the maximum rate during June-August ( Fig.6 c,d) when the in- flow surface current through the Strait of Hormuz gradually became stronger in response to creation of seasonal thermo- cline.As the provided figures indicate, typically, the surface currents in summer were stronger (10-20 cm/s) than those in winter (5 cm/s).The weaker circulation in winter was formed due to both the decrease of density gradient between the Per- sian Gulf and the Sea of Oman and the decline in stratifica- tion by winter cooling ( Fig.7 ).In summer, the Iranian coastal currents became gradually stronger due to the increments of inflow from the Sea of Oman to the Persian Gulf, increase of stratification, and reduction of wind speeds and spread to the northern part of the Persian Gulf.The simulated current vectors ( Fig.6 a-f) reflected the initiation of increases in the current speeds that was synchronized with the arrival of the warm season.Obviously, when the ocean absorbed the heat from the atmosphere and developed the strong water column stratification, thermocline expansion increased ( Fig.8 ), which in turn led to the limitation of the vertical mixing under weak prevailing wind conditions in this season.Then, the pressure gradient was generated by the dense water (lower saline wa- ter) in the northern (southern) head of the Persian Gulf and drove the lower saline water from the Sea of Oman into the Persian Gulf through the Strait of Hormuz.Under these con- ditions, stronger coastal currents were formed.The results of water movement and measurements in the Persian Gulf revealed that coastal jet was found on both Iranian and Ara- bian coasts [7 , 18] .As the simulation results show the flow of water in the Persian Gulf was generally seasonal and de- pended largely on the density gravitation.Since the inflow current of saline water from the Strait of Hormuz met the lower saline water from the northern rivers of the Persian Gulf, a region named “front” was formed in the middle area and was followed by the baroclinic instability.Consequently, the transfer of the water volume caused by geostrophic equi- librium toward the Iranian and Arabian coasts and the blow of the prevailing northwestward winds resulted in the appear- ance of coastal jets in these areas.The coastal jet near Iranian coasts is only limited to the surface and moves southeastward.But, the coastal jet in the vicinity of Arabian coasts com- pletely appears all over the water column, from the surface to bottom, and moves southeastward (in Fig.6 , 1d, the red vec- tors represent the coastal jet).
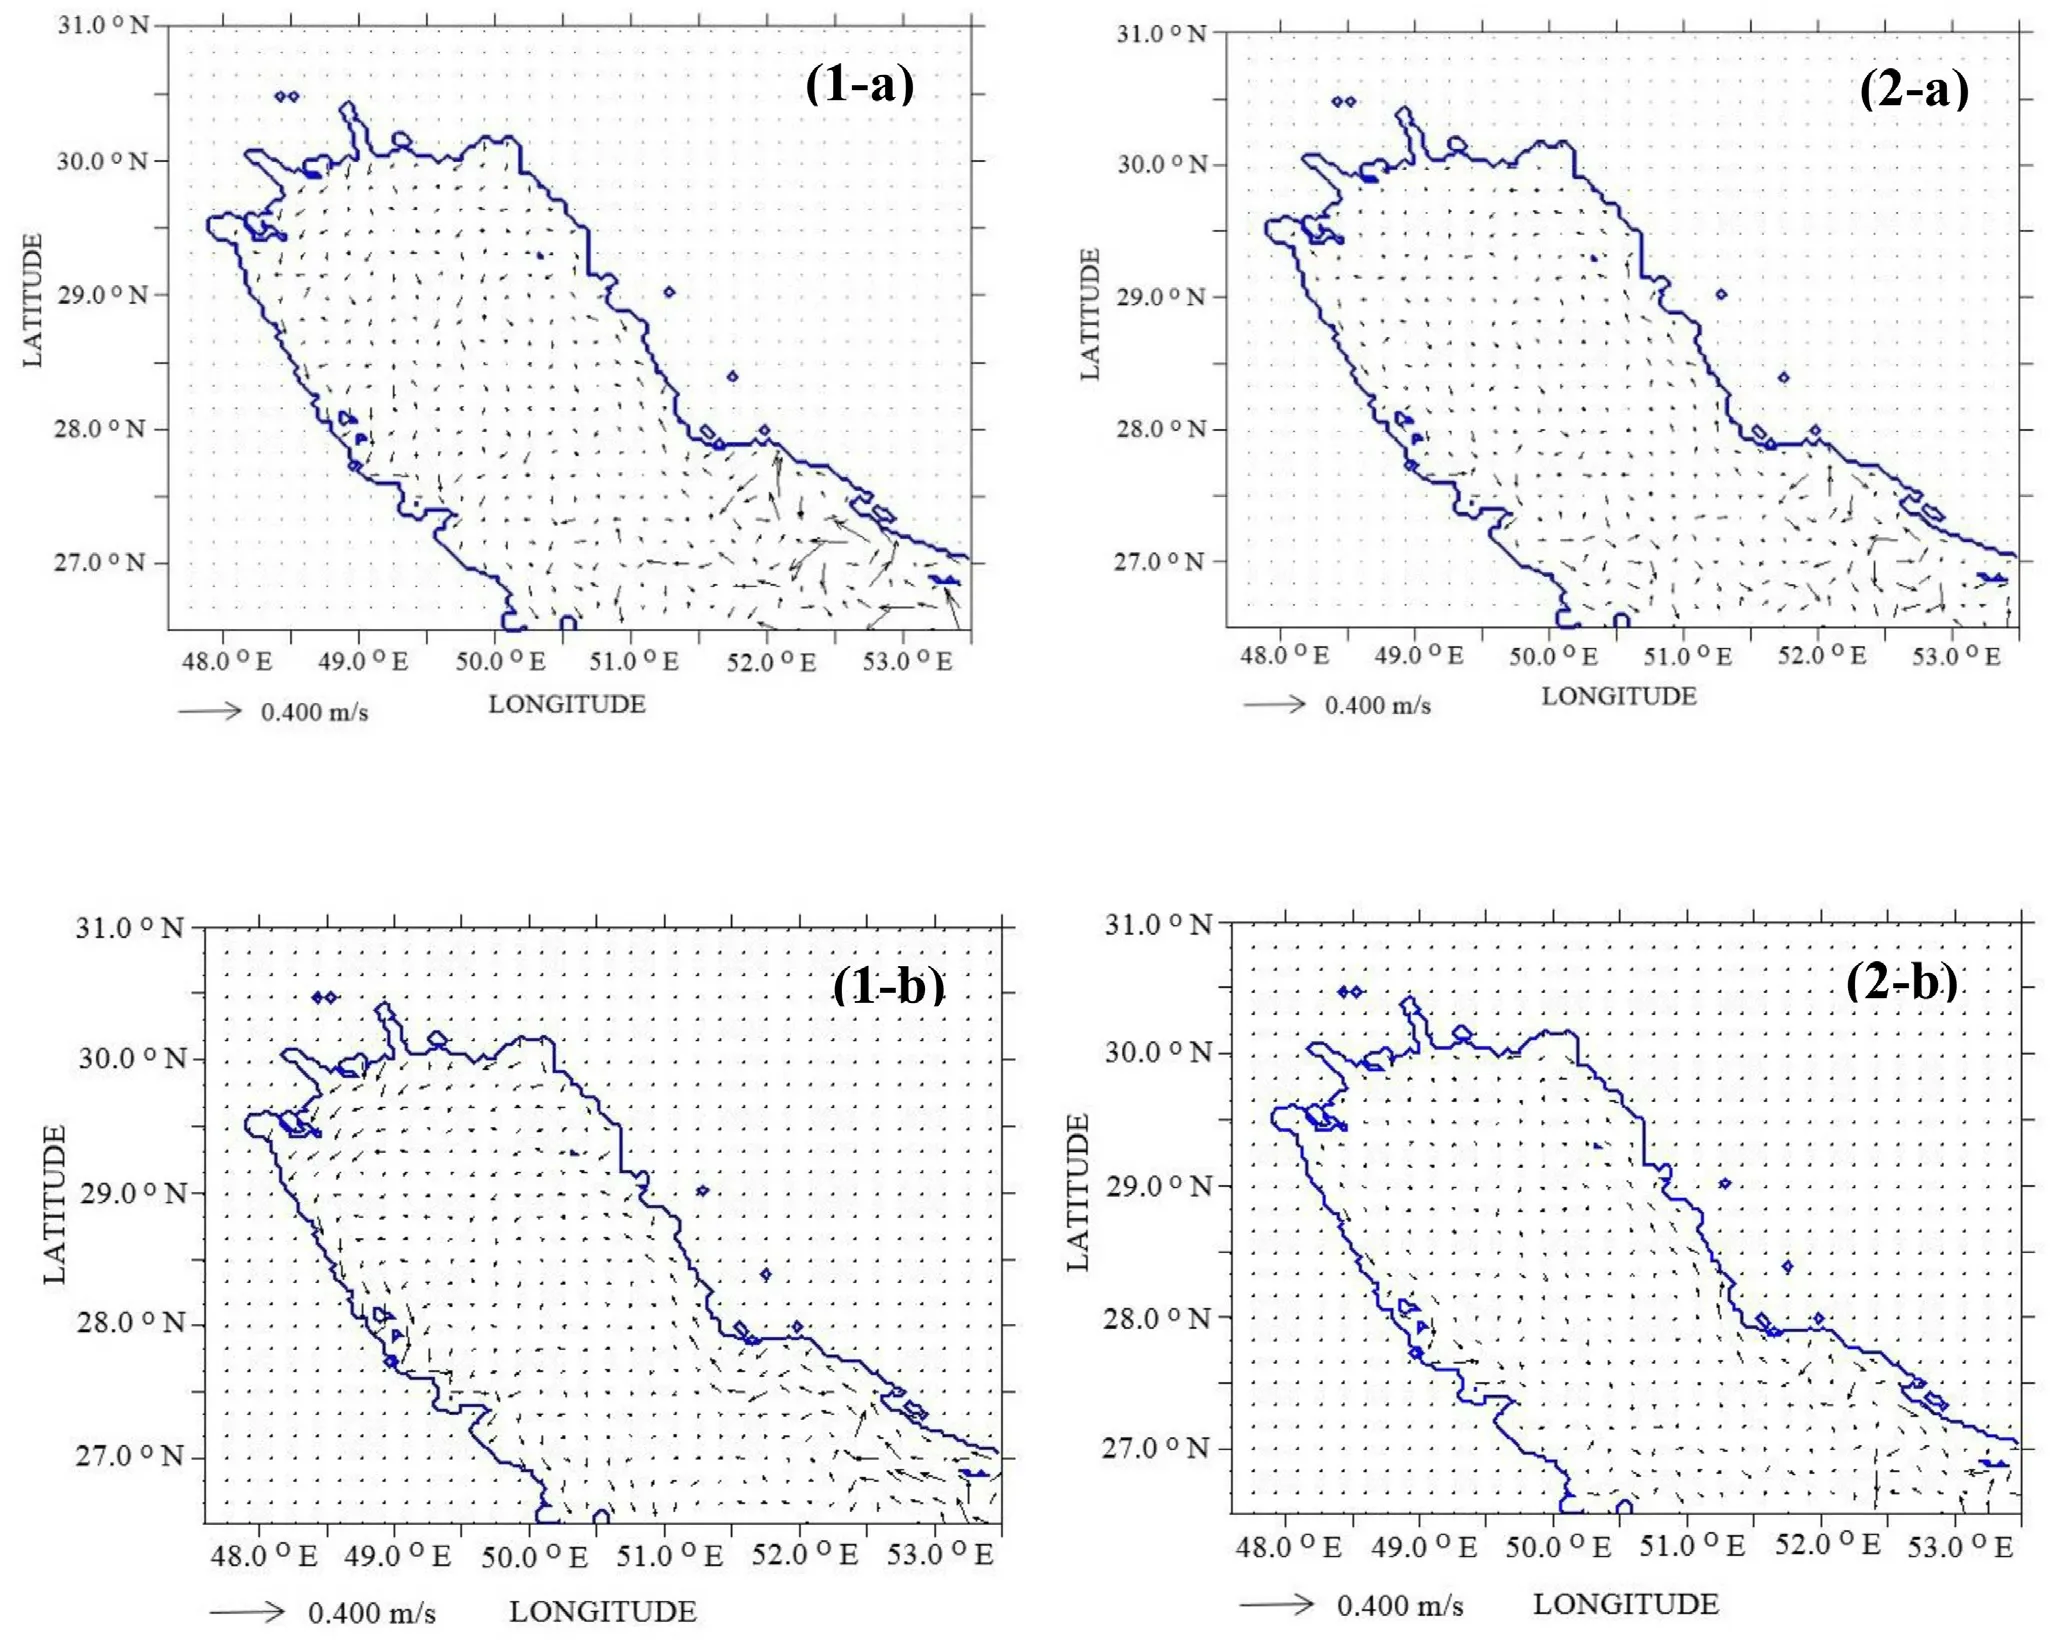
Fig.6.Current vectors in the western part of the Persian Gulf in the surface (1) and sea bed (2); (a) January, (b) April, (c) June, (d) August, (e) September, (f) December.
3.3.Kinetic Energy and Upwelling Current
Reynolds [17] represented some documents about the existence of an upwelling current in the Iranian coasts (see Fig.9 ) [17] .Figs.10–12 illustrate the kinetic energy and current vectors in three cross-sectional areas between y = 609 and y = 668 (the coordinates in meters are shown in Fig.1 ) in the late March.On the Iranian coasts, the kinetic energy and current vectors were bigger than the Arabian coasts (right-hand of Figs.10 –12 ).The mentioned current vectors turned upwards and indicated an upwelling current along the western coasts of Iran.On the other side (left-hand of the Figs.10 –12 ), the directions of the vectors with more inten- sity turned downward, which could result in a downwelling current in this region.These results corresponded closely with observations of Reynolds [17] .
4.Discussion
General circulation and coastal currents in the western Persian Gulf were simulated using COHERENS model by applying the average daily climatic data with 2-minutes hori- zontal resolution during a period of about 50 years.The field of horizontal currents strongly depends on the hydrography fields, especially the field of salinity.Surface salinity fields clearly demonstrate seasonal variations in the influx of water from Indian Ocean and its conversion into saline water.There are extreme seasonal variations in addition to the general wa- ter circulation in the Persian Gulf.When the winds are mild and seasonal thermocline is formed in summer and spring, the currents become stronger on the coast and can be spread to the north end of the Persian Gulf, and a lower saline plume brings the water to the width of 28N.As a consequence of the influence of salinity flux, especially on the Iranian coasts, the speed of currents increases.The speed of currents represents a decreasing trend from January to March and then increases from May.This trend continues until June and July and once more begins to decline in August.The rate of northwestward Iranian Coastal Currents (ICC) increases in January-April and reaches its maximum rate in June-August when the rate of the surface inflow current increases through the Strait of Hormuz and the stability of the seasonal thermocline becomes gradually stronger.Weaker circulation in winter is due to both the reduction of the density gradient between the Persian Gulf and the Sea of Oman and the weak stratification during winter cooling period.A good agreement was ob- served between the simulation results of the present study in March and those of Reynolds [17] and Pous et al.[19] about an upwelling current in the western coast of the Persian Gulf.
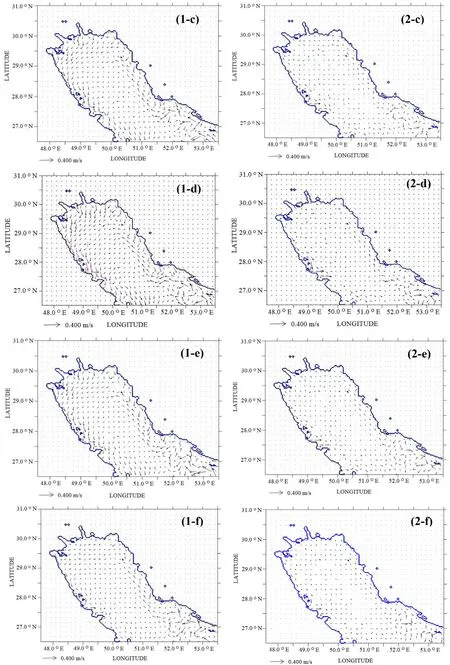
Fig.6.Continued
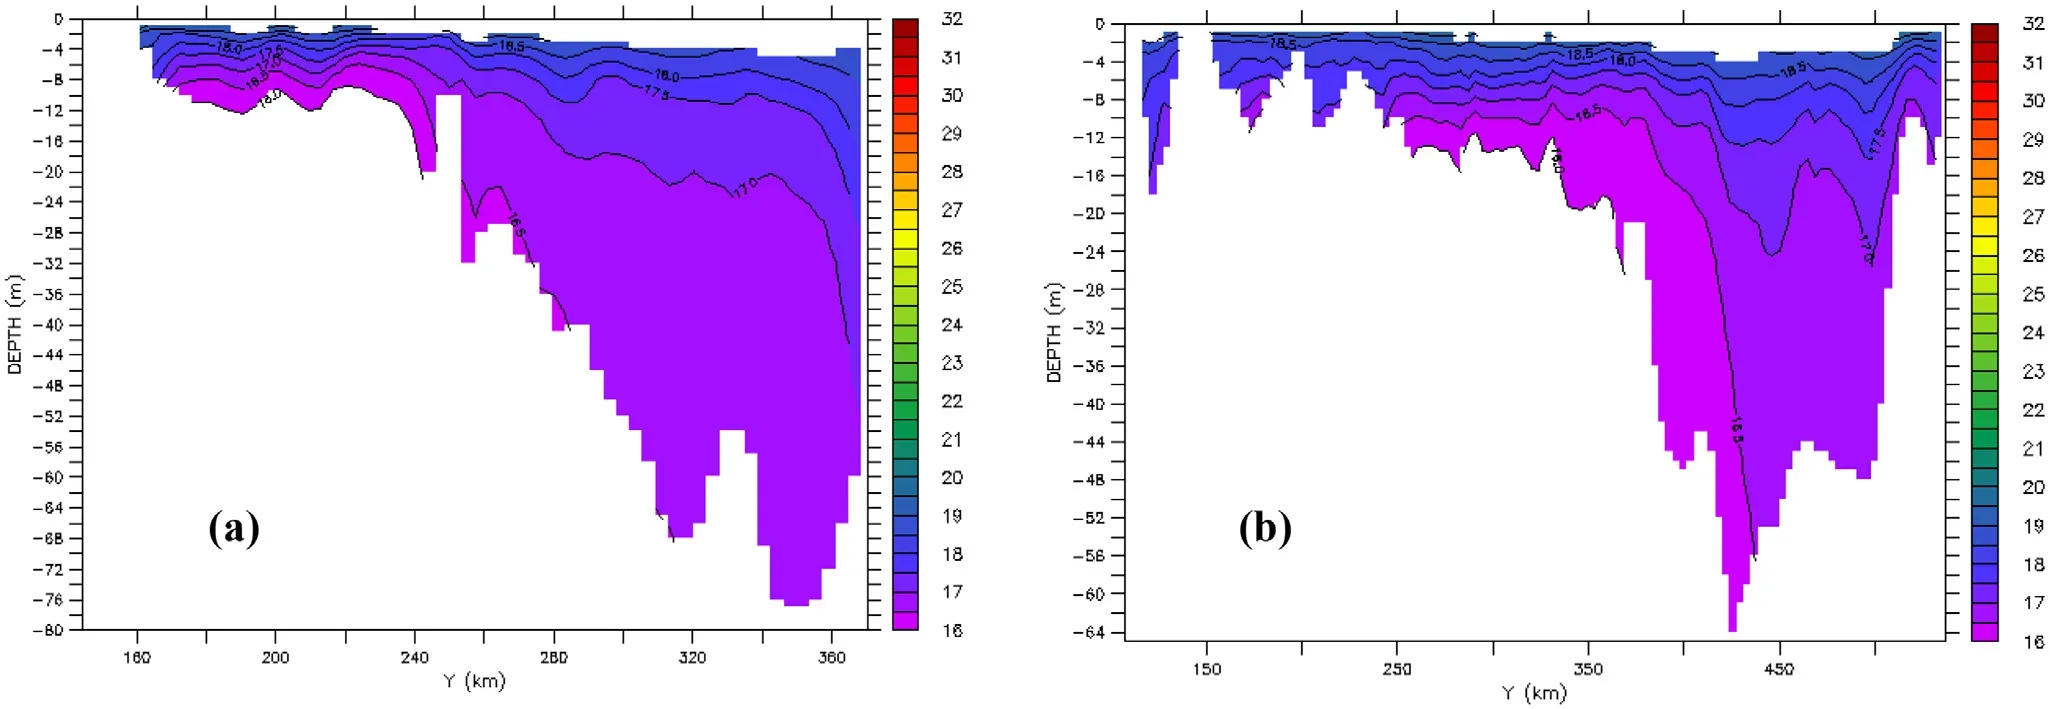
Fig.7.Thermocline in the western part of Persian Gulf; (a) x = 130, (b) x = 200 in February.(the coordinates in meters are shown in Fig.1 ).
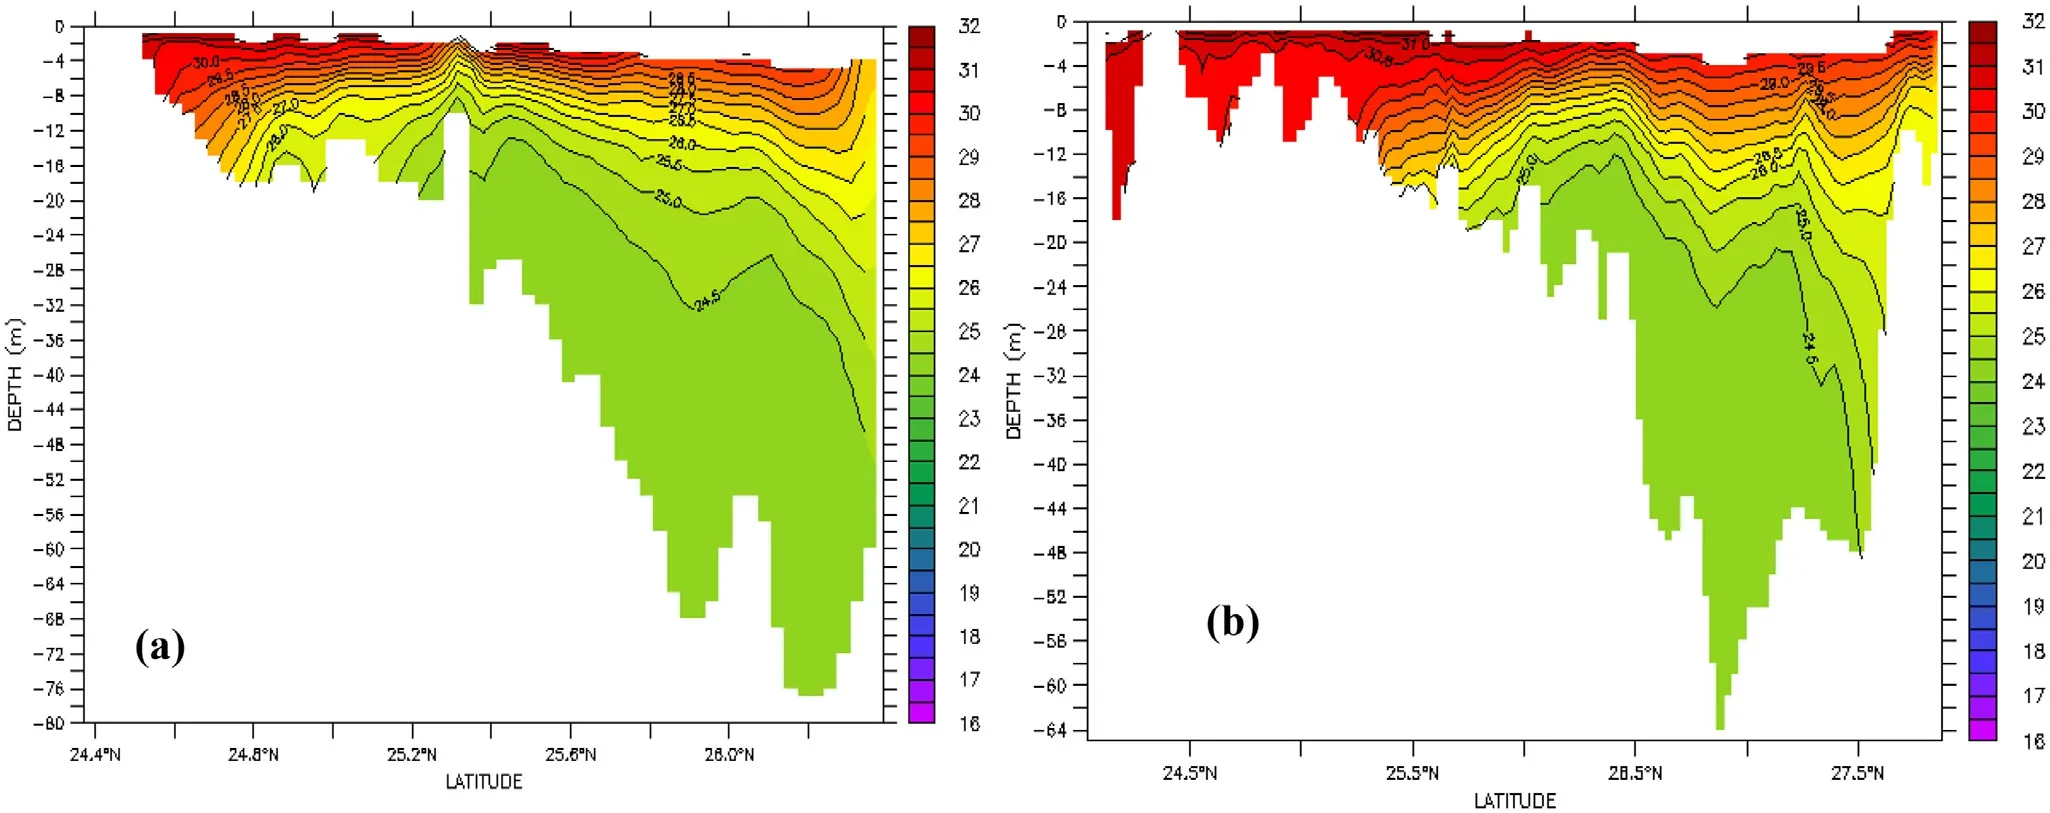
Fig.8.Thermocline in the western part of the Persian Gulf; (a) x = 130, (b) x = 200 in July.
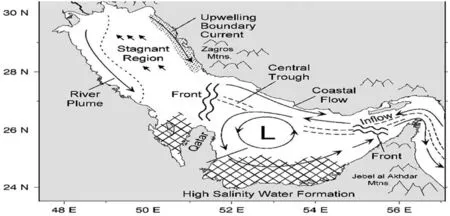
Fig.9.A schematic representation of the current trends in the Persian Gulf [16] .
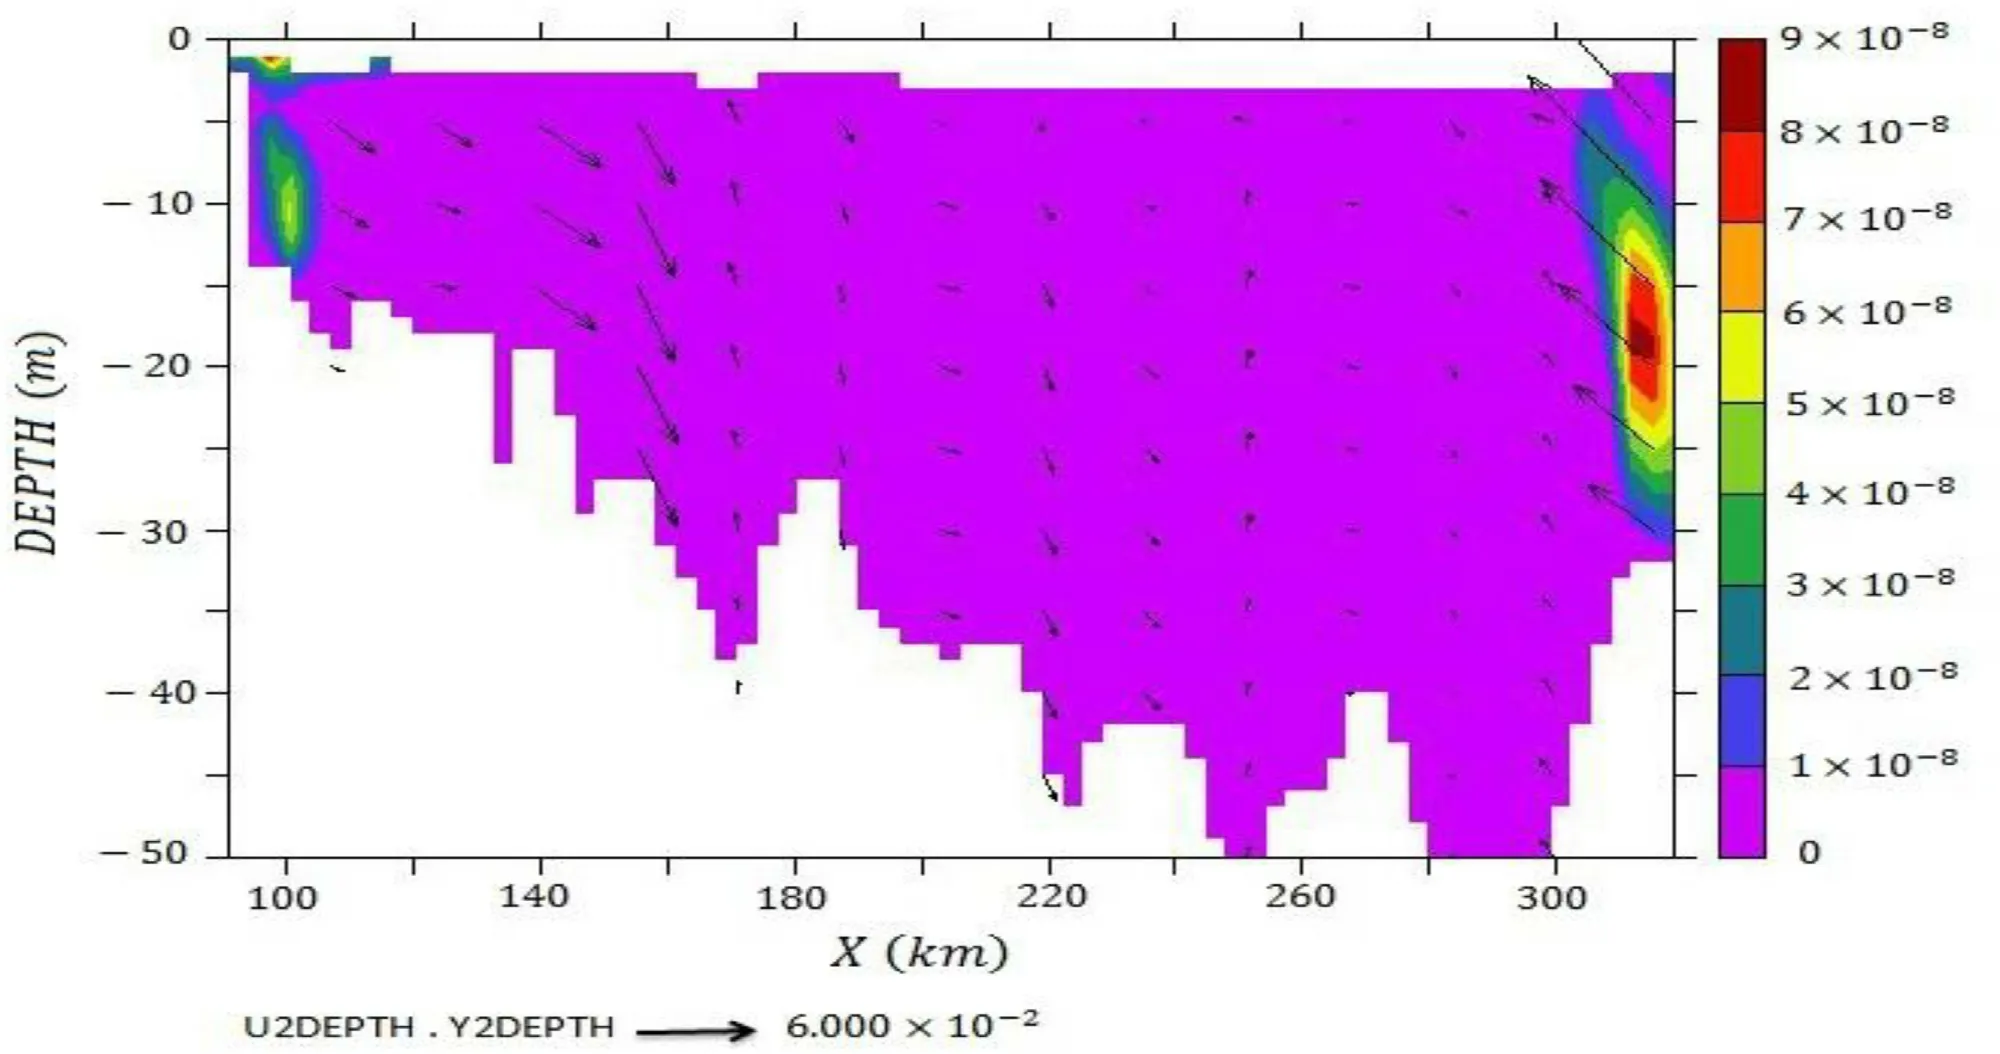
Fig.10.Transversal profile of the kinetic energy and current vectors in the northwestern part of the Persian Gulf in y = 609.
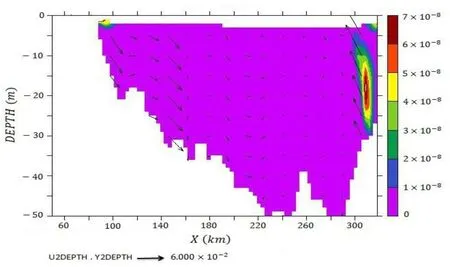
Fig.11.Transversal profile of the kinetic energy and current vectors in the northwestern part of the Persian Gulf in y = 668.

Fig.12.Transversal profile of the kinetic energy and current vectors in the northwestern part of the Persian Gulf in y = 630.
5.Conclusion
Northwestward ICC rates increase from January to April, and reach their maximum from June to August, when the rate of surface inflow current increases through the Strait of Hor- muz and the stability of seasonal thermocline becomes grad- ually stronger.Coastal jet stream in the vicinity of Iranian coasts is limited just into the surface and flows southeast- ward.Continuously, the reverse currents on the seafloor flow northwestward while the coastal jet stream on the Arabian side completely appears all over the water column from the surface to the seabed and flows southeastward.The simulation results revealed the existence of a coastal jet stream during May-October.According to the decreased speed of prevailing northwestern wind in the Persian Gulf, coastal jet streams disappear along the western coasts of Iran and dramatically decrease across the Arabian coasts.The findings of this study revealed that kinetic energy along the Iranian coasts is more than that of the Arabian coasts, and the greater current vec- tors of Iranian coasts demonstrate an upwelling current on the western Iranian coasts.
Declaration of Competing Interest
None
 Journal of Ocean Engineering and Science2020年4期
- Journal of Ocean Engineering and Science的其它文章
- Crashworthiness assessment of thin-walled double bottom tanker: Influences of seabed to structural damage and damage-energy formulae for grounding damage calculations
- Developing a predictive maintenance model for vessel machinery
- Towards an improved intuitive interface for Remotely Operated Vehicles
- A computationally efficient method for identification of steady state in time series data from ship monitoring
- Analysis of Lakes pollution model with Mittag-Leffler kernel
- Steady and unsteady flow simulation with SRH-2D
