
Characterizing the Urban Tem perature Trend Using SeasonalUnit Root Analysis:Hong Kong from 1970 to 2015
2016-11-25 03:08:27WaiingTOandTatWaiYUMacaoPolytechnicInstituteRuadeLuisGonzagaGomesMacaoSARChina
Advances in Atmospheric Sciences 2016年12期
Wai-M ing TOand Tat-WaiYUMacao Polytechnic Institute,Rua de LuisGonzaga Gomes,Macao SAR,China
Characterizing the Urban Tem perature Trend Using SeasonalUnit Root Analysis:Hong Kong from 1970 to 2015
Wai-M ing TO?and Tat-WaiYU
Macao Polytechnic Institute,Rua de LuisGonzaga Gomes,Macao SAR,China
Thispaper explores urban temperature in Hong Kong using long-term time series.In particular,the characterization of the urban tem perature trend was investigated using the seasonalunit rootanalysisofmonthlymean air tem perature data over the period January 1970 to December 2013.The seasonal unit root testmakes it possible to determine the stochastic trend ofmonthly temperatures using an autoregressivemodel.The test results showed thatmean air temperaturehas increased by 0.169°C(10 yr)-1over thepast four decades.Themodelofmonthly temperatureobtained from theseasonalunitrootanalysis was able to explain 95.9%of the variance in themeasuredmonthly data—much higher than the variance explained by the ordinary least-squaresmodelusing annualmean air temperature dataand other studiesalike.Themodelaccurately predicted monthlymean air temperaturesbetween January 2014 and December2015w ith a root-mean-square percentage errorof 4.2%. Thecorrelationbetween the predicted and themeasuredmonthlymeanair temperatureswas0.989.By analyzing themonthly air temperatures recorded atan urban siteand a ruralsite,itwas found that theurban heat island e ff ect led to theurban site being on average0.865°C warmer than the rural site over the past two decades.Besides,the resultsof correlation analysis showed that the increase in annualmean air temperaturewas significantly associated with the increase in population,gross domestic product,urban land use,and energy use,w ith the R2values ranging from 0.37 to 0.43.
urban temperature trend,urban heat island e ff ect,seasonal unit root tests,long-term time series
1.Introduction
Urbanization is a global phenomenon that has transformed landscapes.According to a study by the United Nations’Population Division(UN,2014),the world’s urban population is projected to increase from 3.9 billion in 2014 to 5.0 billion in 2030,and then to 6.3 billion in 2050.By 2025,7 outof 37megacitiesw ith a population exceeding 10 m illion are expected to be located in mainland China.By 2050,Chinaw ill have the largest urban population,totaling about1 billion.Urbanization transforms lands for residential, commercial,industrial,and transportation purposes.When more people live in a confined space such asa city,theyw ill consumemore energy,resulting in large amounts of emissionsand wasteheat.Moreover,themodified land surfaceof a city a ff ects the storage and radiative and turbulent transfersof the city’sheat.Hence,urbanwarm ing trendsand the relativewarm th of a city compared w ith its surrounding rural areas—known as the Urban Heat Island(UHI)e ff ect—have becom e key environmental issues(IPCC,2007;Ning et al.,2015).Epidem iological studies(Conti et al.,2005; M ichelozziet al.,2007;Ye et al.,2012;Chen et al.,2015) show thatpeople in urban areashave an elevated risk ofmortality due to the e ff ect of higher air temperature and heat waves,as compared to those in suburban and ruralareas.
Over the past three decades,researchershave studied urban warm ing trends using annual,quarterly,and monthly mean air temperature data(Kalnay and Cai,2003;Huang et al.,2009;Kataoka etal.,2009;Ren etal.,2012;Sonaliand Kumar,2013;Chattopadhyayand Edwards,2016).Ren etal. (2012)indicated thatannualmean air temperature increased ata rate ranging from 0.03°C(10 yr)-1to 0.12°C(10yr)-1in China in the past100 years,and thewarmingwasmore significantinw interand spring andwasm oreevidentin northern China.Sonaliand Kumar(2013)studied temperature trends across all regions in India.They also reported that significant trends could be found using w intermaximum temperature data in India.Kalnay and Cai(2003)studied the impactof urbanization and other land-use changesonmonthly mean surface temperature.By comparing trends in observed surface temperatures at U.S.surface stations w ith that derived from the reconstruction of surface temperaturesbased on globalclimatemodel from 1950–99,they determined that themean surfacewarmingwasabout0.27°C(100yr)-1in the U.S.due to urbanization as well as other land-use changes.Chattopadhyay and Edwards(2016)studied long-term temperature trendsusing annualmean data at42 di ff erent locations in Kentucky.They reported thatonly threeof the 42 locationshad a linear temperature trend of about0.01°C yr-1. Huang etal.(2009)studied long-term annualsurfaceair temperature and reported that themean warming rate in Osaka wasabout2.0°C(100 yr)-1during the period 1883–2006.A slightly higher value of temperature increasewas reported by Kataoka etal.(2009).Chan etal.(2012)studied tem perature trends in Hong Kong from a seasonal perspective.They calculated thedailymaximum temperature,dailymean temperature,and dailyminimum temperature forevery threemonths, i.e.,each season,from 1885 to 2010,and reported that the warming trend wasmore prominent in w inter and spring in Hong Kong.Nevertheless,analyzing urban warming trends using annual and quarterly temperature data has relatively weak statisticalpowerbecause theavailability of data points is limited(Wang et al.,1990;Liet al.,2004;Huang et al., 2009;Chan et al.,2012).Lenten and M oosa(2003)used a generalmultivariate structural time seriesm odel and found that the monthly air tem perature series in Australian cities were I(1),i.e.,w ith a trend.They also reported that temperaturehadanupward trend inmostcitiesbetween January1901 and December1998.
To determ ine the UHI intensity,researchers have either calculated the temperature di ff erence between an urban site and a rural site(Wang et al.,1990;Camilloni and Barros, 1997;Lietal.,2004;Debbageand Shepherd,2015)orused remotesensing techniques(Nichol,1996,2005;LoandQuattrochi,2003;Zhou et al.,2015).Wang et al.(1990)investigated the UHIe ff ectin 42 urban areas in Chinabetween 1954 and 1983.Wang et al.(1990)found that the presence of a UHIled to urban areasbeing on average0.23°Cwarmer than rural areasacross all seasons and regions in China.On the otherhand,Lietal.(2004)reported that theaverageUHIeffect for thewholeof Chinaduring the50 yearsbetween 1951 and 2001 was less than 0.06°C—a figure thatwas insignificantwhen compared to the background trend of increasing temperature.Nichol(1996,2005)used Landsatdata to study the UHI e ff ect in Singapore and Hong Kong.Chen et al. (2006)investigated the relationship between UHIs and land use in the Pearl River Delta using Landsat TM and ETM+ (Enhanced TM Plus)thermal IR images obtained between 1990and2000atan intervalof two or threeyears.They found thattheUHIwasproportionally related to urbansizeand population density.Lietal.(2011)studied the UHIin Shanghai using Landsat ETM+images and found that themanmade impervioussurfaceareasignificantly a ff ects theUHI.Lo and Quattrochi(2003)used di ff erent Landsat images from 1973 to 1997 to study changes in land useand land coverand surface temperature in the A tlantametropolitan area in Georgia. They found thatan increase in surface temperaturewasassociatedw ith thedecline in vegetation ornaturalbiomass.Zhou etal.(2015)used MODIS data to study the footprintof the UHIe ff ect in China.They indicated that ignoring the footprintmay underestimate the UHIintensity inmany cities in China.
The objectivesof the presentstudy are notonly to determine theurban temperature trend in Hong Kong using annual mean air temperaturedata,butalso to demonstrate thaturban temperatureshould be rigorouslymodeled based on seasonal unitroot tests forunadjustedmonthlymean air temperatures. TheUHIintensitywasestimatedusing the temperaturedi ff erencebetweenanurbansiteanda ruralsiteinHong Kong.The study also exploreswhetherincreasesin population,grossdomestic product(GDP),urban land use,and energy use were significantly associated w ith the change in urban temperature in Hong Kong.Follow ing this introduction,section 2 describes the area studied and the data used;section 3 presents the resultsand analysis;and section 4 concludes the study.
2.M ethods
2.1.The study area—Hong Kong
Hong Kong has a land area of 1104 km2and is an international finance center,trade and logistics center,and a popular tourist destination(To,2015).Hong Kong has experienced substantial demographic,economic,and environmental changes over the past four decades.Hong Kong’s population increased from 4.0 million in 1970 to 7.3 million in 2015,while its GDP increased from HKD 195.2 trillion to HKD 2246.4 trillion during the sam e period of tim e. The number of visitors increased from 1.3 m illion in 1970 to 59.3million in 2015.Electricity consumption and associated greenhousegasemissionshave increased almosttenfold (To et al.,2012)—the same as the increase in the total use of primary energy,including oil products,coal,and natural gas(To,2014)—over the past four decades.Unfortunately, the numberof hoursof reduced visibility increased from 184 hoursin 1971 to 1398 hours in 2011(To,2014).
2.2.Datasets
The data for thisstudy,including annualm ean air temperature,monthlymean air temperature,population,and GDP, between 1970 and 2015,were extracted from databasesprovided by the Hong Kong Observatory and Hong Kong Censusand StatisticsDepartment.Annualandmonthlymean air temperatureswere recordedattheweatherstation in theheadquartersof Hong Kong Observatory in Tsim Sha Tsui—an urban site(Chan etal.,2012).Similar to the studiesby Ren etal.(2012),Huangetal.(2009),and Kalnay and Cai(2003), mean air temperaturewasused to determ ine the urban temperature trend in Hong Kong over the past four decades.The size of developed areasbetween 1970 and 2015wasobtained from publicationsof theHong Kong Buildingsand LandsDepartmentand the Hong Kong Planning Department.Energy end-usedatawereobtained from the reportspublished by the Hong Kong Electrical and Mechanical Services Department (HKEMSD,2005a,b).
2.3.Analysismethod
Annual mean air temperature data between 1970 and 2013 were analyzed using the ordinary least-squares(OLS)approachw ith linear trend,likemostotherUHIstudies(Liet al.,2004;Huang etal.,2009;Chan etal.,2012).Themajor problem w ith using annualmean air temperaturedata rather than monthly data is the reduction in the number of observations,thus reducing the statistical powerof the estimation and the reliability of the estimates.Hence,we applied seasonalunitroottests to themonthlymeanair temperaturedata between January 1970 and Decem ber 2013,as described by Franses(1991),Beaulieu and M iron(1993),and Franses and Hobijn(1997).The seasonal unit root test produces am uch more accurate estimate of the temperature trend because the monthly data are fully utilized,w ith inwhich the lossof information is small(Nijman and Palm,1990).
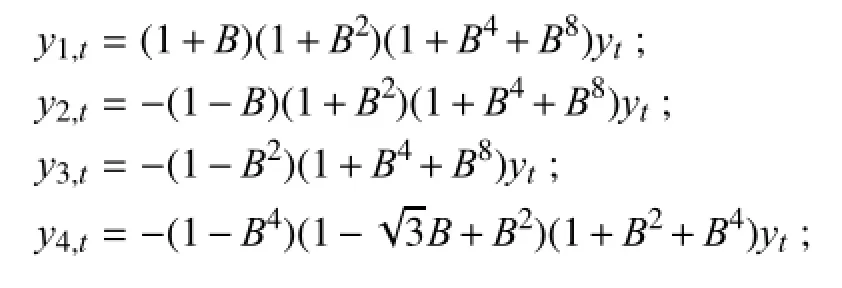
Inmonthly timeseries,the testof thepresenceofmultiple unitrootscannotbeaccomplishedby thestandardaugmented Dickey–Fuller Test(Dickey and Fuller,1981).As di ff erent unit rootsmightexist in amonthly seasonal process due to the stochastic nature of climatic conditions,we adopted the m ethod developedby Franses(1991)and used the criticalvaluessuggested by Fransesand Hobijn(1997).Specifically,the test for the presence of seasonal unit rootswas based on the follow ing auxiliary regression(Franses,1991): where B is the backward shiftoperator,inwhich Bkyt=yt-kand?(B)is an autoregressive polynomial,μtis the constant term,πiis the coe ffi cientof yi,andεtis the error term.The autoregressivemodel was used because monthly mean air temperaturedependson the currentweather condition aswell as thepaststatesof the climatesystem.The y valuesaregiven in Eq.(2):
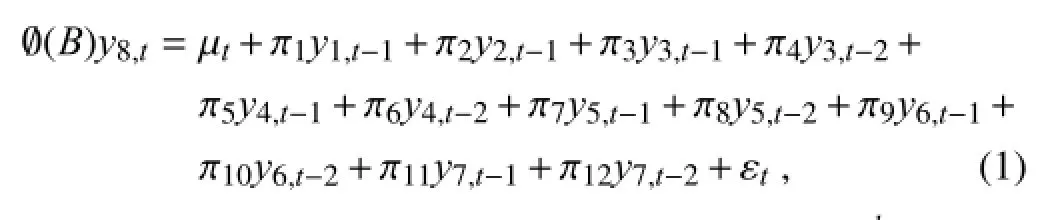
Testswere conducted w ith the auxiliary equation forπ2that isequal to zero and a setof joint testsof the hypotheses for pairs of consecutiveπithat is equal to zero for i from 3 to 12.We also tested for two scenarios—onew ith a trend and anotherw ithouta trend—using the setof critical values established by Franses and Hobijn(1997).Themodel obtained from theseasonalunit rootanalysiswasused to predict monthly m ean air tem peratures between January 2014 and December 2015.The accuracy of thismodelwas assessed using themean absoluteerror,theRMSE,and the root-meansquare percentageerror.
To evaluate the UHIintensity,we compared annual and monthly air temperaturesattheurbansiteandata ruralsite—Tu Kwu Ling,Hong Kong.Correlation analyseswere performed between annualmean air temperature data,population,GDP,urban land use,and energy use.
3.Resultsand analysis
3.1.Urban temperature trend
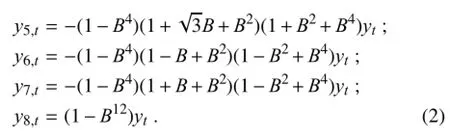
Figure 1 shows Hong Kong’s annualmean air temperature for the period 1970 to 2013.The correlation between“year”and annualmean air temperaturewas 0.600 and significantat the 0.001 level.A linear trend was identified by using the OLS approach.The analyzed resultshow s that annualmean air temperature increased by 0.174°C(10 yr)-1during this period of time.The coe ffi cientof determ ination, R2,indicated that the temperaturemodel identified using the OLSapproachexplained36%of thevariancein themeasured data,similar to other studies(Wang et al.,1990;Li et al., 2004;Huang etal.,2009;Kataokaetal.,2009).
Fig.1.Annualmean air temperature in Hong Kong from 1970 to 2013.
Figure 2 shows that,although the variations in the monthly data were quite significant(ranging from 16°C inJanuary to 29°C in July),there were upward trends in all monthly time series during the period of 1970–2013.Correlation analyses showed thatonly three setsofmonthly data (August,October and November)were significantly associated w ith“year”at the 0.05 level(for August,w ith a Pearson’scorrelation coe ffi cientof 0.36)and at the0.01 level(for October and November,w ith a Pearson’s correlation coe fficientof 0.41),respectively.

Fig.2.Monthlymean air temperature in Hong Kong for January–Decembr(from 1970 to 2013):(a)January(filled diamonds), February(plus signs)and March(multiplication signs);(b)April(filled circles),May(multiplication signs)and June(filled triangles);(c)July(filled triangles),August(multiplication signs)and September(filled circles);(d)October(multiplication signs),November(plus signs)and December(filled diamonds).
To rigorously exam ine the long-term stochastic trendw ith theseasonalphenomenon,weapplied seasonalunitroot tests and included allmonthly data from January 1970 to December 2013 in the analysis.We performed seasonal unit root tests using the approach described by Beaulieu and M iron (1993),Franses(1991)and Fransesand Hobijn(1997).
W hen the auxiliary equation contained a trend(or a trend was absent),seasonal components and a constant,the test statistics showed that therewasa unit rootatzero frequency based on the t-statistics.Besides,π2was significantly di ff erent from zero at the0.01 level.The joint F-testsof the pairs, fromπ3–π4toπ11–π12,rejected thepresenceof aunit rootat the 0.01 level.As suggested by Franses and Hobijn(1997), weconducted jointtests forπ1...π12andπ2...π12,and found that the resultswere significant.Thus,the results confirmed thata non-seasonalunit rootexisted.
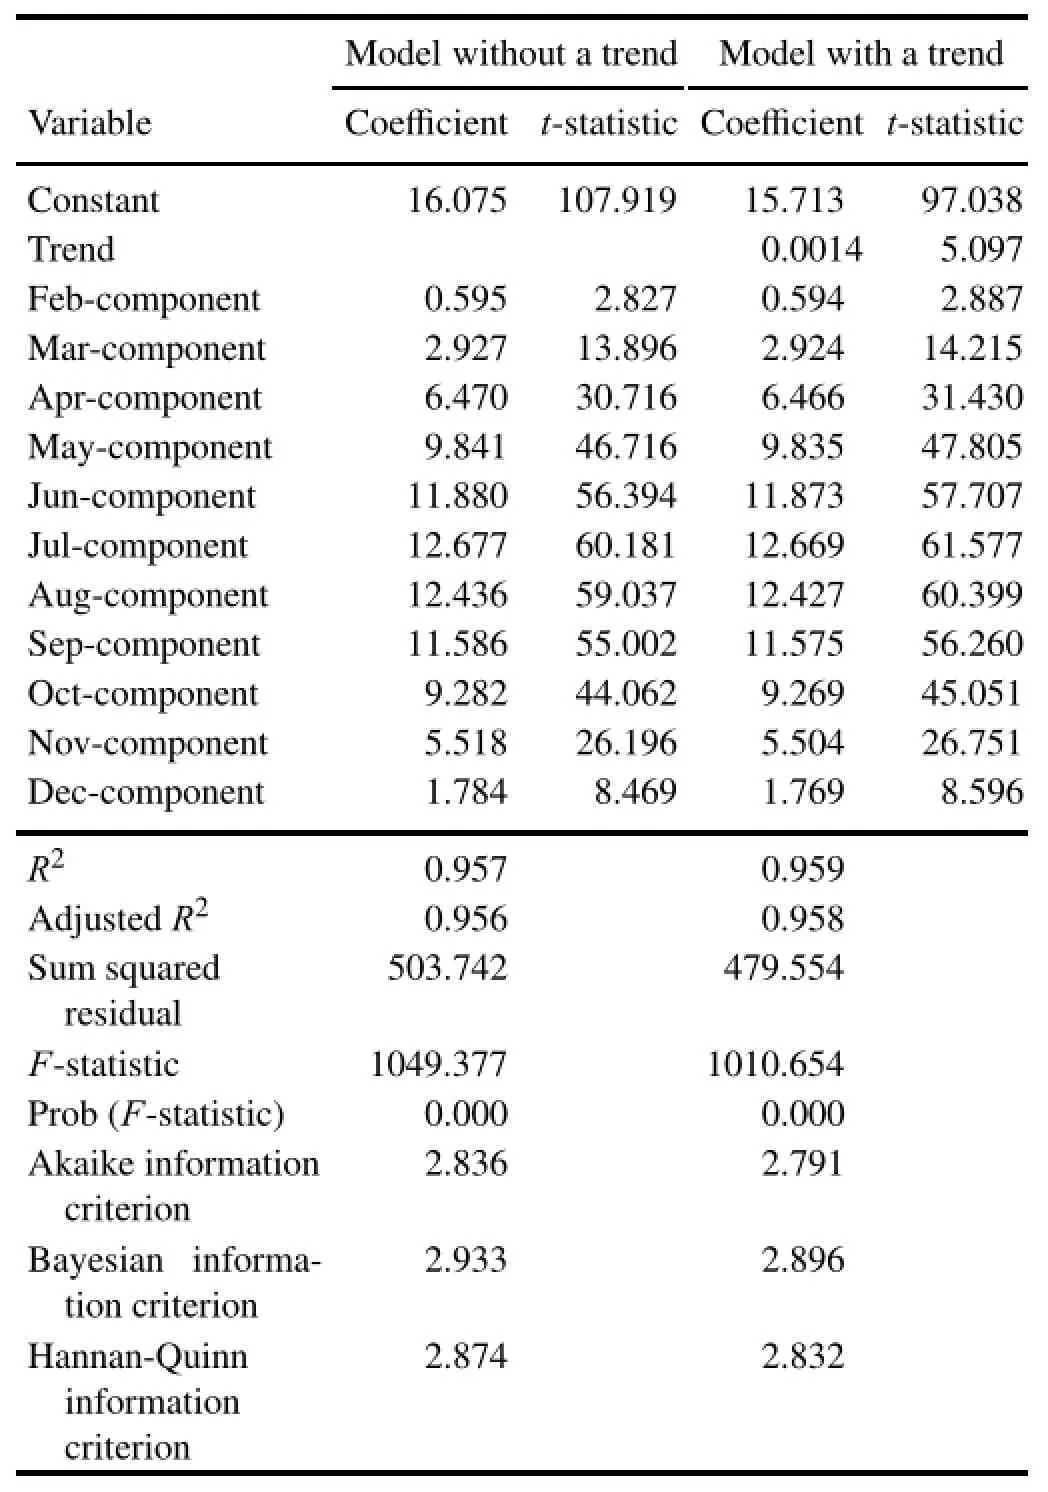
Table1.The estimation results of seasonalmodels:onew ithout a trend and anotherw ith a trend.
Table 1 presents theestimation resultsof twomodels:one w ithouta trend and anotherw ith a trend.A llcoe ffi cientswere significantatthe0.01 level.From theAkaikeinformation criterion,Bayesian information criterion,and Hannan–Quinn information criterion,themodelw ith a trend showed abetter ability in minimizing the information loss.This provided evidence of the presence of a stochastic linear trend in the series.The coe ffi cientof determ ination,R2,which indicateshow well themodel fits themeasured values,was0.959.In otherwords,the temperaturemodel obtained from the seasonal unit root analysis explained 95.9%of the variance in themeasured monthly data—much higher than that of the model obtained using the OLS approach w ith annualmean air temperaturedata.
Table1 shows thatthe coe ffi cientof trendwassignificant for the model w ith a trend.The results showed thatmean air tem perature changed w ith respect to time by accounting for the fluctuation of temperature due to the seasonal phenomenon.In otherwords,timeisan importantdeterminantof mean air temperature.The coe ffi cientof trend wasobtained basedonmonthly data.Thus,meanair temperatureincreased by 0.0014045°C(month)-1[or 0.169°C(10 yr)-1].This trend wasnotnoticeable in normalstatistical analysis due to thevarianceofmonthly temperaturedata.However,afteraccounting for the variances due to the seasonal components, oureconometric testing results revealed and confirmed such an impact of time on temperature.In summary,the change inmean air temperaturewas0.169°C(10 yr)-1[or 0.174°C (10 yr)-1using annualdata]in Hong Kong,whichwashigher than the increase in globalmean air temperature[0.13°C(10 yr)-1using the data from 1956 to 2005,or 0.07°C(10 yr)-1between 1906and 2005 due toglobalwarm ing](IPCC,2007; Ye etal.,2012).The seasonal unit rootmodel ofmean air temperaturein Hong Kong isgiven in Eq.(3):
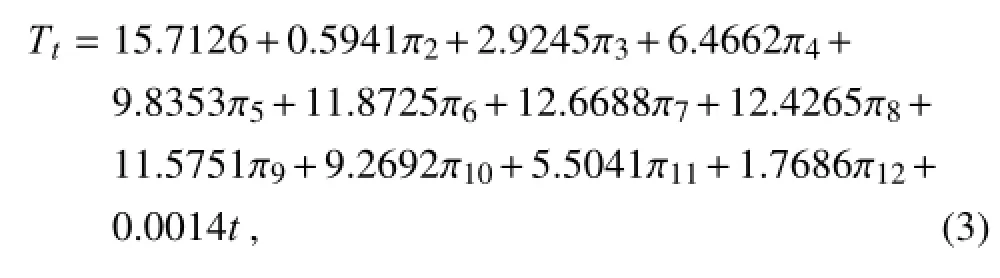
where Tt ismean air temperature in month t,πn=1 when n=t+12k,in which t is the numberof themonth from January 1970,k=0,1,2,...;whileπn=0 for all others.The coe ffi cientsofπvalueswereobtained from Table1.
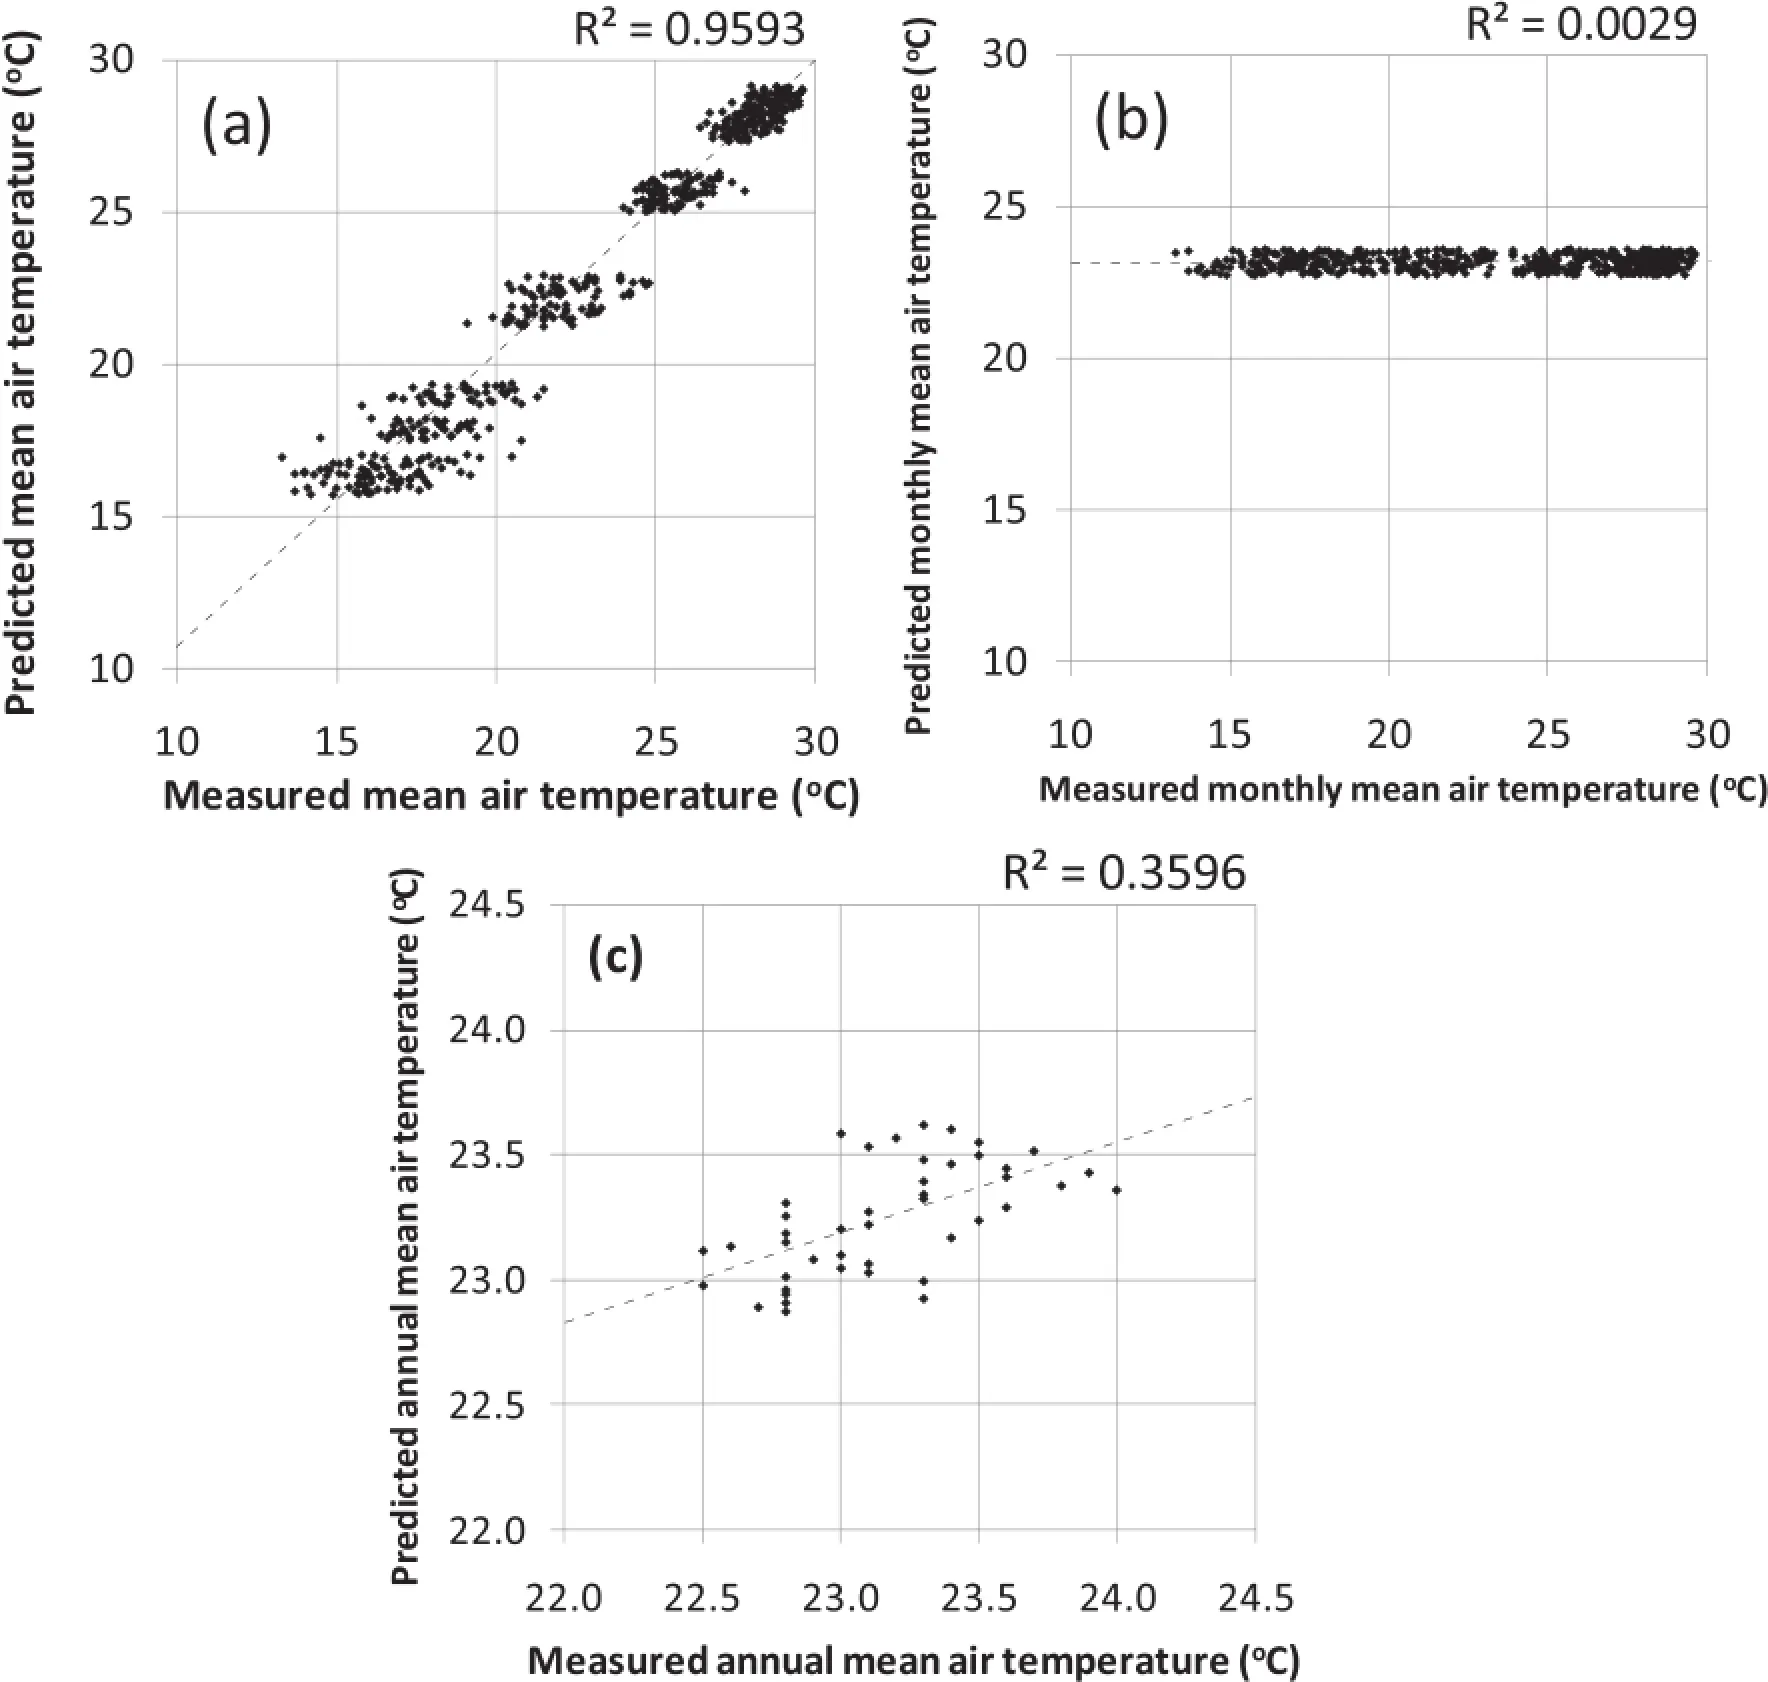
Fig.3.Themeasuredmean air tem peratureversus thepredictedmean air tem perature in Hong Kong(1970–2013),based on(a) the seasonalunit rootmodel,(b)theOLSmodelusingmonthly data,and(c)theOLSmodelusing annualdata.
Figure 3 shows themeasured mean temperature versus predicted temperature using the seasonal unit rootmodelbased on monthly data,using the OLS model based on monthly data,andusing theOLSmodelbasedonannualdata. This figure demonstrates that the overallaccuracy of the formermodelwasbetter than thatof the lattermodels.The R2valuesshowed thatthemodelobtained from theseasonalunit root analysis was able to explain 95.9%of the variance in themeasured monthly mean air temperature data,while the m odel obtained using OLSwas only able to explain 0.29% of the variance of them easured monthlym ean air temperature data.Themodel obtained using OLS based on annual datawasable to explain 36%of thevarianceof themeasured annualmean air temperaturedata.
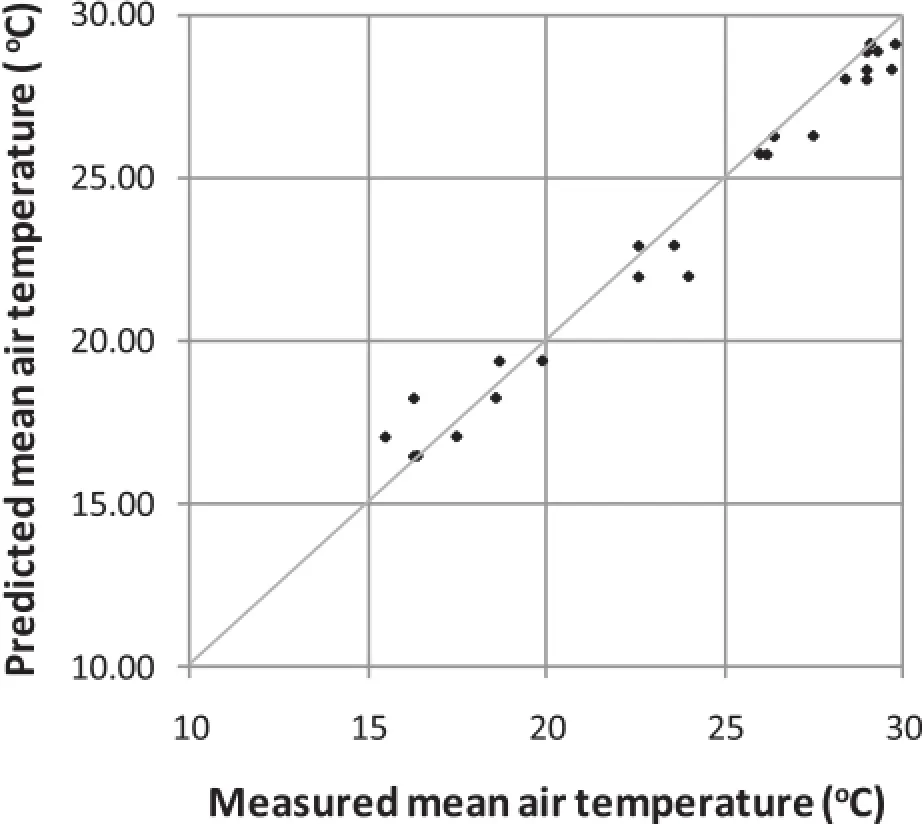
Fig.5.Themeasuredmeanair temperature versus thepredicted mean air temperature in Hong Kong(January 2014 to December 2015).
Figure 4 shows themeasured and predictedmonthly air temperatures from 1970 to 2013.It demonstrates the superior performanceof using the seasonal unit rootmodel to regenerate themeasuredmonthlymean air temperatures from January 1970 to December2013.
3.2.Prediction ofmonthly mean air temperature using the seasonalmodel
Equation(3)was used to predict themonthly mean air temperature from January 2014 to December 2015.Figure 5 shows the predictedmean air temperatures and themean air temperatures recorded at the Hong Kong Observatory in Tsim Sha Tsui.The correlation between the predicted and themeasured valueswas 0.989,while themean absolute error,the RMSE,and the root-mean-square percentage error were 0.659°C,0.861°C and 4.2%,respectively.Hence,the resultsconfirm ed that theseasonalunit rootmodelofm onthly m ean air temperature has a high predictive power.When the OLSmodelbased onmonthly datawas tested,the correlation between the predicted and themeasured values was 0.247, while themeanabsoluteerror,theRMSE,and the root-meansquare percentage errorwere 4.5°C,5.04°C and 25.1%,respectively.
3.3.UH Ie ff ect
Generally,the UHI is characterized by comparing air temperatures recorded at an urban site and a rural site (Wang et al.,1990;Cam illoni and Barros,1997;Li et al., 2004;Chan etal.,2012;Debbageand Shepherd,2015;Hu et al.,2016).Thedi ff erencesbetween these two time seriesare attributed to the e ff ect of the UHI.Unfortunately,nearly all rural stationswere established in Hong Kong after themid-1980s,and some rural areas have been converted to developed areas w ith suburban or urban land-use(Leung et al., 2007;Chan etal.,2012;Siu and Hart,2013).Themeasured air temperaturesatHong Kong’s island stations,such asCheung Chau andWaglan Island,have been found to have been substantially modulated by temporal variations in tem perature of the near-shore waters(Leung et al.,2007).Hence, annualmean air tem perature and monthly mean air temperature data recorded at Ta Kwu Ling were taken as those for the ruralstation(Leung etal.,2007).Figure6 shows thedifferencebetween theannualmeanair temperatureattheurban station,i.e.,Hong Kong Observatory at Tsim Sha Tsui,andthatat the ruralstation,i.e.,Ta Kwu Ling,between 1989 and 2014.It can be seen that the annualm ean air tem perature at the urban site was 0.808°C(standard deviation:0.230°C) higher than thatof the ruralsite.
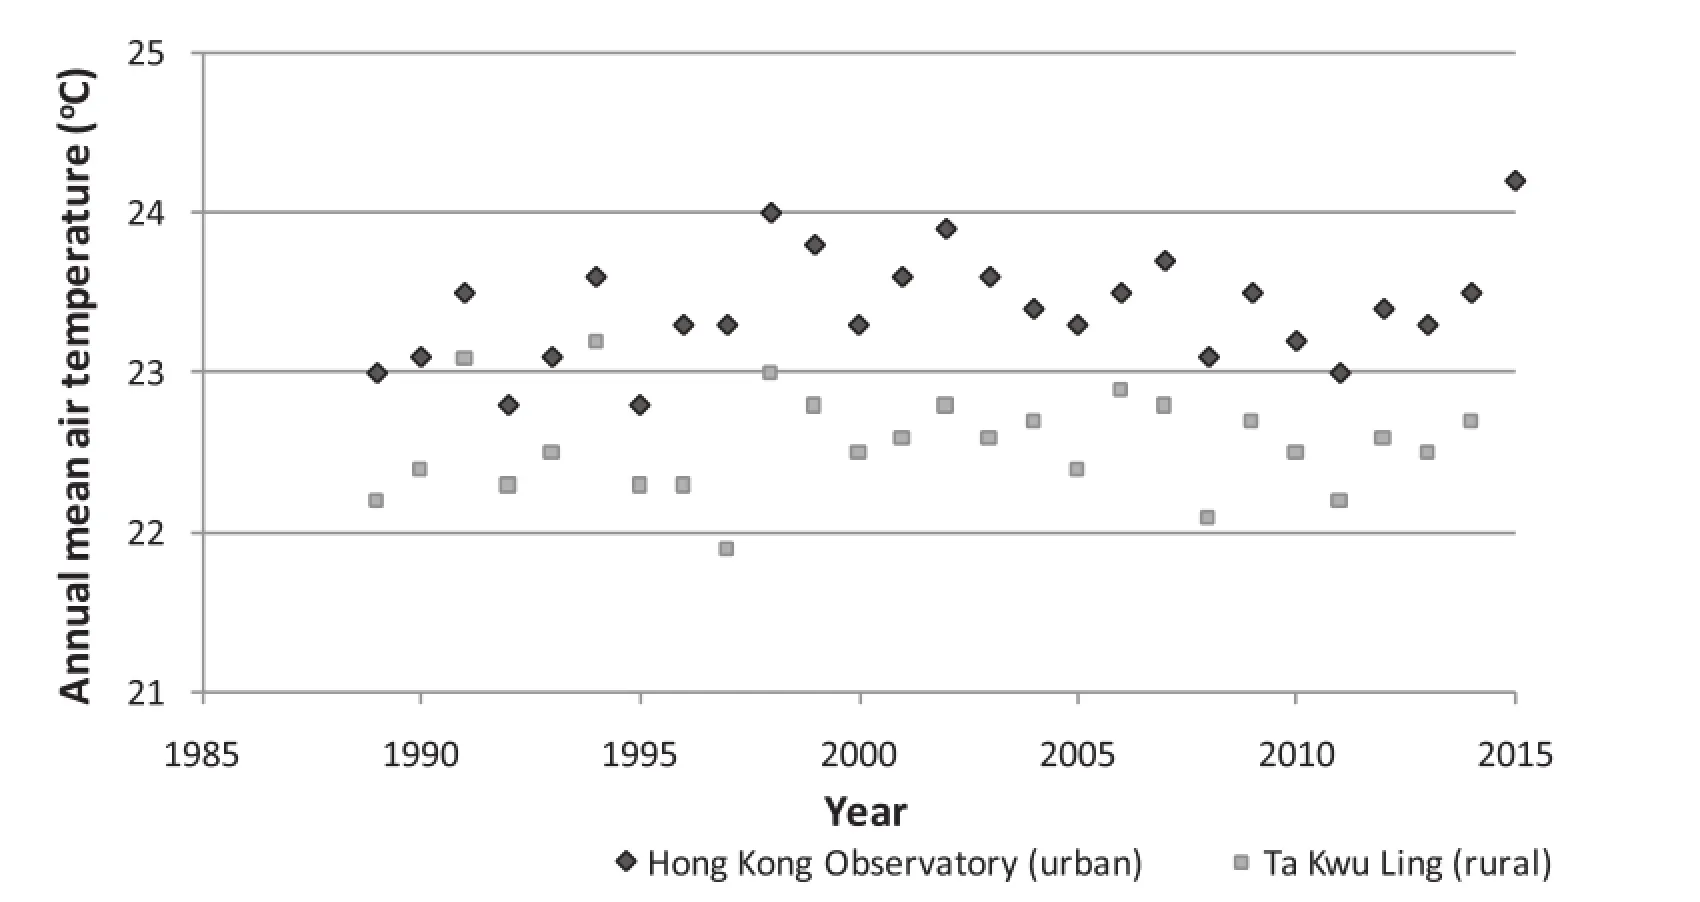
Fig.6.Annualmean air temperatureatanurban site(diamonds)and a ruralsite(squares)in Hong Kong (1970–2015).Note thatair temperaturewas recorded at the same location of Ta Kwu Ling(ruralarea) after 1988,and that the annual and monthly mean air temperatures at Ta Kwu Ling for the year 2015 had notbeen released by the Hong Kong Observatory at the time ofw riting.
Monthlymean air temperature data at Ta Kwu Ling between January 1999 and December2014wereobtained from the database of the Hong Kong Observatory.Itwas found that the distribution of di ff erences between themonthly air temperatureat the urban site and thatat the ruralsite ranged between 0°C and 2.9°C,w ith amodeof 0.50°C–0.75°C.Results showed that the di ff erence between themonthlymean air temperature at the urban site and that at the rural site was greater during the w inter months,w ith an average of 1.38°C for November,1.88°C for December,and 1.51°C for January.This phenomenon hasalso been observed inmainland China(Wang etal.,1990),Seoul(Kim and Baik,2002), A laska(Hinkel et al.,2003),and Hong Kong using quarterly data(Chan et al.,2012).Monthlymean air temperaturewas found to beon average0.865°C(standard deviation: 0.538°C)warmerat theurban site thanatthe ruralsiteduring theperiod of January 1999 to December2014.
3.4.Population,GDP,urban landuse,energyuse,and annualmean air temperature
Figure 7a show s that Hong Kong’s population increased from 4.0 million in 1970 to 7.3 million in 2015.Figure 7b shows that Hong Kong’s GDP increased from HKD 195.2 trillion to HKD 2246.4 trillion during the same period of time.Figure 7c shows the urbanization of Hong Kong between 1970 and 2015.Datawere compiled from reportsof the Hong Kong Buildingsand Lands Department(on or before 1989)and the Hong Kong Planning Department(from 1990 onwards).The use of energy w ill definitely lead to an increase in air pollutants(To et al.,2012;To,2014,2015), and hasan e ff ecton ambient temperature—particularly in a built environmentsuch as Hong Kong.However,the im pact of energy use on air temperature is a comp lex phenomenon. Not all the consumption of primary energy w ill eventually transform in to thermal energy in air.For example,Hong Kong’spowerplantshavean overalle ffi ciency of about34%. In otherwords,about1/3 of fuelenergy in thepowerplant is converted to electricalenergyand2/3of fuelenergy iswasted throughmechanical loss,transmission loss,waste heat discharged to the atmosphere through stack gases,and waste heat discharged to the air and sea through the coolingwater of condensers(Erdem etal.,2010).Within theurbanized area of Hong Kong,the use of electricity,gases(including liquefied petroleum gas and town gas),motor gasoline by private vehicles,and dieseloilby buses,trucksand industrialboilers, w illcausean increase in theamountofwasteheatdischarged from chillers,boilers,flue gases,etc.Hence,the use of these forms of energy was included in this study.Datawere extracted from Hong Kong’senergy end-use reports published by the Hong Kong Electrical and Mechanical Services Department(HKEMSD,2005a,b).Figure 7d shows the use of energy in terajoule(TJ)for theperiod 1984–2013.
Figure 8 presentsscatter p lotsofannualmean air temperature versus Hong Kong’s population,annualm ean air temperature versus Hong Kong’sGDP,annualmean air temperature versus Hong Kong’surbanized area,and annualmean air temperature versus the total energy use in Hong Kong. Trend and correlation analysesshow that therewasamoderateand significantrelationshipbetween annualmean air temperature and Hong Kong’s GDP(R2=0.3746;p<0.001), andmoderate(slightly stronger)and significant relationships between annualmean air temperatureand Hong Kong’spopulation(R2=0.4244;p<0.001),between annualmean air temperature and Hong Kong’s urbanized area(R2=0.4319;p<0.001),and between annualmean air temperature and Hong Kong’s totalenergy use(R2=0.4344;p<0.001).The findings are not surprising,because it is known that urban warming isassociated w ith population and GDP(Oke,1973; Hu and Jia,2010).Besides,the correlation between annual mean air temperatureand urbanized areawas consistentw ith the findings reported by He etal.(2013),who indicated that the total urban area of a city was associated w ith the annual m ean air tem perature recorded in the city’smeteorological stations.
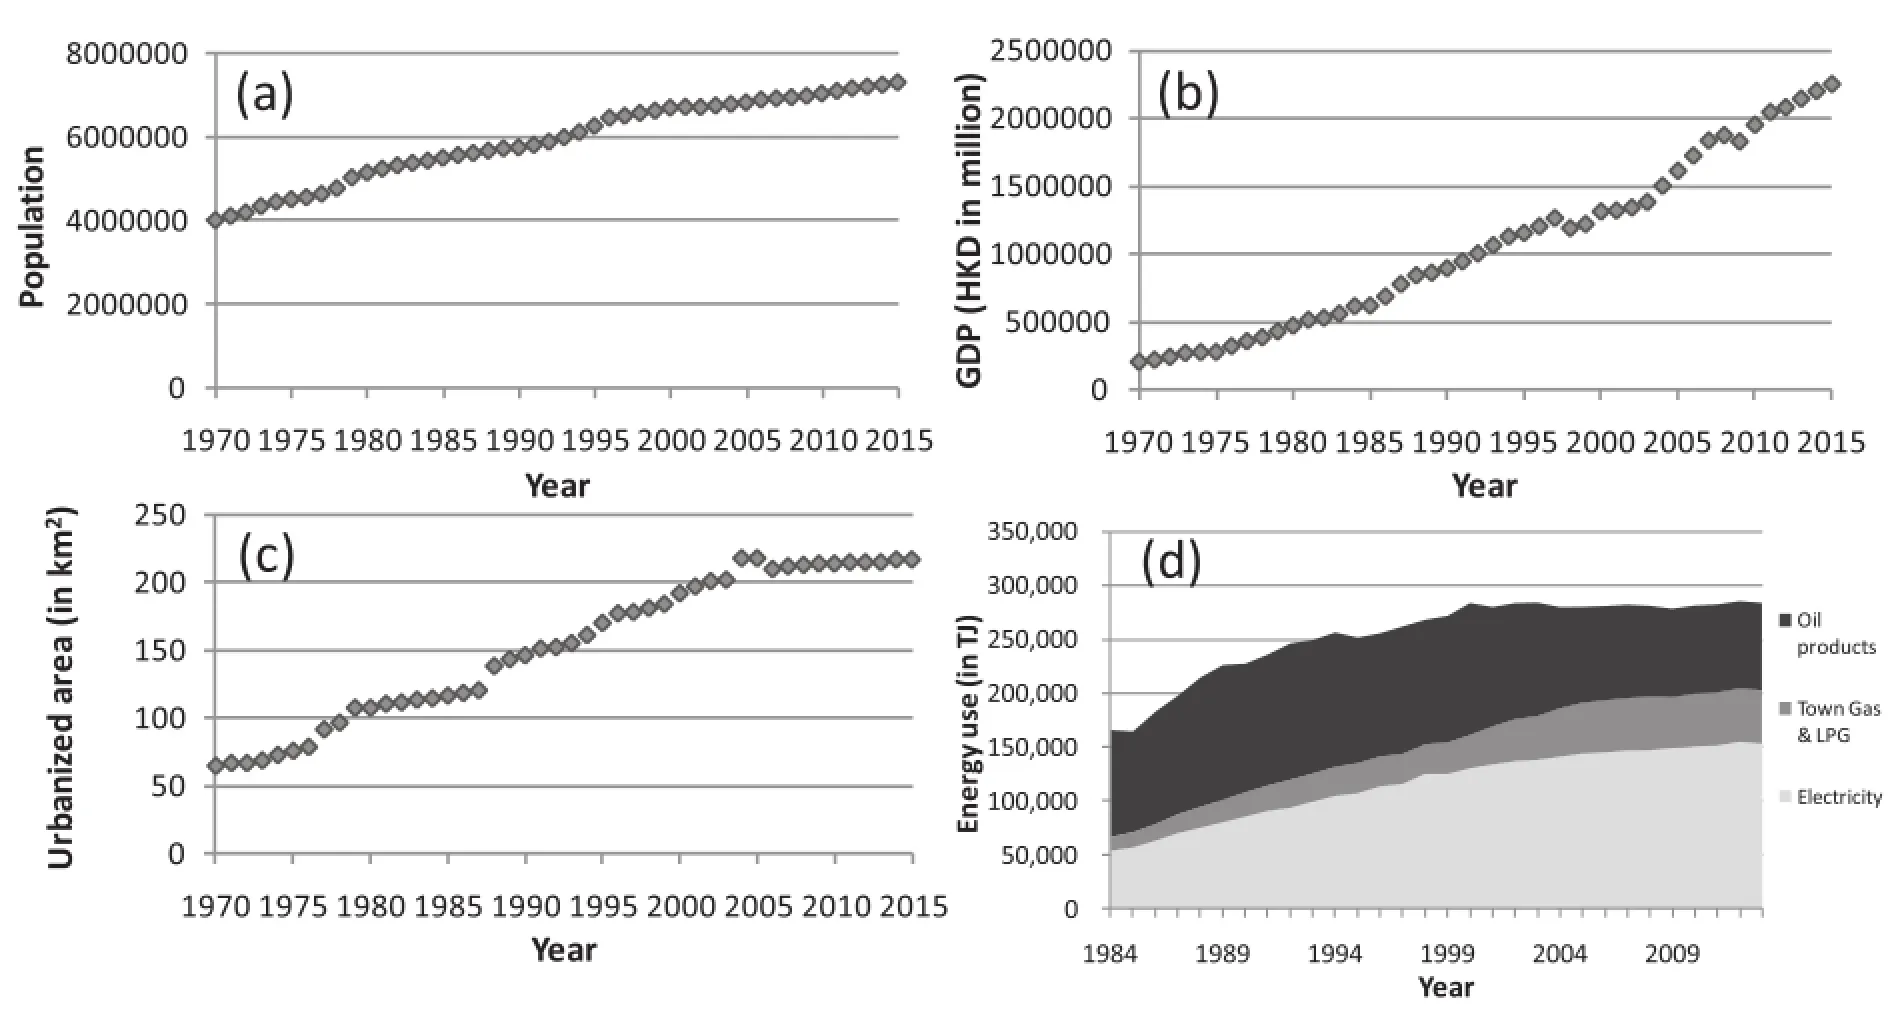
Fig.7.Hong Kong’s(a)population(1970–2015),(b)GDP(1970–2015),(c)urbanized area(1970–2015)and(d)energy use (1984–2013).The data in(c)exclude temporary structures/livestock farms,reservoirs,cemeteries,crematoria,m ines,quarries etc.The data in(d)wereonly availableafter1984.
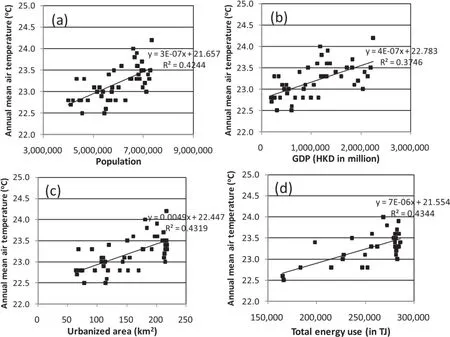
Fig.8.Scatter plots of annualmean air temperature versus Hong Kong’s(a)population,(b)GDP,(c)urbanized area,and(d) totalenergy use.
To identify the relationships between population,GDP, urban land use,energy use,and annualmean air temperature, multiple-linear regressionwas applied to these five time series(Ning and Bradley,2014).Population,GDP,urban land use,and energyusewerechosen as theindependentvariables, whileannualmeanair temperaturewasselected as thedependentvariable.A stepw ise procedurewasused to identify significant predictors of annualmean air temperature.Results showed thatenergy use and GDPwere able to explain 48.1% of the variance in annualm ean air temperature.
4.Conclusion
Urban warming is an importantenvironmental issue and its trend should be closelymonitored.The present study is one of the first to use annual as well asmonthly mean air temperature data and an econometric approach to characterize the long-term urban temperature trend in a builtenvironmentsuch asHong Kong.Unlikemany other studies,which have primarily used annualmean air temperaturedata(Liet al.,2004;Huang etal.,2009;Chan etal.,2012),ouranalysis m adeuse ofm onthly data,resulting inmuch higherstatistical power to identify the stochastic trend ofm ean air temperature.The seasonal unit rootanalysis produced amuchmore accurateestimate of theurban temperature trend because the monthly datawere fully utilized and the lossof information was small(Nijman and Palm,1990).The resultsof the seasonal unit rootanalysis showed thatmonthlymean air temperature hasa stochastic trend and seasonal components.It was found that themean air temperature in Hong Kong increasedby0.169°C(10yr)-1over thepast fourdecadesusing monthly temperaturedata[or0.174°C(10 yr)-1using annual temperature data],and the trend is likely to persist.By comparing mean air temperatures at an urban site and that at a rural site,itwas found thatmean air temperaturewas on average 0.865°C higher at the urban site than at the rural site. The resultsof correlation analysisillustrated that the increase in annualmean air temperaturewas significantly associated w ith theincrease in population,GDP,urban land use,and energy use.The results ofmultiple-linear regression showed energy use and GDP to be themostsignificant predictorsof annualmean air temperature.
Acknow ledgements. The authors gratefully thank the three anonymous reviewers for their comments and suggestions,which helped to improve themanuscript substantially.
Beaulieu,J.J.,and J.A.Miron,1993:Seasonalunitroots inaggregate U.S.data.JournalofEconometrics,55(1–2),305–328.
Cam illoni,I.,and V.Barros,1997:On theurban heat island e ff ect dependence on temperature trends.Climatic Change,37(4), 665–681.
Chan,H.S.,M.H.Kok,and T.C.Lee,2012:Temperature trends in Hong Kong from a seasonalperspective.ClimateResearch, 55(1),53–63.
Chattopadhyay,S.,and D.R.Edwards,2016:Long-term trend analysis of precipitation and air temperature for Kentucky, United States.Climate,4,10,doi:10.3390/cli4010010.
Chen,K.,L.Huang,L.Zhou,Z.W.Ma,J.Bi,and T.T.Li,2015: Spatialanalysisof thee ff ectof the 2010 heatwave on stroke mortality in Nanjing,China.Scientifc Reports,5,10816,doi: 10.1038/srep10816.
Chen,X.L.,H.M.Zhao,P.X.Li,and Z.Y.Yin,2006:Remote sensing image-based analysis of the relationship between urban heatisland and land use/cover changes.Remote Sens.Environ.,104,133–146.
Conti,S.,P.Meli,G.Minelli,R.Solimini,V.Toccaceli,M.Vichi, C.Beltrano,and L.Perini,2005:Epidemiologic study ofmortality during the summer 2003 heat wave in Italy.Environ. Res.,98(3),390–399.
Debbage,N.,and J.M.Shepherd,2015:The urban heat island effectand city contiguity.Computers,Environmentand Urban Systems,54,181–194.
Dickey,D.A.,and W.A.Fuller,1981:Likelihood ratio statistics for autoregressive time seriesw ith a unit root.Econometrica, 49,1057–1072.
Erdem,H.H.,and Coauthors,2010:Thermodynam ic analysis of an existing coal-fired power plant for districtheating/cooling application.Applied Thermal Engineering,30(2–3),181–187.
Franses,P.H.,1991:Seasonality,non-stationarity and the forecasting ofmonthly timeseries.International JournalofForecasting,7(2),199–208.
Franses,P.H.,and B.Hobijn,1997:Critical values for unit root tests in seasonal time series.Journal of Applied Statistics, 24(1),25–48.
He,Y.T.,G.S.Jia,Y.H.Hu,and Z.J.Zhou,2013:Detecting urban warming signals in climate records.Adv.Atmos.Sci., 30(4),1143–1153,doi:10.1007/s00376-012-2135-3.
Hinkel,K.M.,F.E.Nelson,A.E.Klene,and J.H.Bell,2003:The urban heat island in w inter at Barrow,Alaska.International Journal ofClimatology,23(15),1889–1905.
HKEMSD,2005a:Hong Kong Energy End-Use Data 1993-2003. Hong Kong Electricaland Mechanical Services Department, Hong Kong.p.3.
HKEMSD,2015b:Hong Kong Energy End-Use Data 2003-2013. Hong Kong Electricaland Mechanical Services Department, Hong Kong.p.60.
Hu,X.M.,M.Xue,P.M.K lein,B.G.Illston,and S.Chen,2016: Analysisofurban e ff ectsin OklahomaCity usinga densesurface observing network.J.Appl.Meteor.Climatol.,55,723–741.
Hu,Y.H.,and G.S.Jia,2010:Influenceof land use changeon urban heat island derived from multi-sensor data.International Journal ofClimatology,30(9),1382–1395.
Huang,S.P.,M.Taniguchi,M.Yamano,and C.H.Wang,2009: Detecting urbanization e ff ectson surfaceand subsurface ther-malenvironment—A case study of Osaka.Science ofthe TotalEnvironment,407,3142–3152.
IPCC,2007:Climate Change 2007:The Physical Science Basis. Contribution ofWorking Group I to the Fourth Assessment Report of the Intergovernmental Panel on Climate Change, Solomon et al.,Eds.,Cambridge University Press,Cambridge,United Kingdom and New York,NY,USA,996pp.
Kalnay,E.,and M.Cai,2003:Impactofurbanization and land-use change on climate.Nature,423(6939),528–531.
Kataoka,K.,F.Matsumoto,T.Ichinose,and M.Taniguchi,2009: Urban warm ing trends in several large Asian cities over the last 100 years.Science of the Total Environment,407(9), 3112–3119.
Kim,Y.H.,and J.J.Baik,2002:Maximum urban heat island intensity in Seoul.J.Appl.Meteor.,41(6),651–659.
Lenten,L.J.A.,and I.A.Moosa,2003:An empirical investigation into long-term climate change in Australia.EnvironmentalModelling&Software,18(1),59–70.
Leung,Y.K.,M.C.Wu,K.K.Yeung,and W.M.Leung,2007: Temperature projections in Hong Kong based on IPCC fourth assessment report (Hong Kong Observatory, Trans.). [Available online at: http://www.weather.gov.hk/publica/reprint/r764.pdf.]
Li,J.X.,C.H.Song,L.Cao,F.G.Zhu,X.L.Meng,and J.G.Wu, 2011:Impacts of landscape structure on surface urban heat islands:A case study of Shanghai,China.Remote Sensing of Environment,115(12),3249–3263.
Li,Q.,H.Zhang,X.Liu,J.Huang,2004:Urban heat island e ff ect on annualmean temperatureduring the last50 years in China. Theor.Appl.Climatol.,79(3–4),165–174.
Lo,C.P.,and D.A.Quattrochi,2003:Land-use and land-cover change,urban heat island phenomenon,and health implications:A remote sensing approach.Photogrammetric Engineering&Remote Sensing,69(9),1053–1063.
Michelozzi,P.,and Coauthors,2007:Assessmentand prevention of acute health e ff ects of weather conditions in Europe,the PHEWE project:Background,objectives,design.Environmental Health,6,1–10,doi:10.1186/1476-069X-6-12.
Nichol,J.E.,1996:Analysis of the urban thermal environment w ith Landsatdata.Environmentand Planning B:Planning& Design,23,733–747.
Nichol,J.E.,2005:Remote sensing of urban heat islands by day and night.Photogrammetric Engineering&Remote Sensing, 71(5),613–621.
Nijman,T.E.,and F.C.Palm,1990:Predictiveaccuracy gain from disaggregate samp ling in ARIMA models.Journal of Business&Economic Statistics,8(4),405–415.
Ning,L.,and R.S.Bradley,2014:Winter precipitation variability and corresponding teleconnections over the northeastern United States.J.Geophys.Res.Atmos.,119,7931–7945.
Ning,L.,E.E.Ridd le,and R.S.Bradley,2015:Projected changes in climate extremes over the northeastern United States.J. Climate,28,3289–3310.
Oke,T.R.1973:City sizeand the urban heat island.Atmos.Environ.,7(8),769–779.
Ren,G.Y.,Y.H.Ding,Z.C.Zhao,J.Y.Zheng,T.W.Wu,G. L.Tang,and Y.Xu,2012:Recent progress in studies of climate change in China.Adv.Atmos.Sci.,29(5),958–977,doi: 10.1007/s00376-012-1200-2.
Siu,L.W.,and M.A.Hart,2013:Quantifying urban heat island intensity in Hong Kong SAR,China.EnvironmentalMonitoring and Assessment,185(5),4383–4398.
Sonali,P.,and D.N.Kumar,2013:Review of trend detection methods and their app lication to detect tem perature changes in India.J.Hydrol.,476,212–227.
To,W.M.,2014:Association between energy use and poor visibility in Hong Kong SAR,China.Energy,68,12–20.
To,W.M.,2015:Greenhouse gases em issions from the logistics sector:the case of Hong Kong,China.Journal of Cleaner Production,103,658–664.
To,W.M.,T.M.Lai,W.C.Lo,H.K.Lam,and W.L.Chung, 2012:The grow th pattern and fuel life cycle analysis of the electricity consumption of Hong Kong.Environmental Pollution,165,1–10.
UN,2014:World Urbanization Prospects—The 2014 Revision. The United Nations’Population Division,New York,7–16 pp.
Wang,W.C.,Z.M.Zeng,and T.R.Karl,1990:Urban heat islands in China.Geophys.Res.Lett.,17(13),2377–2380.
Ye,X.F.,R.Wol ff,W.W.Yu,P.Vaneckova,X.C.Pan,and S.L. Tong,2012:Ambient temperature and morbidity:A review of epidemiological evidence.EnvironmentalHealth Perspectives,120(1),19–28.
Zhou,D.C.,S.Q.Zhao,L.X.Zhang,G.Sun,and Y.Q.Liu,2015: The footprint of urban heat island e ff ect in China.Scientifc Rep orts,5,11 160,doi:10.1038/srep11160.
:To,W.-M.,and T.-W.Yu,2016:Characterizing theurban temperature trend using seasonalunit rootanalysis:Hong Kong from 1970 to 2015.Adv.Atmos.Sci.,33(12),1376–1385,
10.1007/s00376-016-6113-z.
(Received 20 April2016;revised 30 July 2016;accepted 1 August2016)
?Corresponding author:Wai-M ing TO
Email:wm to@ipm.edu.mo
?Institute ofAtmospheric Physics/Chinese Academy of Sciences,and Science Press and Springer-Verlag Berlin Heidelberg 2017
 Advances in Atmospheric Sciences2016年12期
- Advances in Atmospheric Sciences的其它文章
- Characteristicsof the Asian-Pacif c Oscillation in Boreal Summer Simulated by BCC CSM w ith Di ff erent HorizontalResolutions
- Role of the Oceanic Channel in the Relationshipsbetween the Basin/DipoleM ode of SST Anomalies in the Tropical Indian Ocean and ENSO Transition
- M odulation of TropicalCyclogenesis in theWestern North Pacif c by the Quasi-Biweekly Oscillation
- AnomalousWestern Pacif c SubtropicalHigh during Late Summer in Weak La Ni?na Years:Contrastbetween 1981 and 2013
- The Upstream“Strong Signals”of theWater Vapor Transport over the Tibetan Plateau during a Heavy Rainfall Event in the Yangtze River Basin
- Simulation by CM IP5M odelsof the Atlantic M ultidecadal Oscillation and ItsClimate Im pacts