
Characteristicsof the Asian-Pacif c Oscillation in Boreal Summer Simulated by BCC CSM w ith Di ff erent HorizontalResolutions
2016-11-25 03:08:33YazhouZHANGZhijieLIAOYaocunZHANGandFengNIE
Advances in Atmospheric Sciences 2016年12期
Yazhou ZHANG,Zhijie LIAO,Yaocun ZHANG,and Feng NIE
1SchoolofAtmospheric Sciences,Nanjing University,Nanjing 210023
2PLA 61936 Troop,Haikou 571100
Characteristicsof the Asian-Pacif c Oscillation in Boreal Summer Simulated by BCC CSM w ith Di ff erent HorizontalResolutions
Yazhou ZHANG1,2,Zhijie LIAO1,2,Yaocun ZHANG?1,and Feng NIE2
1SchoolofAtmospheric Sciences,Nanjing University,Nanjing 210023
2PLA 61936 Troop,Haikou 571100
The summer Asian–Pacific Oscillation(APO)is amajor teleconnection pattern that reflects the zonal thermal contrast between EastAsiaand theNorth Pacific in theupper troposphere.TheperformanceofBeijing ClimateCenterClimateSystem Models(BCC CSM s)w ith di ff erenthorizontal resolutions,i.e.,BCC CSM 1.1 and BCC CSM 1.1(m),in reproducing APO interannual variability,APO-related precipitation anomalies,and associated atmospheric circulation anomalies,isevaluated. The results show that BCC CSM 1.1(m)can successfully capture the interannual variability of the summer APO index.It is also more capable in reproducing the APO’s spatial pattern,compared to BCC CSM 1.1,due to its higher horizontal resolution.Associated w ith a positive APO index,the northward-shifted and intensified South Asian high,strengthened extratropicalwesterly jet,and tropicaleasterly jetin theupper troposphere,aswellas the southwesterlymonsoonal flow over North A frica and the Indian Ocean in the lower troposphere,are realistically represented by BCC CSM 1.1(m),leading to an improvement in reproducing the increased precipitation over tropical North A frica,South Asia,and East Asia,asw ell as the decreased precipitation over subtropical North Africa,Japan,and North America.In contrast,these features are less consistentw ithobservationswhen simulated by BCC CSM 1.1.Regression analysis further indicates thatsurface temperature anomalies over the North Pacific and the southern and western flanks of the Tibetan Plateau are reasonably reproduced by BCC CSM 1.1(m),which contributes to the substantial improvement in the simulation of the characteristicsof summer APO compared to thatof BCC CSM 1.1.
Asian–Pacific Oscillation,BCC CSM,horizontal resolution,simulation
1. Introduction
A large-scale extratropical teleconnection pattern in boreal summer,named the Asian–Pacific Oscillation(APO), has recently been identified.It is characterized by a zonal seesaw ofm id latitudinal upper-tropospheric temperature between Asia and the Pacific.The high(low)tropospheric eddy temperature over Eurasia is usually accompanied by low(high)eddy temperatureover the North Pacific(Zhao et al.,2007).The APO exhibitsnotable interannualand interdecadal variability,and appears in the non-summer seasons aswell(Zhao etal.,2008).
Previous studies have revealed that the APO is closely linked to the Asian summermonsoon andmonsoonalprecipitation(Zhao etal.,2007).Corresponding to a higher APO index,low-level anomalous southerly w ind prevailsover the m idlatitudes of East Asia,and anomalous westerly w ind occupies South Asia and the South China Sea region,which indicatesa strengthened Asian summ ermonsoon.Asa result, precipitation increasesover South Asia and the northern and southernsidesof the YangtzeRiver,butdecreasesaround the Yangtze River and the Philippines.Therefore,the APO index can be used to indicate the variability of the Asianmonsoon and rainfall(Zhao et al.,2007,2008).From a decade w ith low APO to onew ith high APO,rainfall generally enhances over the Asian monsoon region and decreases over North America(Zhao etal.,2011).In addition,the relationship between the APO index and Asianm onsoonal precipitation has also been investigated on the interdecadal time scale (Zhou etal.,2009;Liu etal.,2011).
The APO is positively correlated w ith tropical cyclone frequency in the western North Pacific.When the APO is above(below)normal in summer,more(fewer)tropical cyclones tend to form in thewestern North Pacific(Zhou etal., 2008;Zou and Zhao,2011).The APO index has a significantnegative correlationw ith thewestern Pacific subtropical high(Huang etal.,2013).Associated w ith the variation ofthe summer APO,significant anomalous circulation signals can even be observed over the Asia–Pacific–America sector (Zhou and Zhao,2010).Furthermore,the APO’s variability is closely linked w ith SST in the Pacific,w ith a significant positive(negative)correlation between the APO index and SST over the extratropicalNorth Pacific(tropicaleastern Pacific)on the interannual timescale(Zhou etal.,2010;Zhao et al.,2010).
Therefore,exp loring the physicalmechanism responsible for the formation and maintenance of the APO is necessary for predicting the variation in the climate of the Northern Hemisphere.Zhao et al.(2008)suggested that the formation of the APO is related to the di ff erence in solar radiation between the Asian continentand the North Pacific.The thermale ff ectof the Tibetan Plateau(TP)intensifies the temperature of the local troposphereand decreases the tropospheric temperatureover theNorth Pacific throughzonaland vertical circulations,leading to the formation of the APO.A number of attempts have been made to understand the m echanism responsible for the formation of the APO and its associated climate anomalies by using global climatem odels. Asa result,ithasbeen proven that themajor characteristics and dynamicalstructuresof the APO in summer can be captured by some coupled climate system models(CSMs;Zhao etal.,2010;Man and Zhou,2011;Chen et al.,2013b),and the relationshipbetween theAPO and Pacific SSTcanbesuccessfully reflected in CCSM 3 simulations(Nan et al.,2009; Zhao etal.,2010).Recently,Huang etal.(2013)assessed the predictability of the summer APO index using the European M ulti-model Ensem ble System and found that thesemodels can predict the interannual variability of the summer APO w ell.Chen et al.(2013a)further indicated that the summ er APO and its associated climate anomalies can be predicted by NCEPCFSv2 by up to 5months in advance.
The above studies illustrate the importance of evaluating the capability of various climate models in simulating the characteristics of the APO when attempting to predict circulation anomaliesassociated w ith it.The capabilitiesof CSMs to realistically reproduce the currentstate of regional and global climate is vitally important for reliable projections of climate change in the future(Kidston and Gerber, 2010).However,few e ff orts have been made to investigate theimpactofmodel resolution on thesimulation of the APO. Since the complexity of the topography and underlying surfacestate can bebetter described in climatemodelsw ith relatively higher resolution,high-resolutionmodel simulations provideusw ith an opportunity to analyze the subsequentinfluenceof such high horizontal resolutionson the simulation of the APO.
The present study evaluates the ability of two versions of BCC-CSM,w ith di ff erent resolutions,i.e.,BCC CSM 1.1 and BCC CSM 1.1(m),in sim ulating the variability of the large-scale APO pattern and associated atmospheric circulation anomalies.The aim is to addresswhether the observed characteristicsof the summer APO can be reproduced in the twomodels,and,if so,what the impact isof the higherhorizontal resolution in BCC CSM 1.1(m)on the simulation of the characteristicsof thesummerAPO.Reasons forany identified improvementsin thesimulation of thesummerAPO by BCC CSM 1.1(m)w ill then be identified.
Follow ing this introduction,the models,datasets and method applied in the study are described in section 2.Section 3 presents the observed characteristicsof the APO and associated precipitation,as well as themodel results.The possible reasons for any identified improvements in the simulation of the APO by BCC CSM 1.1(m)arediscussed in section 4.Finally,conclusionsand a discussion are provided in section 5.
2.Models,data andmethods
BCC CSM is a coupled climate system model,including atmosphere,ocean,land surface and sea ice components.There are two versionsof themodel system w ith different horizontal resolutions,i.e.,BCC CMS1.1 and BCC CSM 1.1(m).Both models have been involved in CM IP5 (Jiang etal.,2012).A comprehensive atmospheric general circulation model(BCC AGCM 2.1)derived from NCAR CAM 3 and modified by Wu et al.(2008),version 4 of the GFDL’s MOM(Gri ffi es et al.,2004),GFDL’s Sea Ice Simulator(W inton,2000),and version 1.0 of the BCC’s A tm osphere and Vegetation InteractionModel(Jietal.,2008),are interactively coupled in BCC CSM 1.1 using version 5 of the NCAR’s coupler(Wu,2012).No flux adjustment is implemented in BCC CSM 1.1.TheOGCM,MOM,has40 vertical layersand the nominalhorizontal resolution is1°×1°,w ith equatorial refinement to 0.33°between 30°Sand 30°N.The horizontal resolution and the sea–land distribution in the sea icemodel are the same as that in MOM.BCC CSM 1.1(m) isan advanced version of BCC CSM 1.1,w ith amoderate atmospheric resolution.Compared to BCC AGCM 2.1,which is used in BCC CSM 1.1 and runs at a T42 spectral resolution(approximately 2.8°×2.8°),the atmospheric componentof BCC CSM 1.1(m)isBCC AGCM 2.2,which runsata T106 horizontal resolution(approximately 1.125°×1.125°). Both models use a terrain-follow ing vertical hybrid sigmapressure coordinate,w ith 26 levels and a rigid lid at 2.914 hPa.The dynamical framework and physical processes are the same in the twomodels and are fully introduced in Wu etal.(2008,2010).A fairnumber of studieshave evaluated the performance of the twomodels in climate simulation and the projection of future climate change,especially regarding thesimulation of precipitation and temperature fields(Gao et al.,2012;Gao etal.,2013;Xin et al.,2013).Nevertheless, many previous studies have focused mainly on changes in surface air temperature.Few researchershave paid attention to themodels’abilities in reproducing thevariation in uppertropospheric eddy temperature(Zhou and Zhang,2012).
Monthlymodel outputsof the CM IP5 historical simulation experiments of the twomodels for 31 summers(June–July–August)from 1979 to 2009 are used in this study.The external forcing of the historical sim ulations changes w ith tim e,including m ixed greenhouse gases(CO2,N2O,CH4, CFC11,and CFC12),aerosols,ozone,volcanoesand solar ra-diation.All the forcing data are provided by CM IP5,except forvolcanoes.The temporal resolution of CO2emissionsand solar radiation is1 year,while the time intervalof theaerosol data is 10 years.For the purpose of comparison w ith other model results,the present study uses the observational data from NCEP–DOEReanalysis-2(Kanamitsu etal.,2002)and CMAP(Xieand Arkin,1997)to validate thesimulationsand discuss the biases.The data after 1979 are chosen because satellite observationsbecome available since then and the reanalysisdata aremore reliable and homogeneous than during thepre-satelliteperiod(Dell’Aquilaetal.,2005).
EOF analysis isapplied to the eddy temperature to identify the APO teleconnection pattern over theNorthern Hemisphere.A weighting by latitudeisapplied to the EOF results. Regression and correlation analysesare conducted to explore relationshipsbetween pairsof variables,while the statistical significanceof correlation coe ffi cients,regression valuesand long-term variation trends are assessed using the Student’s t-test.Besides,in order to compare the sim ulationsw ith observations,themodel results are interpolated to the observationalgridsusing the bilinear interpolationm ethod.
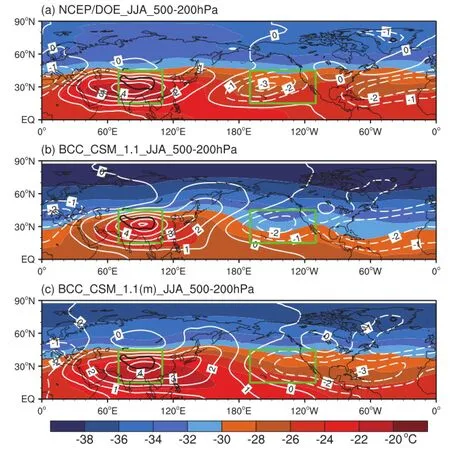
Fig.1.The climatology of the summer mean upper-tropospheric(500–200 hPa)T(colorshaded;units:°C)and T′(contours;units:°C)during 1979–2009 for(a)NCEP,(b) BCC CSM 1.1,and(c)BCC CSM 1.1(m),respectively.The thick black line denotes the orographic isocline of themain body of the TP.And the green boxes represent the key regions selected to construct the APO index.
3.APO simulation results
3.1.Sim ulation ofupper-tropospheric temperature
Since theAPO isdefinedby theupper-tropospheric(500–200 hPa)eddy temperature(T′;Zhao etal.,2007),which is obtained by removing the zonalmean temperature(T)from the total air temperature(T),i.e.,T′=T-T,we first investigate thedistributionsofobserved and sim ulated summer mean totalair tem peratureand eddy temperatureover the upper troposphere(Fig.1).The observed T gradually decreases from the south to the north,and themain temperature band is oriented from west to east,w ith amaximum temperature center greater than-20°C located over the southern flank of the TP(Fig.1a).Compared w ith the observation,bothmodels capture the distributional feature of T,which decreases from low to high latitudes.However,BCC CSM 1.1 systematically underestimates the intensity of T.The range of the simulatedmain temperature band ismuch smaller than the observed result,and the temperature center ismainly located in the TP region(Fig.1b).Compared w ith BCC CSM 1.1, BCC CSM 1.1(m)realistically simulatesnotonly the temper-atureband thatisoriented from westto east,butalso themaximum temperature center.This result indicatesa remarkable improvement in reproducing the upper-tropospheric total air temperature by BCC CSM 1.1(m),due to itshigherhorizontal resolution(Fig.1c).
The features of observed and simulated eddy temperatureare furtherexamined in Fig.1.A prominentout-of-phase variational pattern of eddy temperature exists in them idlatitudesbetween Asiaand the Pacific in borealsumm er.Positive values occupy the lower andm idd le latitudesof Asia,w ith a high temperature center of 4°C located over the TP region. Negativevaluesappear over the central-eastern Pacific,w ith aminimum value of-3°C(Fig.1a).Additionally,another centerof negativeeddy temperature occursover the Atlantic region.These features are realistically captured by the two models,except that the value of the positive eddy temperature center simulated by BCC CSM 1.1 is about6°C,which is approximately 2°C higher than observed;plus,the simulated negative eddy temperature center is about-2°C,which is lower than observedby approximately 1°C.Comparedw ith thesimulation of BCC CSM 1.1,thesim ulated positive center over the TP region by BCC CSM 1.1(m)is closer to the observation,but the simulated negative centerover the centraleastern Pacific is located furthereastward than observed.
The di ff erence between themodel resultsand the reanalysisdatashows thatthe climatological totalair temperatureis notably underestimated throughouttheNorthern Hemisphere in the results of BCC CSM 1.1.The simulated warm biases of eddy temperature appear along the northern flank of the TP,while cold biasesm ainly occur over South America (Fig.2a).Compared w ith that in BCC CSM 1.1,the intensity of simulated totalair temperatureise ff ectively enhanced in BCC CSM 1.1(m)(Fig.2c),especiallyoverm idlatitudeareas.Warm biases of the simulated total air temperature in BCC CSM 1.1(m)mainly occurover the central-western Pacific,while cold biasesmainly appear over South America. The distribution of the simulated eddy temperature bias in BCC CSM 1.1(m)is similar to that of the total air temperature.The positive anomaly center is situated over the central Pacific,w ith amaxim um value exceeding 2.5°C;and the negativeanomaly center liesover South America,w ith am inimum value lower than-2°C(Fig.2b).
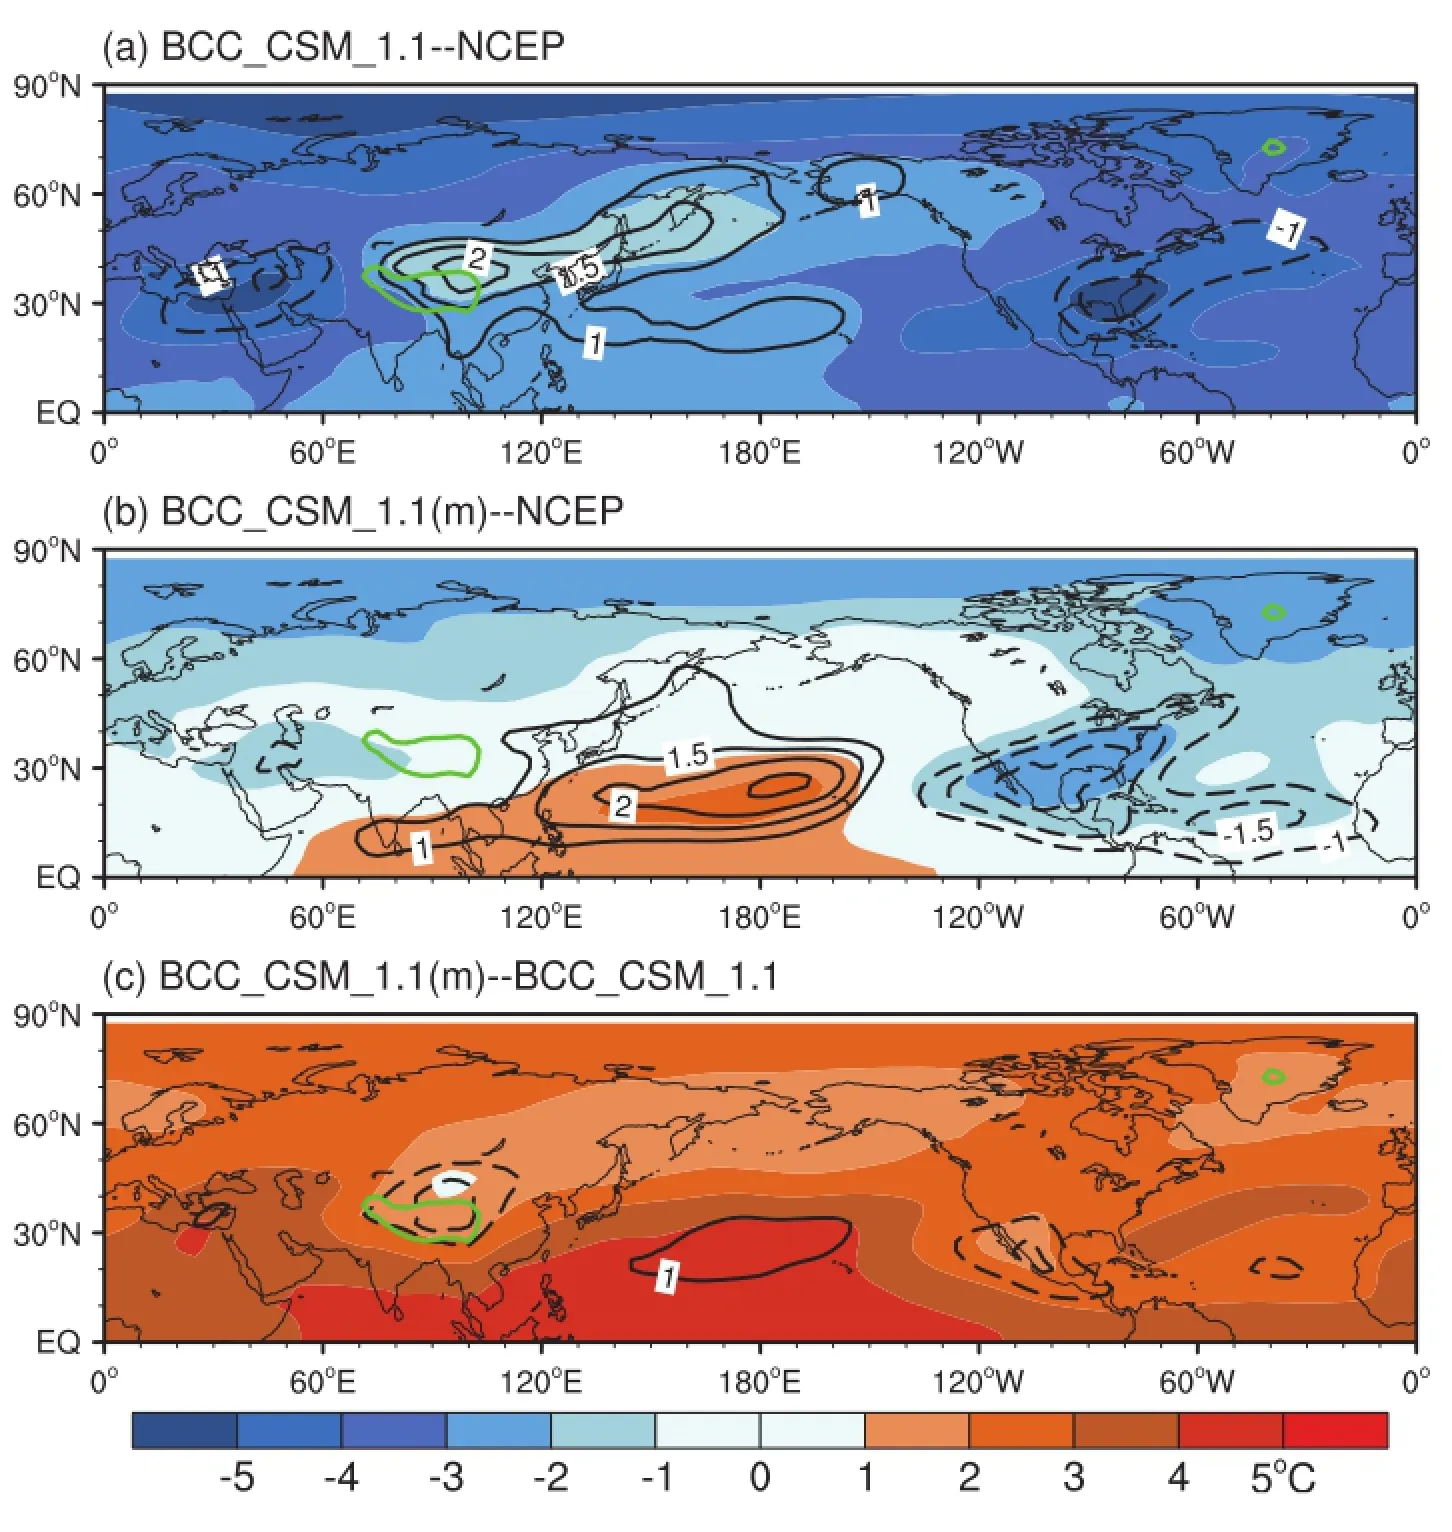
Fig.2.Di ff erences in climatological T(color-shaded;units:°C)and T′(contours;units: °C)between(a)BCC CSM 1.1 and NCEP,(b)BCC CSM 1.1(m)and NCEP,and(c) BCC CSM 1.1(m)and BCC CSM 1.1.The thick green line indicates the orographic isocline of themain body of the TP.The thick green line indicates the topographic contourof 3000m.
The Taylor diagram between outputs of the two modelsand observations shown in Fig.3 further illustrates that, although BCC CSM 1.1(m)is better able to reproduce the upper-tropospheric total air temperature than BCC CSM 1.1, the eddy temperature simulated by BCC CSM 1.1 is overall moreagreeablew ith theobservation,notonly in theNorthern Hemispherebutalso in regionsover EastAsia and theNorth Pacific.M eanwhile,itisnoteworthy thatbothm odelsexhibit better capacity for simulating the eddy tem perature over East Asia than over the North Pacific,which is contrary to the results of previousmodel studies(Huang etal.,2013;Chen et al.,2013a).Possible reasonsw illbediscussed in section 5.
3.2.Sim ulation of the APO
Because the APO is identified through the contrast in upper-tropospheric eddy temperature between Asia and the North Pacific,onemay speculate that the reasonable simulation of climatological eddy temperature in BCC CSM 1.1 should lead to a bettersimulation of the characteristicsof the APO.To exam ine thisassertion,the simulated spatial pattern and interannual variability of the APO are exam ined in this subsection.
Follow ing Zhao etal.(2010,2012),an EOF analysisof the observed and simulated eddy temperature is performed for theperiod 1979–2009 to reveal the teleconnection pattern over the Northern Hemisphere in summer.The regression map of the vertically integrated eddy temperature from observations and simulations between 500 and 200 hPa w ith respect to the normalized PC1 is shown in Fig.4.The first EOFmode of observations accounts for 20.3%of the total variance,manifesting a prominentout-of-phase relationship of temperature between Africa–Eurasia and the North Pacific region.Two positive centers are located over North Africa and East Asia,respectively,w ith themaximum value exceeding 0.04,while a negative center is situated over the North Pacific,w ith aminimum valuebelow-0.04(Fig.4a). Compared w ith observations,it is found that BCC CSM 1.1 can reproduce the negative center over the North Pacific,but fails to reproduce the two positive centers over North A frica and East Asia.Instead,it produces a false positive center over South America(Fig.4b).The EOF1 pattern simulated by BCC CSM 1.1(m)agreeswellw ith the observation, and the out-of-phase relationship of temperature between Africa–Eurasia and the North Pacific region in the Northern Hem isphere is reflected well.The spatial correlation coefficients between observations and outputs of BCC CSM 1.1 and BCC CSM 1.1(m)are 0.40 and 0.77,respectively,indicating that thesimulated spatialpattern of the APO isgreatly improved in BCC CSM 1.1(m).
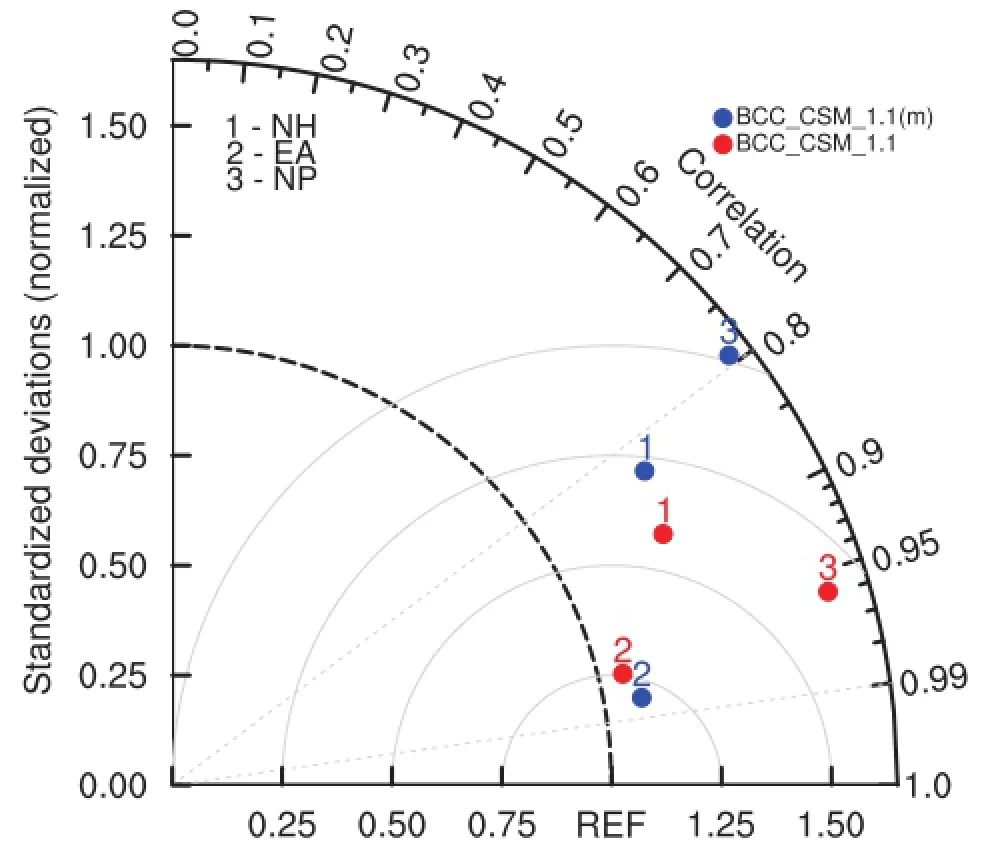
Fig.3.Taylor diagram comparing the spatial statisticsbetween the simulations of the two BCCmodels and observations for the summermean T′over the Northern hem isphere(NH),East Asia(EA)and the North Pacific(NP)regions during 1979–2009.“REF”denotes the NCEP–DOE reanalysis;the azimuth angle indicates thespatialcorrelation coe ffi cientbetween observationsandmodeloutputs;the radialdistance indicates thestandard deviationbetween observationsandmodeloutputs;and the distance from“REF”represents the centralized RMSE.
To investigate the interannual variability of the APO, we define the APO index as the arithmetic di ff erence between the Asian tropospheric eddy temperature index(AI) and the North Pacific tropospheric eddy temperature index (PI),where the AIand PIare computed by the regionally averaged upper-tropospheric(500–200 hPa)T′over(15°–45°N,70°–110°E)and(15°–45°N,170°–110°W),respectively(Zhao et al.,2007;Huang et al.,2013).The above selected key regions for AIand PIaremarked in Fig.1.The capability of themodels in reproducing the APO’s interannual variability ismeasured by the detrended correlation coe ffi cients(CC-I)between the observed and simulated AI,PI and APO indices.Figure 5g show s that the observed APO index exhibitssignificantinterannualvariability in the last30 years,w ith a linear descending trend of-0.041°C yr-1(exceeding the 95%confidence level),which is consistentw ith previous findings(Huang etal.,2013).Thevariational trend of the AIis consistentw ith thatof the APO index(Fig.5g), while the PIdisplaysaweak ascending trend that isnot significant(Fig.5d).Therefore,theweakening trendof the APO index can bemainly attributed to the decreasing trend of the upper-tropospheric eddy temperature over land,im plying an enhanced therm al contrast between Asia and the North Pacific in recent decades.Since the APO index has a distinct linear trend,all the linear trendsof the indicesare removed to investigate the interannualvariability of the APO.
The CC-Ivaluesof the AI,PIand APO index are-0.17, 0.02 and-0.09,respectively,in BCC CSM 1.1,which are very low andnotsignificant.Comparedw ith theobservation, BCC CSM 1.1 fails to reproduce the interannualvariability of the APO index.Furtheranalysis indicates thatthis failurecan be attributed to the unreasonable sim ulation of the AIand PI, suggesting that BCC CSM 1.1 performs poorly in reproducing the variation of the APO.A lthough a linear trend can be detected in BCC CSM 1.1,the result is opposite to that derived from the observation(Fig.5;middle panels).Figure 5 (lower panels)displays the evolution of the summer AI,PI and APO index from 1979 to 2009 in BCC CSM 1.1(m).TheCC-Ivaluesof the AI,PIand APO index are 0.35,0.33 and 0.40,respectively,and all exceed the 95%confidence level. These resultsdemonstrate thatBCC CSM 1.1(m)ismore capable than BCC CSM 1.1 when it comes to reproducing the interannual variability of the APO.However,the linear decreasing trend of the APO index is not significant in the resultsof BCC CSM 1.1(m),suggesting that it lacksskill in reproducing the long-term variability of the APO pattern.Note that thisphenomenon isalso found in some other clim atesystem models(Huang etal.,2013).
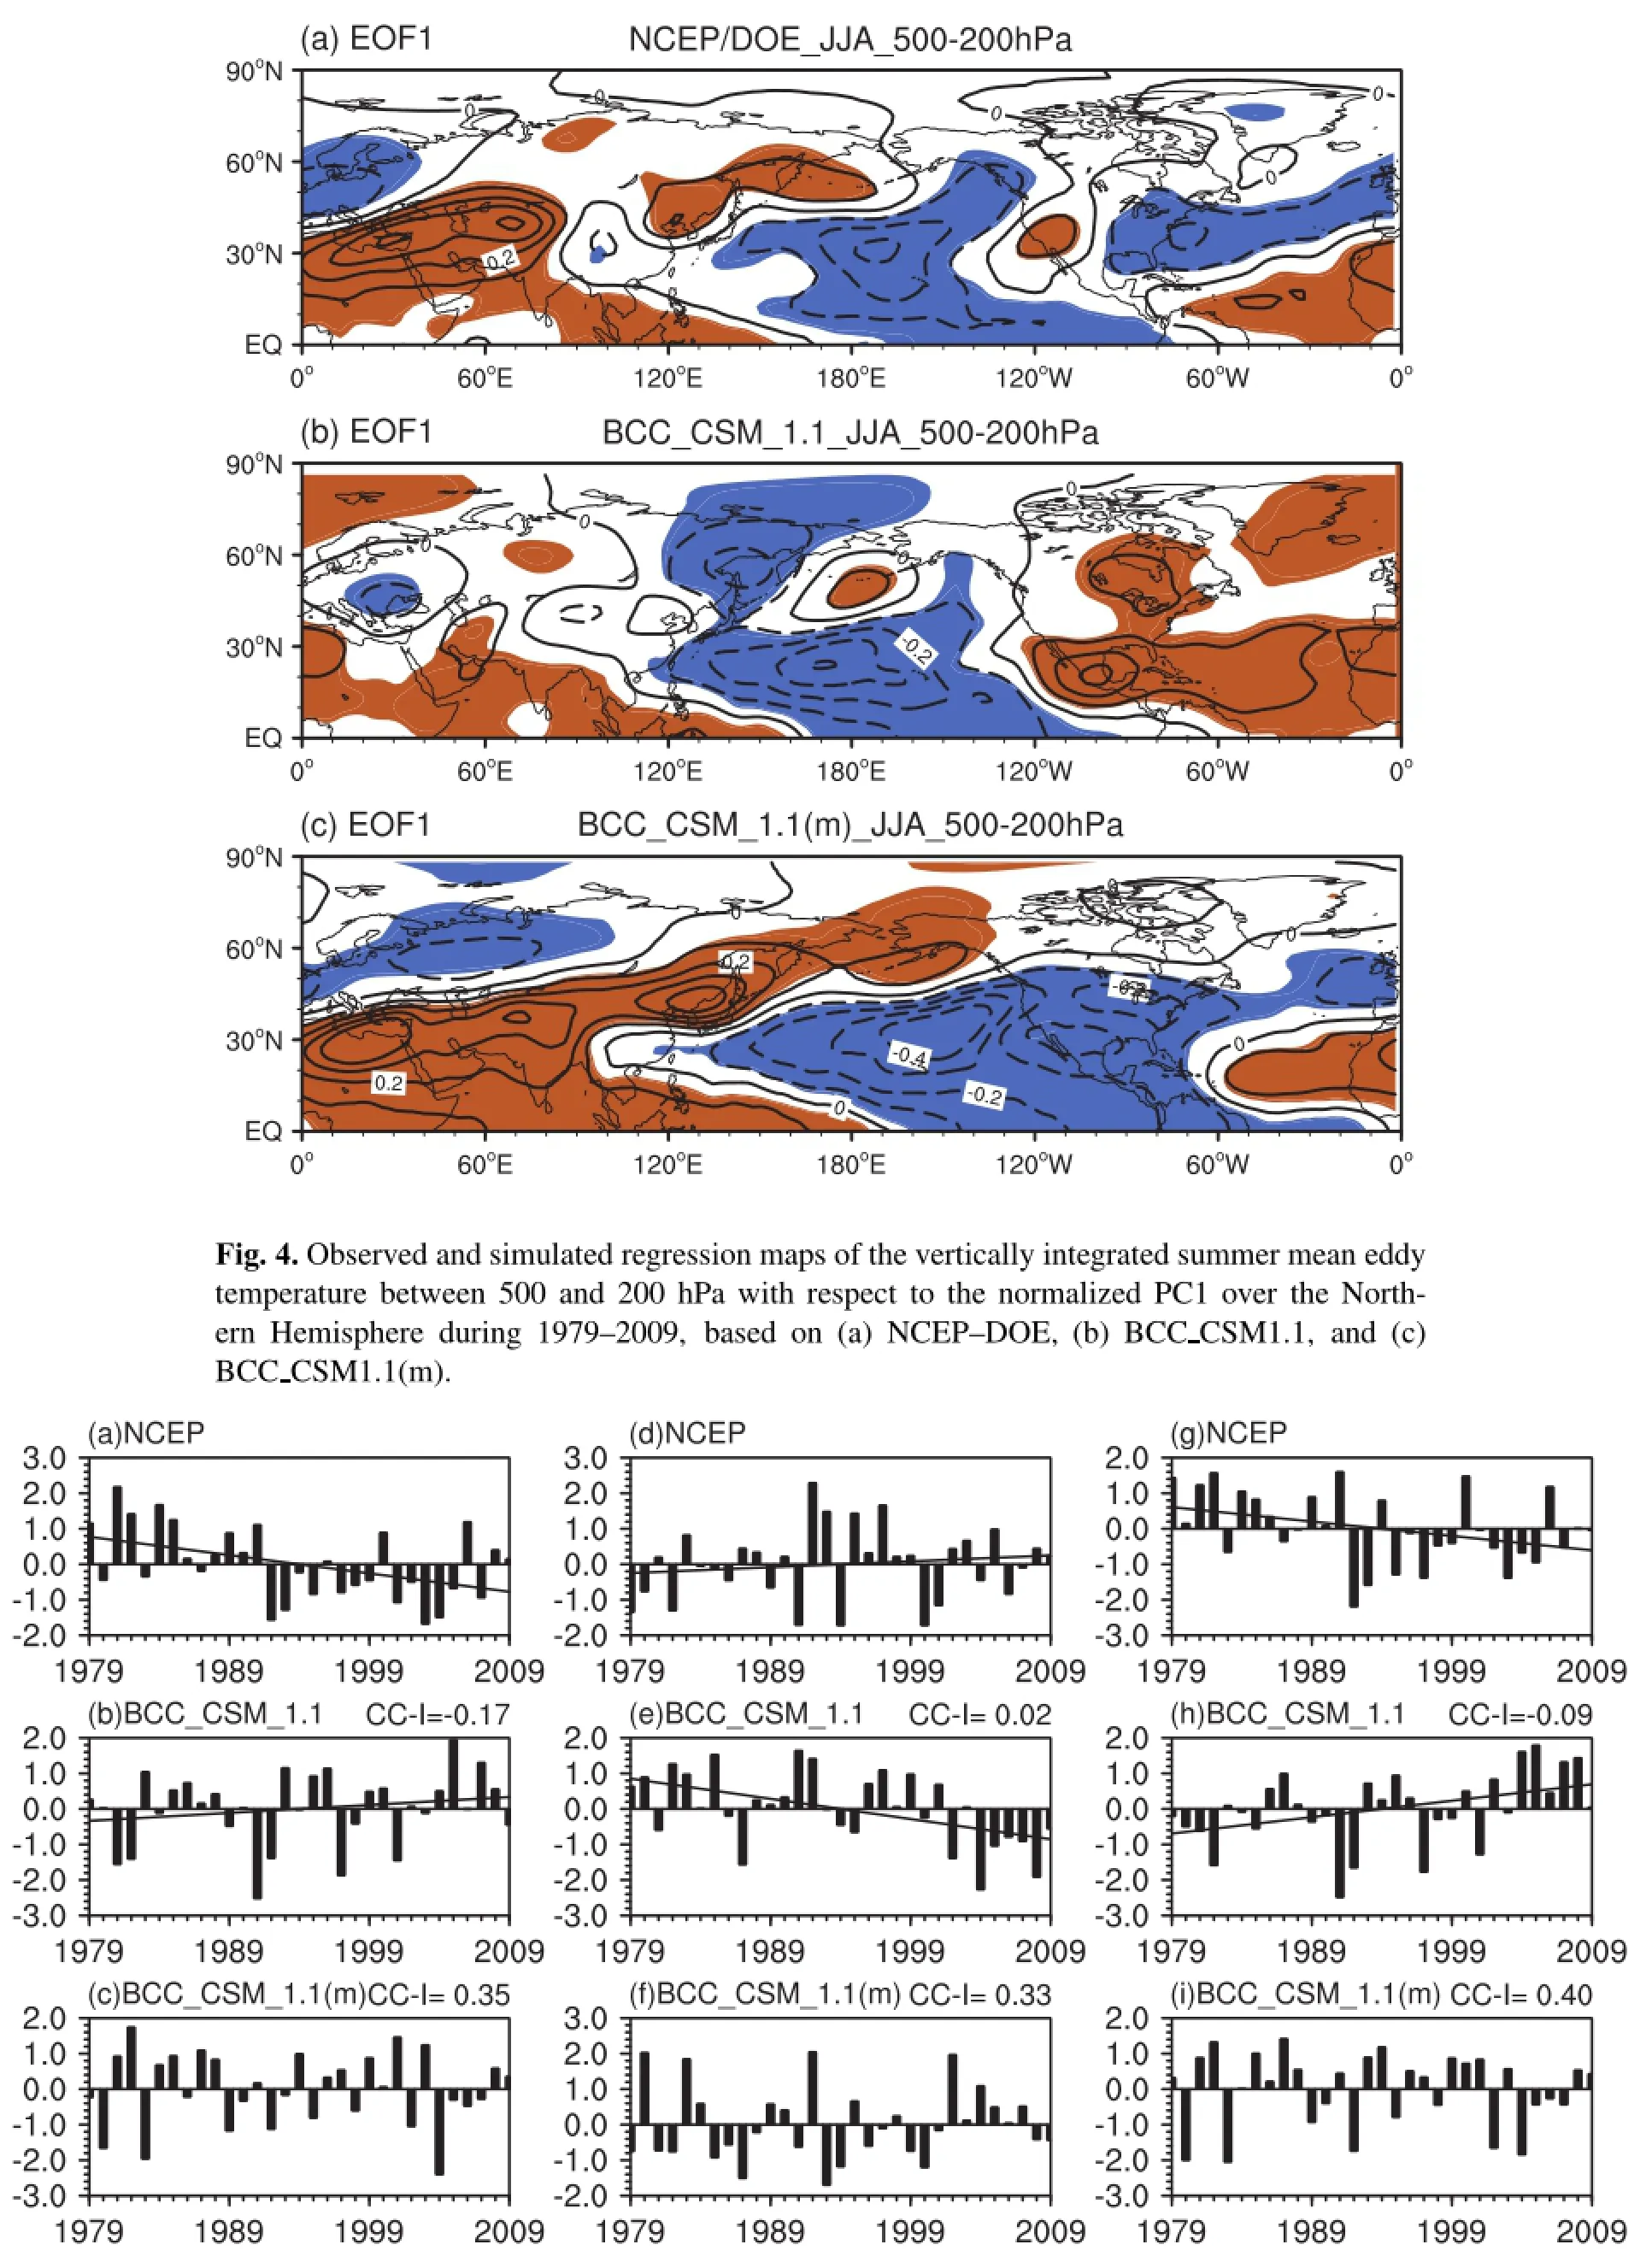
Fig.5.Normalized summer(a–c)AI,(d–f)PI,and(g–i)APO indicesduring 1979–2009,based on NCEP–DOE(upper panels), BCC CSM 1.1(m iddle panels),and BCC CSM 1.1(m)(lower panels).The detrended correlation coe ffi cient(CC-I)between observations andmodel results ismarked in the top-right corner of each panel,and the solid line indicates the linear trend of the index.
3.3.Simulation ofAPO-related precipitation
Figure6 displays regressionmapsofprecipitation against the APO index from the model outputs and observations. The observed result(Fig.6a)shows that,corresponding to the APO’s positive phase,positive precipitation anomalies mainlyoccurover thesummermonsoon regionsof theNorthern Hemisphere,including Mexico,East Asia,South Asia and West A frica.Positive precipitation anomaliesalso occur in the lower-latitude region of the centralPacific.On the contrary,negative precipitation anomalies appear over the western and northern parts of themonsoon regions,such as extratropicalNorth America,central-western Asia,the M iddle East,and North Africa,where themonsoon–desertcoupling phenomenon is distinct(Zhao et al.,2007).The above results derived from observationsare consistentw ith previous findings(Zhao etal.,2012).
Figure 6c presents a regressionmap of summer precipitation w ith respect to the APO index in BCC CSM 1.1(m). In general,BCC CSM 1.1(m)captures the characteristics of the rainfall distribution associated w ith the APO index well, such as the positive precipitation anom aly band extending from 30°E to 150°W,as well as the negative precipitation anomaly band along 40°N thatextends from western Africa to the extratropicalPacific and North America.Positive precipitation anomalies are mainly found over the tropics of South America,Mexico’smonsoon region,the subtropicsof central-western Pacific,the Indochina Peninsula,India,and tropical North Africa.However,the simulated positive precipitation anomalies in Mexico and tropicalNorth Africa are lesssignificantthanobserved.Thesimulated relationship between precipitation and the APO index in BCC CSM 1.1(m) agreesqualitatively w ith the observation.
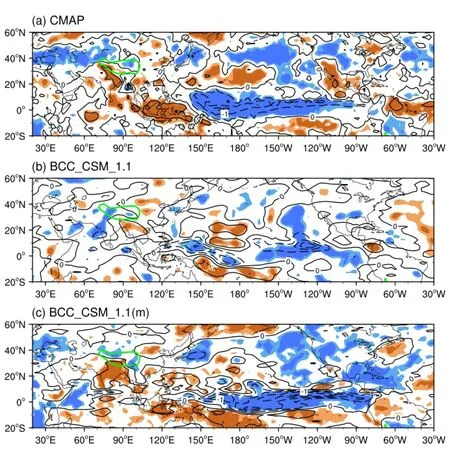
Fig.6.Regressionmapsof summer precipitation(units:mm d-1)with reference to thenormalized APO index for(a)CMAP,(b)BCC CSM 1.1,and(c)BCC CSM 1.1(m).The blue(brow n) color indicates thenegative(positive)precipitation anomalies.Areasof light(dark)shading are valuesat/above the90%(95%)confidence level.The thick green line indicates the topographic contourof 3000m.
Com paredw ith the observation,BCC CSM 1.1 fails to reproduce the relationship between the simulated precipitation anomaliesand the APO index(Fig.6b).The positiveprecip-itation anomalies over the summermonsoon regions of the Northern Hemisphere are largely underestimated,especially over India,the Indochina Peninsula,and Mexico.The simulated negative rainfall anomaly band along 40°N is also not consistentw ith observations,especially over central-western Asia and North America.Moreover,the simulated precipitation anomalies over the Pacific aremuch less significant than observed,indicating a lower ability of BCC CSM 1.1 in reproducing the APO-related precipitation in the Northern Hem isphere,as com pared w ith BCC CSM 1.1(m).
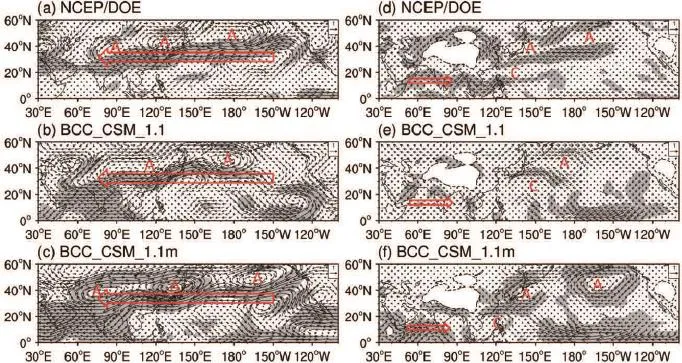
Fig.7.Regressionmapsof(a–c)200hPa(leftpanels)and(d–f)850 hPa(rightpanels)winds(units:m s-1)againstthenormalized APO index in summer for(a,d)NCEP–DOE reanalysis,(b,e)BCC CSM 1.1,and(c,f)BCC CSM 1.1(m),respectively. Shaded areas are values exceeding the 95%confidence level;the prevailing w ind is indicated by the red arrow,and the“C”(“A”)denotes the anomalous cyclone(anticyclone)center.The thick dashed line denotes the orographic isoline of 1500m in rightpanels.
4.Possible reasons for thesimulation im provement
4.1.Simulation of APO-related atmospheric circu lation anomalies Previous studies have revealed that the APO’s variability is closely linked to large-scale atm ospheric circulation anomalies that directly influence APO-related precipitation, such as the extratropicalwesterly jetover Eurasia,thewestern Pacific subtropical high,the South Asian high,and the Asian summermonsoon(Zhao etal.,2010,2012;Huang et al.,2013).Thus,we furtherexamine the APO-related atmospheric circulation anomaliessimulated by themodels. Figure 7 separately shows regression maps of w inds at 200 hPa and 850 hPa w ith respect to the summer APO index from 1979 to 2009,based on observations and the simulations of the two models.As shown in Fig.7a,a positive APO index is associated w ith the large-scale anomalous anticyclonic circulation that covers themidlatitude region from 60°E to 150°W at200 hPa,w ith three centersnear western Asia,northeastern Asia and the central-northern Pacific,respectively.This anticyclonic anomaly actually corresponds to the northward-extended and intensified South Asian high.Meanwhile,anomalous easterly w inds prevail from the central-eastern Pacific to Eurasian regions,and westerly anom alies appear along the northern flank of the aforementioned anomalous anticyclone centers over Eurasia and the North Pacific,indicating an enhanced extratropical upper-levelwesterly jet stream and a strengthened summer monsoon over South Asia and the South China Sea.The observed anomalous atmospheric circulations in the upper troposphere related to the APO are consistentw ith previous findings(Zhao et al.,2007;Huang et al.,2013).Figure 7b show s that BCC CSM 1.1 fails to reproduce the anomalous anticyclone center over Eurasia,and the simulated easterly w ind anomalies aremuch weaker and less significant than observed,especially over the North Pacific.Compared w ith BCC CSM 1.1,BCC CSM 1.1(m)generally reproduces the circulation anomalies associated w ith the APO;namely,the strengthened and northward-extended South Asian high,the intensified extratropicalwesterly jet,and the tropicaleasterly jet.This result suggests that the variation of the Asian summermonsoon associated w ith a positive APO index can be reasonably reproduced in BCC CSM 1.1(m).However,the simulated anomalous anticyclone center over North Pacific is located further eastward than observed(Fig.7c).Figure 7d further shows thatwhen the APO index isabove normal, two anomalous anticyclone centers emerge in the central-northern Pacific and Japan,respectively,at 850 hPa.Easterlyw ind anomaliesextend from the centralPacific to southern Japan,and anomaloussoutherly w indsareobserved over northeastern China,indicating that the East Asian summer monsoon intensifies.Meanwhile,westerly w ind anomalies prevail from the western Indian Ocean to the South China Sea,corresponding to the strengthened southwesterly monsoonal flow over these areaswhen the APO index is positive. The above atm ospheric circulation anomalies in the lower troposphere are sim ilar to results published in earlier studies (Zhao et al.,2007,2012).Compared w ith the observation, the anomalous anticyclone center situated over Japan is not reproduced in the simulation of BCC CSM 1.1,and the simulated easterly w ind anomalies over the central Pacific and the southwesterly w ind anomaliesover the Indian Ocean are notas significantas they are in theobservations,implying an underestimation of the anomalous circulations in the lower troposphere associated w ith the variation of the Asian summ erm onsoon(Fig.7e).Figure7f illustrates that,notonly the anomalous anticyclone centers,but also the prevailing w ind anomalies associated w ith the APO index,are well represented in BCC CSM 1.1(m).Apparently,BCC CSM 1.1(m) has significantly improved thesimulation of the atmospheric circulation anomalies over the lower troposphere,as comparedw ith BCC CSM 1.1.
Overall,the variational features of the Asian summermonsoon are better captured by BCC CSM 1.1(m)than BCC CSM 1.1.This is the reason why the simulation of monsoonalprecipitation is improved in BCC CSM 1.1(m),as shown in Fig.6.Precipitation anomalies around the TP can inducesoilmoisturevariation,and lead to increases in the tropospheric tem perature and intensification of the APO pattern (Liu etal.,2015).Therefore,compared w ith BCC CSM 1.1, the realistic simulation of the Asian summermonsoon’svariation in BCC CSM 1.1(m)could be a possible contributor to reproducing amore reasonable APO,since the interannual variability of the APO isclosely linked to thevariation of the Asian summermonsoon andmonsoonal precipitation(Zhao etal.,2007)
4.2.Simulation ofAPO-related surface temperature
The above analysis dem onstrates that BCC CSM 1.1(m) exhibitsan encouraging ability to reproducenotonly the interannual variation of the APO,but also the precipitation and atmospheric circulation anomalies related to the APO. Compared to BCC CSM 1.1,BCC CSM 1.1(m)has remarkably improved the simulation of the characteristics of the APO in summer.To better understand the reason why the finer horizontal resolution of BCC CSM 1.1(m)leads to a more reasonable simulation of the APO,we further investigate theobserved and simulated APO-related surface tem perature,which p lays a crucial role in the formation andmaintenance of the APO(Zhao et al.,2008).Figure 8 presents regressionmapsof surface temperature against the APO index in summer,from observationsandmodel results.Both the surface air temperature over land and SST are used for computation.
As shown in Fig.8a,the APO’s variability is closely linked to SST anomalies over the Pacific.When the APO index is above normal,large-scale significant and positive SST anomalies appear over the extratropical North Pacific from 120°E to180°E.Meanwhile,significantlynegativeSST anomalies prevail over the tropical eastern Pacific.Such a spatialpattern of SST anomaliessuggestsa potential linkage between the APO and ENSO,which is consistentw ith the findings of Zhou et al.(2010).However,sensitivity experiments have demonstrated that the SST anomalies over the two regions have opposite impacts on the intensity of the APO(Zhao et al.,2010),and the simultaneous SST variation over the tropical eastern Pacific alone cannot trigger a large-scale teleconnection pattern like the APO(Zhao et al.,2008).Thus,the tropical eastern Pacific SST anomalies captured by bothmodelsare not the key factor in determining the APO characteristics in summer.Figure8b shows that,although BCC CSM 1.1 can reproduce thenegativeSST anom aliesover the tropicaleastern Pacific,it fails to capture the positive SST anom alies in them idlatitudes of the North Pacific.Zhou etal.(2009)proposed thata significantly positive correlation exists between the APO and North Pacific SST on the interannual timescale.When the APO index is abovenormal,ananomalousanticyclonedominates the lower troposphere over the North Pacific,which is favorable for a warming of SST in the North Pacific.Meanwhile,negative heat fluxes appear in the North Pacific,accompanied by an intensification of northwardwarm wateradvection.All these factorsare favorable for awarming of SST in the North Pacific.Com pared w ith that in BCC CSM 1.1(Fig.8b),the regression map of positive SST anomalies over the North Pacific in BCC CSM 1.1(m)(Fig.8c)ismoreconsistentw ith the observation(Fig.8a),which contributes to the improvement in the BCC CSM 1.1(m)simulation of the characteristics of the APO.Thismay also explainwhy thesimulated PIismore realistic in BCC CSM 1.1(m)than in BCC CSM 1.1,since the North Pacific isa key region for defining the PI(Fig.5).
On the other hand,the formation of the APO is closely correlated w ith an elevation in the heating e ff ect of the TP (Zhao et al.,2008).In a recent study,Liu et al.(2015) proposed a new physicalm echanism linking w inter Pacific SST to the subsequentsummer’s APO.They pointed out that the previousw inter’s Pacific SST anomalies can persistuntil spring to cause an SLP anomaly over the North Indian Ocean in the subsequent spring and summer.The latter inducesanomalous verticalmotion thatmodulates the surface air temperature over the southern and western TP,maintaining the summer APO.The regressionmap of observed surface temperatureshows that,associated w ith a positive APO index,prominentnegativesurfaceair temperatureanomalies appear over the southern TP,while positive surface air temperature anomaliesoccur over thewestern TP region.Meanwhile,negative SST anomaliesem erge in the northern Indian Ocean(Fig.8a).The observed variation in surface temperature related to the APO index is highly consistentw ith the results of Liu et al.(2015,Fig.5a).Compared w ith the observation,the variational features of the surface temper-ature associated w ith the APO are successfully reproduced in BCC CSM 1.1(m),i.e.,both the negative(positive)surface air temperature anomalies in the southern(western)TP, and the SST anomalies over the northern Indian Ocean associated w ith the thermal e ff ect of the TP,are successfully captured by BCC CSM 1.1(m)(Fig.8c).In contrast,thesurface air tem peratureanom aliesover the southern and western TP,and the SST anom alies over the northern Indian Ocean, are not reproduced well by BCC CSM 1.1(Fig.8b).This result indicates that the physical processes responsible for maintaining thesummer APO can be realistically reflected in BCC CSM 1.1(m)but not in BCC CSM 1.1,which explains why BCC CSM 1.1(m)can produce a more reasonable AI (Fig.5)and ismore capable of reproducing the characteristicsof thesummer APO comparedw ith BCC CSM 1.1.
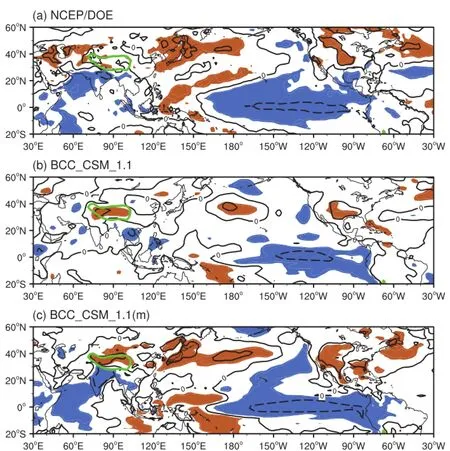
Fig.8.Regressionmaps of surface air tem perature(units:°C)over land and SST(units:°C) over ocean,with respect to the summer APO index,based on(a)NCEP–DOE reanalysis,(b) BCC CSM 1.1,and(c)BCC CSM 1.1(m).Shaded areas are values exceeding the 95%confidence level.The thick green line indicates the topographic contourof 3000m.
5.Conclusionsand discussion
The APO is an important teleconnection pattern that is closely associated w ith climate variations over the subtropics in summer,especially the Asian–Pacific sector.The APO index is a useful index for assessing large-scale circulation anomalies(Zhao etal.,2007,2012).In thispaper,weuse the monthly historicalsimulationsof two versionsof BCC CSM, w ith di ff erenthorizontal resolutions,i.e.,BCC CSM 1.1 and BCC CSM 1.1(m),along w ith NCEP–DOE reanalysis data, to evaluate themodels’performances in reproducing the interannual variability of the APO.APO-related precipitation and associated atmospheric circulation anomaliesare also investigated.The reason for the better simulation of the APO by BCC CSM 1.1(m)is exam ined.Them ain results can be summarized as follows:
(1)Both models can capture the spatial distribution of theupper-tropospheric totalair temperature,which decreases from low to high latitudes in summer. Compared w ith BCC CSM 1.1,BCC CSM 1.1(m)e ff ectively increases the simulated intensity of the total air temperature,and the results are closer to observations.However,analysis of the Taylor diagram shows that the simulated eddy temperature in BCC CSM 1.1 ismore consistentw ith the observation,not only over East Asia and the North Pacific,but also over the entire Northern Hemisphere,as compared to that simulated by BCC CSM 1.1(m).
(2)Compared w ith BCC CSM 1.1,the spatial pattern ofEOF1 simulated by BCC CSM 1.1(m)is highly consistent w ith that from theobservation.Thespatial correlation coe fficientsbetween observationsand theoutputsof BCC CSM 1.1 and BCC CSM 1.1(m)are0.40and 0.77,respectively.Meanwhile,the correlation coe ffi cientsbetween the observed and simulated AI,PI and APO index in BCC CSM 1.1(m)are 0.35,0.33 and 0.40,respectively,which are much higher than those between observations and the sim ulations of BCC CSM 1.1.BCC CSM 1.1(m)show s an encouraging capacity to reproduce not only the spatial pattern of the APO, but also the APO’s interannual variability,due to its higher horizontal resolution.In particular,BCC CSM 1.1(m)exhibits greater skill in simulating the interannual variability of the eddy temperature index in Asia than it does over the North Pacific.
(3)Based on comparisonsbetweenmodel resultsand observations,itis found thatBCC CSM 1.1(m)can successfully reproduce the APO-related atmospheric circulation anomalies,such as the northward-shifted and intensified South Asian high,the strengthened extratropicalwesterly jet,and the tropical easterly jet in the upper troposphere,as well as thesouthwesterlymonsoonal flow over the Indian Ocean and the intensified subtropicalanticycloneover theNorth Pacific and Japan in the lower troposphere.As a result,the increased precipitation over tropical North Africa,South Asia and EastAsia,and the decreased precipitation over subtropical North Africa,Japan and North America,simulated by BCC CSM 1.1(m),agree qualitatively w ith observations.In contrast,the circulation anomaliesassociated w ith a positive APO index in the sim ulation of BCC CSM 1.1 are less consistentw ith observations,which indicatesa poorperformance of BCC CSM 1.1 in simulating APO-related precipitation.
(4)Regression analysis further indicates that BCC CSM 1.1(m)can realistically capture SST anomaliesover the North Pacific and northern Indian Ocean,as well as the anomalous surface air temperature along the southwestern flank of the TP.These temperature anomalies are closely linked to themaintenance of the APO.However,these relationships arem issed by BCC CSM 1.1,suggesting that a higher horizontal resolution is crucial for BCC CSM to reasonably sim ulate the physical processes involved in the form ation and m aintenance of the APO in summer.Thismay explain why BCC CSM 1.1(m)can reproduce the APO’s interannual variability and accompanying circulation anomaliesmore reasonably than BCC CSM 1.1,and presentsa substantial improvement in simulating the characteristics of the APO and APO-related precipitation anomalies.
A lthough BCC CSM 1.1(m)is capable of simulating the APO teleconnection and its interannual variability in summer,it fails to reproduce the observed long-term variational trend of the APO index and the AIand PI.In fact,this phenomenon is also found in some other CSM s.Since the temporal resolution of aerosols used in most CSM s is 10 years, Huang etal.(2013)argued thatit ishard formodels to realistically simulatedecadal changes inw inter/spring snow depth over the TPundera constantaerosol concentration.Thisdirectly influences the simulation of the long-term variation in tropospheric temperatureover land areasof Asia.
Besides,several previous studies have revealed that CSM salways demonstrate a higher predictive skill over the North Pacific,ascompared to land areasof Asia.The lack of predictability over land areas is possibly associated w ith the complicated land–atmosphere interaction and feedback processesat play,whichmay notbe represented well inmodels (Chen et al.,2013a;Huang et al.,2013).Our results support this argum ent,since the increased horizontal resolution in BCC CSM 1.1(m)helps to improve the description of this complicated land–atmosphere interaction,and subsequently the surface temperatureover land(Jiang etal.,2015).
Itisworth noting thatthe resultsof thepresentstudywere obtained based on the historical simulation experiments of the twomodels.Since the APO isclosely linked to thevariation ofweatherand climate,it isalso necessary to assess the models’abilities in predicting the APO’s variation using results from hindcastexperiments.Moreover,the teleconnection pattern over the upper troposphere also exists in other, non-summ er,seasons.Further studies that evaluate the perform anceof themodels in simulating and predicting the APO and itsassociated climate variations in non-summer seasons are needed.
Acknow ledgements.The authors are very grateful for the insightful comments and suggestions of the three anonymous reviewers,which improved themanuscript.This work was jointly supported by the State Key Program of the National Natural Science of China(Grant No.41130963),and the National Natural Science Foundation of China(GrantNo.41575071).
Chen,J.M.,P.Zhao,S.Yang,G.Liu,and X.J.Zhou,2013a: Simulation and dynamical prediction of the summer Asian–Pacific Oscillation and associated climate anomalies by the NCEP CFSv2.J.Climate,26,3644–3656,doi:10.1175/ JCLI-D-12-00368.1.
Chen,X.L.,T.J.Zhou,and L.W.Zou,2013b:Variation characteristics of the Asian-Pacific Oscillation in boreal summer as simulated by the LASG/IAPClimate System Model FGOALSgl.Acta Meteorologica Sinica,71(1),23–37.(in Chinesew ith English abstract)
Dell’Aquila,A.,V.Lucarini,P.M.Ruti,and S.Calmanti,2005: Hayashispectraof the Northern Hem ispheremid-latitudeatmospheric variability in the NCEP-NCAR and ECMWF reanalyses.Climate Dyn.,25,639–652.
Gao,F.,X.G.Xin,and T.W.Wu,2012:A study of the prediction of regionaland global temperatureon decadal timescalewith BCC CSM 1.1model.Chinese Journal ofAtmospheric Sciences,36(6),1165–1179.(in Chinesewith English abstract)
Gao,X.J.,M.L.Wang,and F.Giorgi,2013:Climate change overChina in the21stcentury assimulated by BCC CSM 1.1-RegCM 4.0.Atmospheric and Oceanic Science Letters,6(5), 381–386.
Gri ffi es,S.M.,M.J.Harrison,R.C.Pacanowski,and A.Rosati, 2004:A technical guide to MOM 4.NOAA/Geophysical Fluid Dynam ics Laboratory,M arch 2004.[Available online athttp://www.gfdl.noaa.gov/fms.]
Huang,Y.Y.,H.J.Wang,and P.Zhao,2013:Is the interannual variability of the summer Asian-Pacific Oscillation predictable?.J.Climate,26,3865–3876.
Ji,J.J.,M.Huang,and K.R.Li,2008:Prediction of carbon exchangesbetween China terrestrialecosystem and atmosphere in 21stcentury.Science in China SeriesD:Earth Science,51, 885–898.
Jiang,J.H.,and Coauthors,2012:Evaluation of cloud and water vaporsimulations in CM IP5 climatemodelsusing NASA“ATrain”satelliteobservations.J.Geophys.Res.,117,D14105, doi:10.1029/2011JD017237.
Jiang,Y.M.,A.N.Huang,and H.M.Wu,2015:Evaluation of the performance of Beijing climate center climate system model w ith di ff erent horizontal resolution in simulating the annual surface tem perature over Central Asia.Chinese Journal of Atmospheric Sciences,39(3),535–547.(in Chinesewith English abstract)
Kanam itsu,M.,W.Ebisuzaki,J.Woollen,S.K.Yang,J.J.Hnilo, M.Fiorino,and G.L.Potter,2002:NCEP-DEO AM IP-IIreanalysis(R-2).Bull.Amer.Meteor.Soc.,83,1631–1643.
Kidston,J.,and E.P.Gerber,2010:Intermodel variability of the poleward shiftof theaustral jetstream in the CM IP3 integrations linked to biases in the 20th century climatology.Geophys.Res.Lett.,37,L09708,doi:10.1029/2010GL042873.
Liu,G.,P.Zhao,and J.M.Chen,2011:A 150-year reconstructed summer Asian-Pacific Oscillation index and its association w ith precipitation over eastern China.Theor.Appl.Climatol., 103,239–248.
Liu,G.,P.Zhao,J.M.Chen,and S.Yang,2015:Preceding factors of summer Asian-Pacific Oscillation and the physicalmechanism for theirpotentialinfluences.J.Climate,28,2531–2543.
Man,W.M.,and T.J.Zhou,2011:Forced responseofatmospheric oscillationsduring the lastmillennium simulated by aclimate system model.Chinese Science Bulletin,56,3042–3052.
Nan,S.L.,P.Zhao,S.Yang,and J.M.Chen,2009:Springtime tropospheric temperature over the Tibetan Plateau and evolutions of the tropical Pacific SST.J.Geophys.Res.,114, D 10104,doi:10.1029/2008JD011559.
Winton,M.,2000:A reformulated three-layer sea icemodel.J. Atmos.Oceanic Technol.,17,525–531.
Wu,T.W.,2012:A mass-flux cumulus parameterization scheme for large-scalemodels:descriptionand testwithobservations. Climate Dyn.,38,725–744,doi:10.1007/s00382-011-0995-3.
Wu,T.W.,R.C.Yu,and F.Zhang,2008:A modified dynamic framework for the atmospheric spectralmodel and its application.J.Atmos.Sci.,65(7),2235–2253.
Wu,T.W.,and Coauthors,2010:The Beijing Climate Center atmospheric general circulationmodel:Description and itsperformance for the present-day climate.Climate Dyn.,34,123–147,doi:10.1007/s00382-008-0487-2.
Xin,X.G.,T.W.Wu,J.L.Li,Z.Z.Wang,W.P.Li,and F.H.Wu, 2013:How welldoes BCC CSM 1.1 reproduce the20th century climate change over China?.Atmospheric and Oceanic Science Letters,6(1),21–26.
Xie,P.P.,and P.A.Arkin,1997:Globalprecipitation:A 17-year monthly analysis based on gauge observations,satellite estimates,and numericalmodeloutputs.Bull.Amer.Meteor.Soc., 78,2539–2558,doi:10.1175/1520-0477(1997)078<2539: GPAYMA>2.0.CO;2.
Zhao,P.,Y.N.Zhu,and R.H.Zhang,2007:An Asia-Pacific teleconnection in summer tropospheric temperature and associated Asian climate variability.Climate Dyn.,29,293–303, doi:10.1007/s00382-007-0236-y.
Zhao,P.,J.M.Chen,D.Xiao,S.L.Nan,Y.Zou,and B.T.Zhou, 2008:Summer Asian-Pacific Oscillation and its relationship w ith atmospheric circulation andmonsoon rainfall.Acta Meteorologica Sinica,22,455–471.
Zhao,P.,Z.H.Cao,and J.M.Chen,2010:A summer teleconnection pattern over the extratropical Northern Hemisphere and associatedmechanisms.Climate Dyn.,35,523–534.
Zhao,P.,S.Yang,H.J.Wang,and Q.Zhang,2011:Interdecadal relationshipsbetw een the Asian–Pacific Oscillation and summer climate anomalies over Asia,North Pacific,and North America during a recent 100 years.J.Climate,24,4793–4799.
Zhao,P.,B.Wang,and X.J.Zhou,2012:Boreal summer continentalmonsoon rainfall and hydroclimate anomalies associated w ith the Asian-Pacific Oscillation.Climate Dyn.,39, 1197–1207,doi:10.1007/s00382-012-1348-6.
Zhou,B.T.,and P.Zhao,2010:Influenceof the Asian–Pacific oscillation on spring precipitation over central eastern China. Adv.Atmos.Sci.,27,575–582,doi:10.1007/s00376-009-9058-7.
Zhou,B.T.,and L.Zhang,2012:A simulation of the uppertropospheric temperature pattern in BCC CSM 1.1.Atmospheric and Oceanic Science Letters,5,478–482.
Zhou,B.T.,X.Cui,and P.Zhao,2008:Relationship between the Asian-Pacific oscillation and the tropical cyclone frequency in the w estern North Pacific.Science in China D:Earth Sciences,51,380–385.
Zhou,B.T.,P.Zhao,and X.Cui,2010:Linkage between the Asian-Pacific Oscillation and the sea surface temperature in the North Pacific.Chinese Science Bulletin,55,1193–1198, doi:10.1007/s11434-009-0386-x.
Zhou,X.J.,P.Zhao,and G.Liu,2009:Asian-Pacific Oscillation index and variation of EastAsian summermonsoon over the pastmillennium.Chinese Science Bulletin,54,3768–3771, doi:10.1007/s11434-009-0619-z.
Zou,Y,and P.Zhao,2011:A study of the relationship between the Asian-Pacific oscillation and tropical cyclone activities over the coastalwatersof China during autumn.Acta Meteorologica Sinica,69(4),601–609.(in Chinesew ith Englishabstract)
:Zhang,Y.Z.,Z.J.Liao,Y.C.Zhang,and F.Nie,2016:Characteristics of the Asian–Pacific oscillation in boreal summer simulated by BCC CSM with di ff erent horizontal resolutions.Adv.Atmos.Sci.,33(12),1401–1412,
10.1007/s00376-016-5266-0.
(Received 4 February 2016;revised 30May 2016;accepted 23 June2016)
?Corresponding author:Yaocun ZHANG
Email:yczhang@nju.edu.cn
?Institute ofAtmospheric Physics/Chinese Academy of Sciences,and Science Press and Springer-Verlag Berlin Heidelberg 2016
 Advances in Atmospheric Sciences2016年12期
- Advances in Atmospheric Sciences的其它文章
- Role of the Oceanic Channel in the Relationshipsbetween the Basin/DipoleM ode of SST Anomalies in the Tropical Indian Ocean and ENSO Transition
- Characterizing the Urban Tem perature Trend Using SeasonalUnit Root Analysis:Hong Kong from 1970 to 2015
- M odulation of TropicalCyclogenesis in theWestern North Pacif c by the Quasi-Biweekly Oscillation
- AnomalousWestern Pacif c SubtropicalHigh during Late Summer in Weak La Ni?na Years:Contrastbetween 1981 and 2013
- The Upstream“Strong Signals”of theWater Vapor Transport over the Tibetan Plateau during a Heavy Rainfall Event in the Yangtze River Basin
- Simulation by CM IP5M odelsof the Atlantic M ultidecadal Oscillation and ItsClimate Im pacts