
M odulation of TropicalCyclogenesis in theWestern North Pacif c by the Quasi-Biweekly Oscillation
2016-11-25 03:08:22HaikunZHAOChunzaiWANGandRyujiYOSHIDA
Advances in Atmospheric Sciences 2016年12期
Haikun ZHAO,ChunzaiWANG,and RyujiYOSHIDA
1Key Laboratory ofMeteorologicalDisaster,Ministry ofEducation/Joint InternationalResearch Laboratory of Climate and EnvironmentChange/Collaborative Innovation Center on Forecastand Evaluation of MeteorologicalDisaster/Pacifc Typhoon Research Center/Earth System Modeling Center, Nanjing University ofInformation Science and Technology,Nanjing 210044,China
2NOAA/AtlanticOceanographic and Meteorological Laboratory,Miami,FL,33149,USA
3RIKEN Advanced Institute for Computational Science,Kobe,650-0047,Japan
M odulation of TropicalCyclogenesis in theWestern North Pacif c by the Quasi-Biweekly Oscillation
Haikun ZHAO?1,ChunzaiWANG2,and RyujiYOSHIDA3
1Key Laboratory ofMeteorologicalDisaster,Ministry ofEducation/Joint InternationalResearch Laboratory of Climate and EnvironmentChange/Collaborative Innovation Center on Forecastand Evaluation of MeteorologicalDisaster/Pacifc Typhoon Research Center/Earth System Modeling Center, Nanjing University ofInformation Science and Technology,Nanjing 210044,China
2NOAA/AtlanticOceanographic and Meteorological Laboratory,Miami,FL,33149,USA
3RIKEN Advanced Institute for Computational Science,Kobe,650-0047,Japan
The quasi-biw eekly oscillation(QBWO)is the second mostdom inant intraseasonalmode over thewestern North Pacific (WNP)during boreal summer.In this study,themodulation ofWNP tropical cyclogenesis(TCG)by the QBWO and its association with large-scale patterns are investigated.A strongmodulation ofWNP TCG events by the QBWO is found. More TCG events occur during the QBWO’s convectively active phase.Based on the genesis potential index(GPI),we further evaluate the role of environmental factors in a ff ectingWNP TCG.The positive GPIanomalies associated w ith the QBWO correspond wellw ith TCG counts and locations.A large positive GPIanomaly is spatially correlated w ith WNP TCG events during a life cycle of the QBWO.The low-level relative vorticity and m id-level relative hum idity appear to be two dominant contributors to the QBWO-composited GPIanomalies during the QBWO’s active phase,followed by the nonlinear and potential intensity terms.These positive contributions to the GPIanomalies are partly o ff setby the negative contribution from the verticalw ind shear.During the QBWO’s inactive phase,themid-level relative hum idity appears to be the largest contributor,while weak contributions are alsomade by the nonlinear and low-level relative vorticity terms. M eanwhile,these positive contributions are partly cancelled out by the negative contribution from the potential intensity. The contributions of these environmental factors to the GPI anomalies associated w ith the QBWO are sim ilar in all five flow patterns—themonsoon shear line,monsoon confluence region,monsoon gyre,easterly wave,and Rossby waveenergy dispersion associated w ith a preexisting TC.Further analyses show that the QBWO stronglymodulates the synoptic-scale wave trains(SSWs)over theWNP,w ith larger amplitude SSWs during the QBWO’s active phase.This implies a possible enhanced(weakened)relationship between TCG and SSWs during the active(inactive)phase.This study improves our understanding of the modulation of WNP TCG by the QBWO and thus helps w ith e ff orts to improve the intraseasonal prediction ofWNPTCG.
tropical cyclogenesis,quasi-biweekly oscillation,genesis potential index,large-scale patterns,western North Pacific
1.Introduction
The western North Pacific(WNP)is themost active region for tropicalcyclogenesis(TCG)worldw ide.On average, there are about26 tropical cyclones(TCs)generated over the WNP each year(Chan,2005).These TCs often cause casualtiesand damage to property over East Asia and adjacent regions(Zhang etal.,2009).Over theWNP,the variability of TC activity can be found on various timescales,including interdecadal or decadal(Ho et al.,2004;Chan,2008;Liu and Chan,2008;Zhao etal.,2014;Zhao et al.,2014;Zhao and Wang,2015),interannual(Lander,1994;Chia and Ropelewski,2002;Wang and Chan,2002;Camargo and Sobel, 2005;Zhao etal.,2010,2011),and intraseasonal timescales (Liebmann et al.,1994;Wang and Zhou,2008;Camargo et al.,2009;Wang etal.,2009;Huang etal.,2011;Liand Zhou, 2013a,2013b;Zhao et al.,2015a,2015b).Considering the potential societal impacts and scientific significance of TC activities,a betterunderstanding of TC activities in theWNP and their variabilitiesare importantand necessary.
On the intraseasonal time scale,the MJO(Madden andJulian,1971)is considered to be the dominantmode,w ith a period of about30–60 days.TheMJO canmodulate changes in environmental conditions and thus lead to a clustering of TC formation during the TC season(Gray,1979).The general consensus is that the M JO has a strong impact on TCG eventsglobally,w ithmore TCs formed during its convectively active phase in comparison w ith that during convectively suppressed phases(Gray,1979;Camargo et al., 2009;K lotzbach,2014;K lotzbach and Oliver,2015).Over theWNP,a prom inentnorth-northeastwardmovementof the M JO during boreal summer has been w idely documented (Yasunari,1979;Hsu etal.,2004;Jiang etal.,2004;Yoshida etal.,2014;Zhao etal.,2015a,2015b).Alongw ith thepropagation of theM JO,the location ofWNPTCG shifts correspondinglyand thenumberof TCsincreases(reduces)during active(inactive)phasesof the MJO(Liebmann etal.,1994; Kim etal.,2008;Huangetal.,2011;Liand Zhou,2013a;Wu and Duan,2015;Zhao etal.,2015a,2015b).
M ost studies have focused on the impact of the M JO on WNP TC activity.Meanwhile,them odulation of TC activity by the quasi-biweek ly oscillation(QBWO)has been relatively lesswell studied.The QBWO over theWNP during borealsummer tends tomovenorthwestward,w ith a prevailingperiod of10–30days,as identified inmany previousstudies(e.g.,Liand Zhou,1995;Wang etal.,2009;Chenand Sui, 2010;Liand Zhou,2013a;Zhao et al.,2015a).Some studieshavesuggested that theQBWO can strongly a ff ect Indian and Asian monsoon rainfall(Chen and Chen,1993;Chang and Chen,1995;Wang and Xu,1997;Chen etal.,2000)and local TC activity(Hartmann et al.,1992;Wang et al.,2009; Liand Zhou,2013a,2013b;Zhao etal.,2015a).M oreover,Li and Zhou(1995)found that the kinetic energy of the QBWO over the WNP ismuch stronger than that of the MJO.We also computed the standard deviations of rainfall based on TRMM Product 3B42 data(Hu ff man et al.,2007),for the peak TC season(May–October),1998–2012,in both the10–30-day and 30–60-day bands(figurenotshown).The results showed the variance of rainfall anomalies in the 10–30-day band to be stronger than that in the 30–60-day band,which is consistentw ith previousstudies(Liand Zhou,1995;Zhao et al.,2015a).Meanwhile,the high frequency of WNP TC occurrencematcheswellw ith vigorousQBWO activity,implying a possible link between the QBWO and WNP TCG. In a recent study,Liand Zhou(2013a)examined the relationship between the QBWO and TCG over theWNP basin by qualitatively investigating changes in environmental factorsmodulated by theQBWO.However,the impactsof these large-scaleenvironmentalparametersonWNPTCG havenot been quantitatively assessed.Additionally,although TCG is closely associated w ith large-scale conditions(Gray,1968; M cBride and Zehr,1981),how di ff erent large-scale conditionsmodulate TCG over theWNP basin remainsunclear.
Ritchieand Holland(1999)subjectively identified the five basic large-scale patterns[i.e.,themonsoon shear line(SL), monsoon confluence region(CF),monsoon gyre(GY),easterly wave(EW),and Rossby wave energy dispersion associated w ith a preexisting TC(PTC)]favorable forWNPTCG. In order to overcome the subjectivity of these five patterns, Yoshida and Ishikawa(2013)developed an objective algorithm for identifying the five flow patterns.Many studies have illustrated that the two leading intraseasonal oscillation modes over the WNP,i.e.,the MJO and QBWO,can distinctlymodulateWNPTCG events(Kim etal.,2008;Wang etal.,2009;Huang etal.,2011;Wu etal.,2011;Liand Zhou, 2013a;Zhao et al.,2015a,2015b).However,studies on the modulation of these two dom inant intraseasonal oscillation modes,and their association w ith di ff erent flow patterns,remain very limited.Recently,Zhao etal.(2015b)investigated the impact of the M JO on WNP TCG and its association w ith the five large-scale patternsmentioned above,but the QBWO’smodulation ofWNP TCG and its link to the flow patternswere notquantitatively assessed in their study.
As an extension to Zhao et al.(2015b),themodulation of TCG by the QBWO,and its association w ith the aforementioned five large-scale patterns,are investigated in this study.One of themain objectives of thiswork is to explore the relative im portance of environmental factors associated w ith the five flow patterns in their impacts on TCG.In addition to thewell-recognized impactsof these environmental factorson TCG thathave been discussed in previousstudies (Gray,1968;McBrideand Zehr,1981;Klotzbach and Gray, 2008;Dare and M cBride,2011),synoptic-scalewave trains (SSWs)aligned in a southeast to northwest direction,w ith a typicalwavelength of about 2500–3000 km and a period of 3–8 days,are also regarded as amajor precursor to TCG (Reed and Recker,1971;Reed etal.,1977;Yasunari,1979; Nakazawa,1986,1988;Lau and Lau,1990;Takayabu and Nitta,1993;Dickinson and Molinari,2002;Liand Fu,2006; Zhao et al.,2016).To further investigate the possible link between SSWs and the TCG associated w ith the five largescale patterns,themodulation by the QBWO of the SSWs associated w ith the large-scale patterns is also discussed in thisstudy.
Thepaper isorganizedas follows:Section 2describes the datasetsused in the study and the identification of theWNP QBWOmode.A diagnostic tool for investigating the relative roleof large-scale factorsinmodulatingWNPTCG isalso introduced in this section.The key factors associated w ith the QBWO thata ff ect TCG,and themodulation of the SSW sby theQBWO,over theWNP,areexplored in section 3.Section 4 summarizes the study’skey findings.
2.Datasetsandmethodology
2.1.Data
The TC data are from the JTWC best-track dataset.The peak TC season(i.e.,May–October)during 1998–2012 is selected for analysis.In this study,we focuson the early stage of TCG events.Thereby,only those TCsw ithmaxim um sustainedw ind speedgreater thanorequal to13m s-1(25knots) are considered.
To extract the leading QBWO mode and SSWs over the WNP,we obtain rainfall observations for the period 1998–2012 from TRMM Product 3B42(Hu ff man et al.,2007),which extends from 50°S to 50°N w ith a 0.25°horizontal resolution and a3-hourly temporal resolution.
To objectively identify basic large-scale patterns favorable for TCG and to explore key environmental factors associated w ith the QBWO thata ff ect TCG over theWNP,6-hourly variables includingw inds,relativehumidity,temperatureand SSTarederived from JRA-25/the JMAClimateData Assim ilation System(Onogietal.,2007).
2.2.M ethodology
2.2.1.Identifcation ofthe fve large-scalepatterns
Follow ing Yoshida and Ishikawa(2013),the large-scale patternsassociated w ith all the331 TCG cases during May–October from 1998 to 2012 are classified.The large-scale pattern w ith the largestnormalized contribution score is referred to as thedeterm ined flow pattern foreach TCG.Details on the computation of the normalized contribution score of the five patterns for each individual TCG event can be found in Yoshida and Ishikawa(2013)and Zhao etal.(2015b).
Typicalexamp lesof TCG corresponding to the fivemajor flow patternsare obtained using the objective algorithm developed by Yoshida and Ishikawa(2013).As shown in Fig. 1a,the contribution score ishighest from the SL pattern;the second largestcontribution score is from theGY pattern,followedby the relativelyweak contributionscore from thePTC pattern.Therefore,the SL pattern is identified to be themajor contribution pattern.The scores for the three patternsare shown in Fig.1b.It can clearly be seen that the contribution score of the CF pattern is the largest,followed by thatof the SL and GY patterns.Sim ilarly,themajor EW pattern can be obtained based upon the calculated contribution score shown in Fig.2a.In Fig.2b,only the contribution score of the GY pattern can be detected by the algorithm,while no score is computed for theother flow patterns.Themajor PTC pattern is presented in Fig.3a,in which a preexisting TC and relativelyweak cyclonic vorticity are observed,although the relatively weak contribution from the SL pattern can be found. Specifically,an unclassified flow pattern is displayed in Fig. 3b,w ith no scores for the five flow patternsof interest.
The SL appears to be themost frequent flow pattern contributing toWNPTCG.Itisassociated w ith about42%of the 331 TCG events,followed by the CF(18%)and EW(16%) patterns.The PTC(7%)and GY(4%)patterns can be detected,butthey onlymakesmall contributions toWNPTCG. Thesame resultswere foundby Zhaoetal.(2015b),and these resultsagreewellw ith the resultsofpreviousstudies(Ritchie and Holland,1999;Yoshida and Ishikawa,2013).Note that there are some slight di ff erences in the percentagesof TCG frequency associated w ith each large-scale pattern between the results of this study and that of previous studies.There are three possible reasons for these small di ff erences.The first is the di ff erent detecting algorithm s used.The second reason isdi ff erentstudy periodscovered.And the lastreason is that the impact of climate change di ff ers among di ff erent decades.
Furtheranalyses illustrate no significantdi ff erence in TC locationsover the peak season under the five large-scalepatterns,exceptamoreeastward shift in theaverage location of TCG associated w ith the PTC pattern,at the 5%confidence level.
2.2.2.Identifcation ofthe QBWO
Sim ilar to previous studies(Wang et al.,2009;Li and Zhou,2013a;Zhao et al.,2015a,2015b),an extended EOF (EEOF)analysis isused forextracting the QBWOmode over theWNP basin.Before perform ing the EEOF analysis,the TRMM daily rainfallanomalies for theperiod1998–2012are filtered in the10–30-dayband.Thedomain(0°–30°N,100°–160°E)is selected for the EEOF analyses.Sim ilar to Zhao et al.(2015b),the QBWO over the WNP can be identified by the EEOF1 and EEOF2.A prevailing period of about20 days for the two EEOFmodes can be found in the time seriesof theprincipalcomponents(PCs)of EEOF1and EEOF2 (figure notshown),in accordancew ith the peak period of the QBWO in previous studies(Wang etal.,2009;Liand Zhou, 2013a;Zhao etal.,2015a).The lagged regression patternsof band-pass filtered TRMM rainfall for the EEOF1 and EEOF2 modes further show a pronounced northwestward propagation for the QBWO(figure not shown),which is consistent w ith results in previous studies(Yasunari,1979;Hsu et al., 2004;Wang etal.,2009;Leeetal.,2013;Liand Zhou,2013a; Zhao etal.,2015a).In summary,the first two leading EEOF modesof the observed daily rainfallanomalies can successfully capture the dom inantQBWOm ode over theWNP.
Sim ilar to previous studies(Kim et al.,2008;Li and Zhou,2013a,Zhao et al.,2015a,2015b),the daily QBWO amplitudeand phase(ranging from 1 to 8)can bedeterm ined by the two leading EEOFPCs(i.e.,PC1 and PC2)follow ing the samemethod adopted inWheelerand Hendon(2004).In thisstudy,QBWO eventsaredetermined fordaysw ith amplitudegreater than orequal to 1.0(i.e.,p PC12+PC22≥1.0).
2.2.3.Diagnostics for exploring the role ofenvironmental factors
The genesis potential index(GPI)(Emanuel and Nolan, 2004)isused for exploring the contribution of each individualenvironm ental factor to TCG underall the five large-scale patterns in this study.The GPIisexpressed as

whereξ,H,Vpot,and Vshearare the 850 hPa absolute vorticity(s-1),600 hPa relative humidity(%),potential intensity (PI)(m s-1),and verticalw ind shear,respectively.Theverticalw ind shear is computed as the vector di ff erence between the w inds at 200 hPa and 850 hPa(m s-1).The termsη= |105ξ|32,γ=(H/50)3,φ=(Vpot/70)3,and s=(1+0.1Vshear)-2 represent the four GPI components,which are associated w ith 850 hPa absolute vorticity,600 hPa relative hum idity, PI,and verticalw ind shear,respectively.The algorithm of Bister and Emanuel(2002)isused for computing PI.In this algorithm,SST and vertical profilesof temperature and specific humidity in the troposphereare considered.
As theQBWO propagatesnorthwestward,theanomalousGPIpatternsmatchwellw ith TCG countsand shifts in genesisarea,whichw illbeshown later in section 3.1.To further understand themodulation ofWNPTCG by theQBWO,we assess the respective roles of the four large-scale factors involved in theGPI[i.e.,η,γ,φand s in Eq.(1)]in contributing to the GPIanomalies,follow ing themethodology detailed in Jiang etal.(2012).

Fig.1.Examplesof(a)SL and(b)CF patterns.The red stars represent the locations of TCG. The purple stars indicatea preexisting TC about1500 km to thewestof the TCG location denoted by red starsatthegenesis time.Theyellow dotted lineshows the detected leading edgeof the westerly w ind by the objective algorithm,and represents a partof the CF region.The blue dotted line indicates the shear line,which isdetected near thegenesis location by theobjective algorithm.Vectors are the horizontalwind field at850 hPa and the color-shaded area is the zonalw ind at850 hPa.Green contours representSLP.
3.TCG associated w ith the QBWO
3.1. Statisticalcharacteristics
The composite rainfall anomaliesalong w ith TCG locations during a life cycle of the QBWO are displayed in Fig. 4.The northwestward propagating QBWO can significantly modulate WNP TCG.For examp le,the TCG zone exhibitsa clearm igration coupled w ith the northwestwardmovement of theenhanced convection from phases1 to 4 of the QBWO. In addition to the shift in TCG locations,a strong impactof theQBWO on TCG countscan be readily seen.Asshown in Fig.5a,moreTCsoccurduringQBWO phases1–4 and fewer cases occur during phases 5–8,corresponding to enhanced convection over themain development region ofWNPTCG in phases 1–4 and suppressed convection in phases 5–8 of theQBWO.Such a distinctmodulation ofWNPTCG by the QBWOmode is further indicated by the TCG rate(Fig.5b), w hich is computed by the ratio of TCG counts to the number of total days.Sim ilarly,it is readily found that themain developm ent regionsof TCG eventsassociated w ith each largescale pattern have no significant di ff erence,except that the TCG location associated w ith the PTC pattern shiftsmore eastward in all theQBWO phases.Additionally,theCF flow pattern associated w ith theeasternmost TCG location during phase 6(Fig.4)can be detected.Furthermore,the ratios of occurrence of each individual large-scale pattern during the QBWO phases are also examined.The results are almost identical to those w ithout separating them into large-scale patterns.In all the flow patterns,except the PTC pattern,more TCG cases occur during the active phases(1–4)than during the inactivephases(5–8).Itisnoteworthy thatslightly more TCG casesoccur during the inactive phasesunder the PTC pattern(Fig.6).
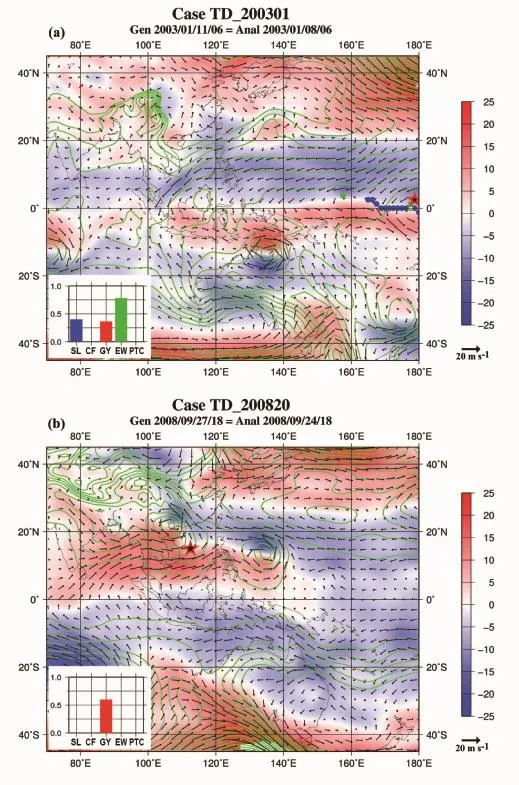
Fig.2.As in Fig.1 but for the(a)EW and(b)GY patterns.The green dotted line represents partof the EW trough,asdetected by theobjectivealgorithm.
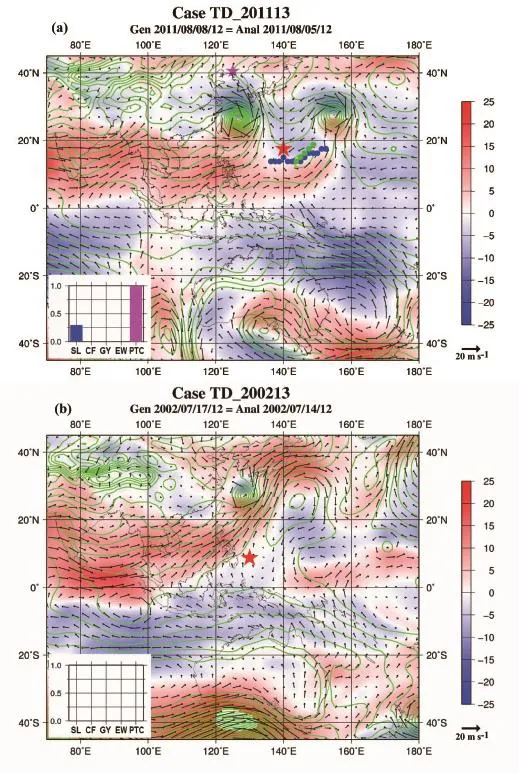
Fig.3.As in Fig.1 but for the(a)PTC and(b)unclassified flow patterns.
To haveenough TCG samplesand obtainmore robustresults,we combine phases 1–4 into one category(hereafter, the active QBWO phase)and phases 5–8 into another(hereafter,the inactive QBWO phase).Consequently,the difference in the TCG cases between the active and inactive QBWO phases becomesmuch clearer.43.5%of the total number(i.e.,144)of TCG events is found in the activephase and 29.9%of the totalnumber(i.e.,99)of TCG events isobserved during the inactive phase.In summary,these results suggest a significant impact of the QBWO on TCG events over theWNP.Comparedw ith themodulationof TCG events by the MJO,discussed in Zhao etal.(2015a),the impactof the QBWO mode on WNP TCG is weaker.This ismainly because the QBWO hasastrong impacton local TC activity, while theM JO hasastrong impacton basin-w ide TC activity, as suggested in previous studies(Liand Zhou,2013a;Zhao etal.,2015a).
Figure 6 further shows the TCG counts associated w ith the five large-scale patterns during the active and inactive QBWO phases.Amoreconsistentmodulation ofWNPTCGby the QBWO than that by the M JO is found for all five of the flow patterns(Zhao et al.,2015b).Generally,more events occur during the active QBWO phase under all five flow patterns,except the PTC pattern.Under the PTC pattern,there are slightly more TCG events during the inactive QBWO phase than that during the active QBWO phase, which may be associated w ith the northwestward propagation of the QBWO.These results are in agreementw ith the determ ination of the fivemajor flow patterns.Enhancedwesterly w ind,and thus intensifiedmonsoonalcirculation,can be found during the active phase,resulting in more WNP TCG events associated w ith the threemonsoon-related flow patterns(i.e.,SL,CF and GY).In contrast,enhanced easterly w ind anomalies,and thusaweakenedmonsoon trough,over theWNP,can be detected during the inactive QBWO phase, leading to fewer TCG cases under the aforementioned three monsoon-related large-scalepatterns.Additionally,there are slightly more TCG cases associated w ith the EW flow pattern during theactiveQBWO phase.Thismay bebecause the easterlyw ind intensifies(weakens)over thenortheastern side of the enhanced(weakened)monsoon trough over theWNP basinduring theactive(inactive)QBWO phase,and thusprovidesmore(less)chance for TCG.Meanwhile,TCG locationsassociated w ith the EW flow pattern shiftmore northeastward than that associated w ith the other threemonsoonrelated large-scale patterns.
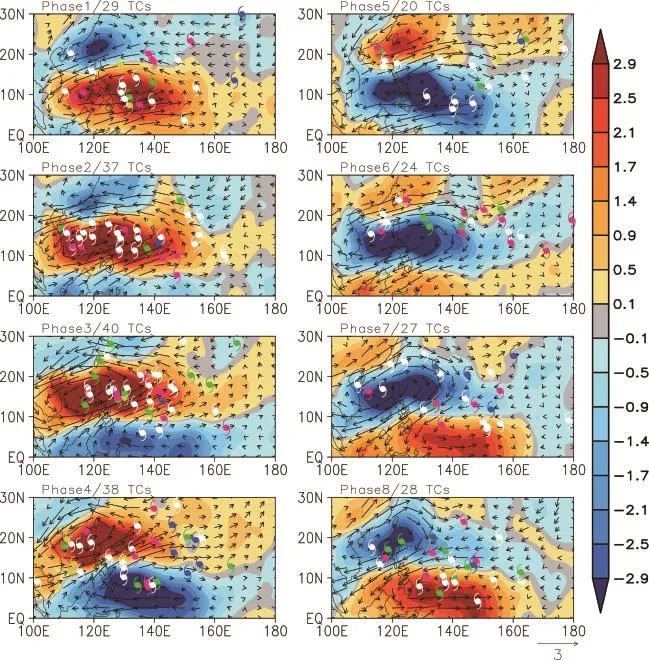
Fig.4.Com posite rainfallanomalies(color-shaded;units:mm d-1)during di ff erent QBWO phases superimposed on TCG events.TCG cases associated with the SL(in white),CF(in purple),EW(in green),PTC(in blue)and GY(in yellow)large-scale patternsaregiven for theQBWO phases.
3.2.Role ofenvironmentalfactors
Figure 7 shows the composite GPIanomaliesand WNP TCG locations during the convectively active and inactive QBWO periods.Corresponding to the composite rainfall anomalies(figure not shown),the positive(negative)GPIanomalies are generally consistentw ith the active(inactive) phase of convection.In contrast to that during the inactive QBWO phase,enhanced TCG events can be detected in regionsw ith positive GPIanomalies during the active phase. Furthermore,most TCG events tend to form over themonsoon region aligned in thenorthwest–southeastdirectionduring the active QBWO phase,whilemore TCG cases occur outside themonsoon trough during the inactive phase.All of these results suggest that the QBWO plays an important role inm odulating TCG by changing environmental factors. It isworth noting thata certain numberof TCG eventscan be detected in areasof negative GPIanomalies,as shown in Fig. 7.Two possible reasonsmay explain this phenomenon.One is thatwhile theGPIreducesw ith respectto thebase state,it is still high enough to support TC genesis.The other is that other factorsnotincluded in Eq.(1)ornotassociatedw ith the QBWO,such as theM JO and convectively coupled equatorialwaves,may a ff ect TCG.Further study isneeded to better explore the associated physicalmechanism.
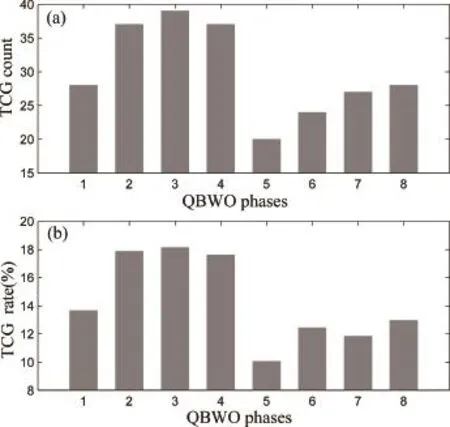
Fig.5.The TCG (a)count and(b)rate(100× TCG count/QBWO days)during the di ff erentQBWO phases.
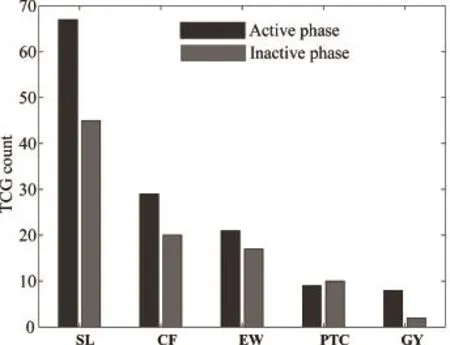
Fig.6.TCG count associated w ith each of the five large-scale patterns(SL,CF,EW,PTC,GY)during theactiveand inactive QBWO phases.
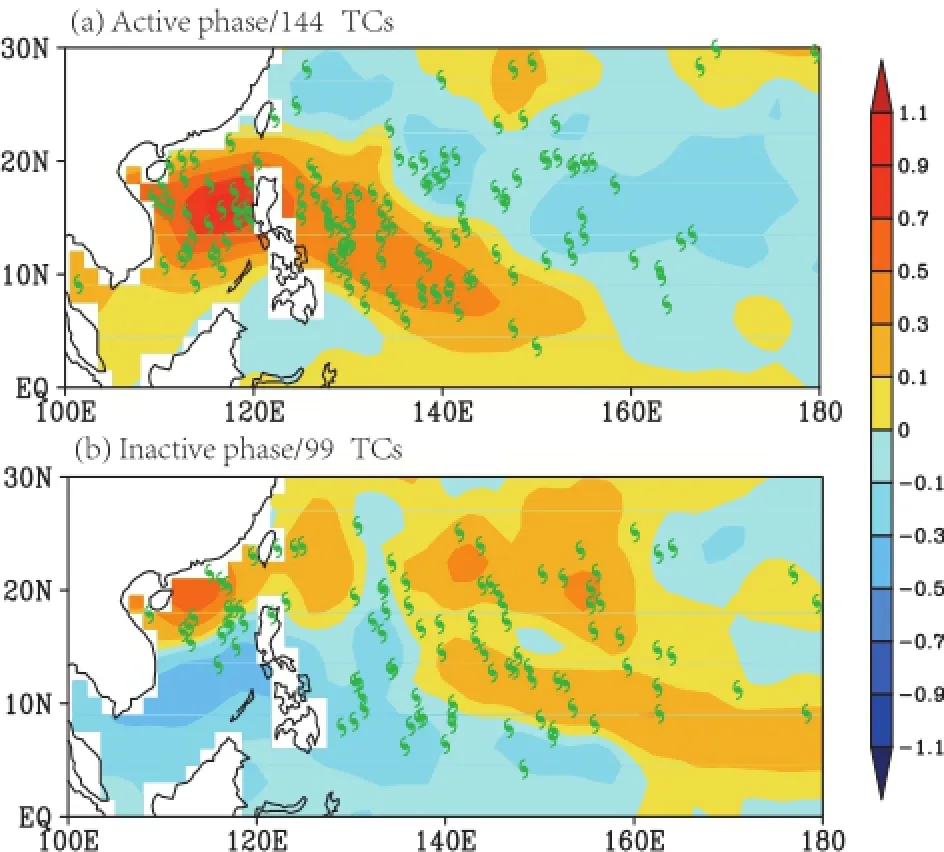
Fig.7.CompositeGPIanomalies(color-shaded)during the(a) active and(b)inactive QBWO phase along with TCG events. The green icons represent typhoon.
The relativeimportanceof the four factorsinvolved in the GPIindex is further investigated in this section.The spatial distributionsof the four linear termsassociated w ith the total GPIanomalies during the active and inactive phases,along w ith TCG events,over theWNP,areshown in Fig.8.During the active phase,positive GPIanomalies w ith varying 850 hPa relative vorticity(referred to asGPI-VOR)and 600 hPa relativehum idity(referred to asGPI-RH)appear to bemore consistentw ith WNP TCG events,and the PI variation also contributes to TCG events.However,most of TCG events over the WNP are associated w ith negative GPI anomalies w ith varying verticalw ind shear(referred to asGPI-Shear). In contrast to that during the activephase,the largest contribution to the totalGPIanomaliesduring the inactivephase is from them id-level relative humidity.Distinct from that during theactivephase,the PIvariation in theeastern partof the WNP(referred to asGPI-PI)makesapositive contribution to the GPIanomalies.Generally,the contributionsof environmental factors to the GPIanomalies depend on the QBWO phase.During the activephase,the two leading contributions to positive GPI anomalies are from the enhanced 850 hPa relative vorticity and increased 600 hPa relative hum idity, whose contributions are slightly o ff setby the negative contributions from the verticalw ind shear.A relatively similar and smallcontribution from thenonlinear term(referred to as GPI-nonlinear)can be found during both active and inactive phases(Fig.9).This is di ff erent from the case associated w ith theMJOmode,as indicated in Zhao etal.(2015b).The nonlinear term appears not to be a significant contributor,which is further enhanced by displaying the small composite GPIanomalies averaged w ithin the 10°×10°box centered in TCG locations forall TCG cases,w ithoutseparating them into large-scalepatterns,during the active and inactive QBWO phases(Fig.10).
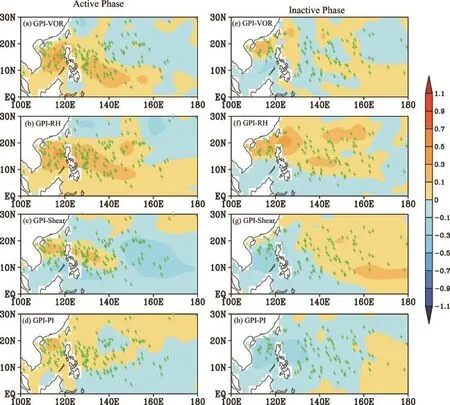
Fig.8.Spatial distributions of the contributions of(a,e)vorticity(b,f)relative hum idity,(c,g)and(d,h)potential intensity to the totalGPIanomaliesover theWNPduring the(a–d)activeand(e–h)inactiveQBWO phases.Thegreen icons represent typhoon.
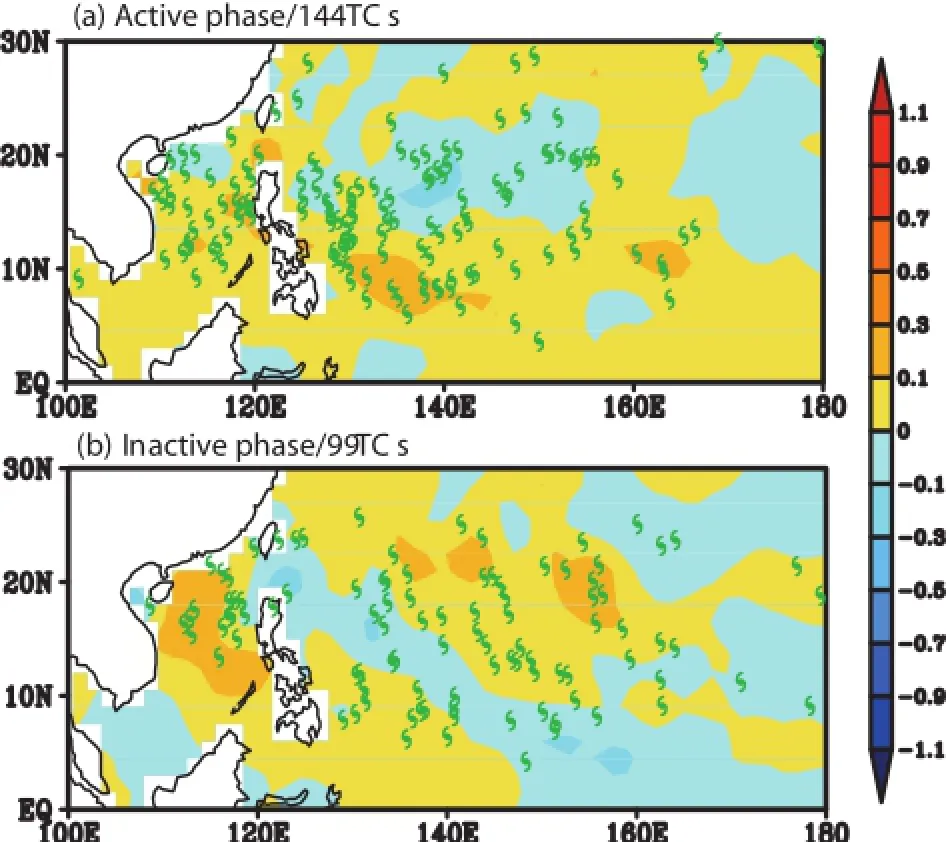
Fig.9.Spatial distributions of the contributions of nonlinear terms to the total GPIanomalies over theWNP during the(a) active and(b)inactive phases.The green icons represent typhoon.
3.3.Impactof large-scalepatterns
In this section,sim ilar analyses as above are conducted to assess the relative importance of environmental factors in modulating WNP TCG cases under all five flow patterns. Figure 10 shows the mean composite GPIanomalies w ith the 10°×10°domain centered on the TCG locations for all TCG cases associated w ith each large-scale pattern on days w ithandw ithoutTCGsduring theactiveand inactiveQBWO phases,respectively.The results show thata positive contribution to the GPIunder all of the five large-scale flow patternsduring the active phase comesm ainly from two factors, i.e.,850 hPa relative vorticity and 600 hPa relative hum idity.A weak positive contribution from the nonlinear and PI termscanalso be found.Meanwhile,itis readily seen thatthe negative contribution from theverticalw ind shear can partlyreduce the positive contributions discussed above.These results are sim ilar to the results from analyzing the total 331 WNP TCG cases w ithout considering them under the five large-scalepatterns,asshown in section 3.1.Specifically,the GPIanomaliesassociatedw ith theGY flow pattern appear to be larger than those associated w ith other flow patterns,and a weak positive contribution can be found from the vertical w ind shear.During the inactivephase,themid-level relative humiditymakes themost importantcontribution to the positiveanomalies.Positive contributionscan also be found from the nonlinear term and verticalw ind shear,and aweak positive contribution from the 850 hPa relative vorticity.The positive contribution is largely o ff setby thenegativecontribution from the PIterm.These resultsare also sim ilar to the results obtained w ithout distinguishing the large-scale patterns,except the role of verticalw ind shear.During the active phase, the positive contribution to the GPIanomalies can be found from the verticalw ind shear for the GY large-scale pattern, which isdistinct from the resultobtainedw ithoutdistinguishing the large-scalepatterns.
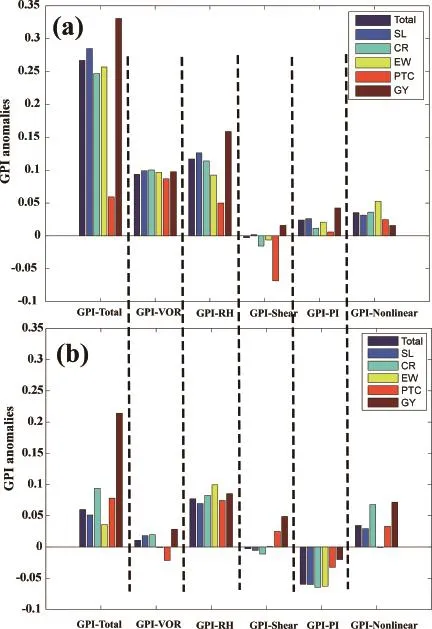
Fig.10.Contribution of the di ff erent terms[(i.e.,Vorticity,Verticalw ind shear, RH,PI,and nonlinear terms]to the totalGPIanomalies over theWNP during the(a)active and(b)inactive QBWO phases,for the five large-scale patterns, individually(SL,CF,EW,PTC,GY)and combined(Total).
Considering the possible contamination of the influence of TCs themselves on the magnitude of the GPI anomalies,themagnitude of the averaged composite GPIanomalies w ith the 10°×10°domain centered on the TCG location for all TCG cases associated w ith each large-scale pattern on the1348 non-TC days is computed for theactiveand inactive QBWO phases,respectively.The rolesof these factors in contributing to GPIanom alies is basically sim ilar to thosew ithoutexcluding TC days during the active and inactive phases,although a slightdi ff erence inmagnitude can be found.Therefore,the results discussed above on the importanceof environmental factors in contributing to the compos-ite GPIanomaliesare robust.
3.4.M odulation ofSSWsby the QBWO
The SSW train is one of the most frequent occurring weather patternsduring borealsummerover theWNP.Many studies have suggested that SSWs actually serve as amajor source forWNPTCG events(Sobeland Bretherton,1999;Li et al.,2006;Fu et al.,2007).In this section,themodulation of SSW sby the QBWO is investigated,which sheds lighton the impactof the QBWO onWNPTCG cases.
To extract the SSWs over the WNP from the data,an EEOF analysis of 3–8-day bandpass filtered TRMM rainfall is performed.Similar to the QBWO mode,the SSWs can be captured by the first two leading EOF modes,as shown in Fig.11.The amplitudeof the SSW activity can be computed as themagnitude of the two leading EEOF PCs, i.e.,SSWamplitude=p PC12+PC22.Looking at the lead–lag SSW patterns,it is found that the SSWs are characterized by a northwestward propagation,w ith a typicalwavelength of about 2500 km.To further explore the impactof the QBWO on the SSWs,the amplitudeof the SSWs during the active and inactive QBWO phases is computed.The results are shown in Fig.12.During the active QBWO phase, the SSW amplitude is about1.50,which is stronger than the SSW amp litude 1.15 during the inactive phase.A sim ilar and consistentresultunderall five large-scalepatternscan be obtained,i.e.,theamplitude is larger in theactive than theinactive QBWO phase(figure not shown),which corresponds tomore(fewer)TCGsover theWNPduring theactive(inactive)QBWO phase.SSW trainsmay be an important factor determ ining the productivity of TCG events over the WNP. Further study isnecessary to reveal the detail of thepossible link between them,aswellas thepossible underlying physicalmechanism.
4.Summary and conclusions
This paper is an extension of the work of Zhao et al. (2015b);it focuseson investigating themodulation ofWNP TCG events by the QBWO,and the association w ith five large-scale patterns,during the peak TC season for the period 1998–2012.The five flow patterns favorable forWNP TCG eventshavebeen illustrated in previousstudies(Ritchie and Holland,1999;Yoshidaand Ishikawa,2013).Follow ing Yoshida and Ishikawa(2013),the five flow patterns,i.e.,SL, CF,EW,PTC and GY,are also identified in this study.The resultsof the present study in this regard are consistentw ith those of previousstudies(Ritchieand Holland,1999),which suggest that themajority of TCG cases are associated w ith the SL flow pattern,amoderate number of TCG cases are associated w ith the CF and EW patterns,and very few TCG eventsare linked to the PTC and GY patterns.Based on the identification of each large-scalepattern,threeof thepatterns (i.e.SL,CFand GY)are linked uniquely tomonsoonalcirculation.Meanwhile,the EW flow pattern is closely associated w ith enhanced easterly w ind from the Central Pacific,and TC cases under the PTC pattern are closely associated w ith the Rossby waveenergy dispersion of previousTCG events.
Themodulation ofWNPTCG eventsby the QBWO under di ff erent large-scalepatterns is investigated by assessing the relative importance of environmental factors.A strong impact of the QBWO on localWNP TCG events is found, w ithmore TCG events forming over theWNPduring the active phase compared to the inactive phase.Apart from the PTC pattern,sim ilar resultsare found forallof the basic patterns.Di ff erent from Zhao etal.(2015b),slightlymore TCG cases are detected during the inactive phase than during the activephase.
The respective contribution of each factor involved in the GPI is further assessed follow ing previous studies(Jiang et al.,2012;Zhao etal.,2015a,2015b).During a life cycle of the QBWO,largepositiveGPIanomaliesarespatially correlated w ith WNP TCG events.Further analyses suggest that the rolesof theseenvironmentalfactorsdepend largelyon the di ff erent QBWO phases.During the active QBWO phase, them id-level relative hum idity and low-level relative vorticity are the twom ostimportant factors contributing to positive GPIanomalies.Weak contributionsaremade by the nonlinearand PIterms.These positive contributionsarepartly o ffsetby the negative contribution from the verticalw ind shear term.Contrary to that during the active QBWO phase,the mid-level relativehum idity appears to be the only large contributor to positive GPIanomaliesduring the inactive phase. The positive contribution from the nonlinear term during the inactive phase is slightly higher than the contribution from the low-level relative vorticity,which is distinctly di ff erent from the situation during the active phase when the contributionmade by the low-level relative vorticity is the second most important.The verticalw ind shear term makesa positivecontribution to GPIanomaliesduring theinactiveQBWO phase,also di ff erent from thatduring theactivephase.These positivecontributionsarealsopartly cancelledoutby thenegative contributionmadeby the PIterm.Almost identical results can be obtained for all of the five large-scale patterns, exceptGY.For the GY pattern,the total GPIanomaliesand the contribution of each linear factor to the GPIanomalies appear to be larger than that for the other four flow patterns. Additionally,the role of verticalw ind shear in the com posite GPIanomalies for the GY flow pattern is distinct from thatobtained w ithoutdistinguishing the large-scale patterns. These resultsmay partly stem from very few TCGsbeing associatedw ith themonsoon-relatedGY pattern over theWNP, butthisneeds further investigation.
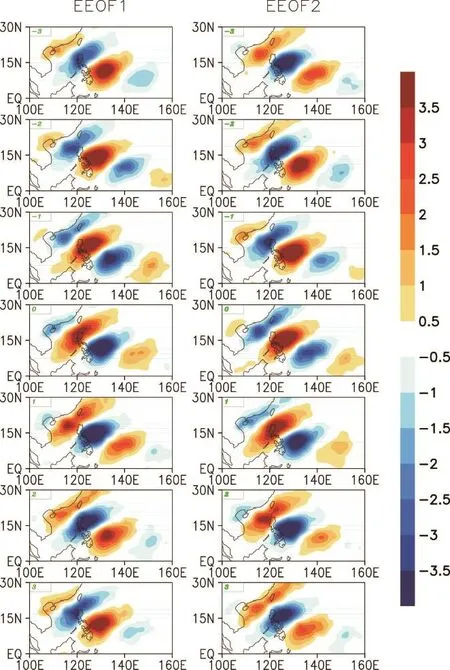
Fig.11.Evolution of SSW patterns from lag(-3)to lag(+3)days(units:mm d-1).
Compared w ith the results of Zhao et al.(2015b),it is found that the contributions of the four linear terms to the positive GPIanomaliesassociated w ith the QBWO are significantly di ff erent to those associated w ith the M JO.First, the contribution of the PI term to GPIanomalies associated w ith the QBWO(M JO)mode is positive(negative)during the active(inactive)phase of the QBWO(MJO).The contribution from the PI term appears to be outof phase between the MJO and QBWO phases.Second,the contribution of relativevorticity to GPIanomalies is secondmost importantduring the MJO inactive phase,whereas its contribution is weak during the QBWO inactive phase.Additionally,the non-linear term(contributing positively towards the positive GPIanomalies)has a relatively similar contribution during theactiveand inactivephasesof theQBWO,di ff erent from its impactduring theM JO.During the convectively activeM JO period,thepositive contributionof thenonlinear term tendsto be larger than thatduring the convectively suppressed period. Thismay be linked to di ff erent physicalmechanism s being responsible for themodulation ofWNP TCG eventsby the two intraseasonalmodes(Zhou and Li,2010).Note that interactionsbetween SSWs and the low-frequency large-scale oscillations of the QBWO and MJO may lead to changes in GPIanomaliesand TCG cases.The relationshipbetweenGPI anomaliesand TCG casesmightbedi ff erentunder the influencesof the QBWO and M JO,which is deserving of further investigation.

Fig.12.Spatialpatterns of theWNPSSW mode during the(a) activeand(b)inactive QBWO phases.
Thepossible link between TCG and SSW sover theWNP associated w ith the QBWO is also investigated.The SSWs are regarded as amajor seeding forWNP TCG(Li,2006; Fu etal.,2007).During the active QBWO phase,the SSW amplitude is larger than that during the inactive phase.The result is valid for all of the large-scale patterns,exceptGY, and more TCGs occur during the active QBWO phase.In this study,only about 7%of the total 311 TCG events occur under the PTC pattern.Based upon the definition of TC cases associated w ith the PTC pattern,it is explicitly understood that these TCs correspond to SSWs over the WNP. Sim ilarly,the considerable num ber of TC cases occurring under other flow patternsm ight also be closely associated w ith SSWs.For example,as suggested in previous studies, amixed Rossby–gravity wave can transit to SSWs in an environment of active convection and zonalw ind confluence (Dickinson and Molinari,2002;Aiyyerand Molinari,2003), suggesting TCG eventsunder the EW pattern and CFpattern may be associatedw ith SSWs.Thus,thevariability of SSWs may beara close relationship w ithWNPTCG events.Additionally,a number of studies have suggested that TCG over theWNP basinm ightalso be related w ith other convectively coup led equatorialwaves(BessafiandW heeler,2006;Frank and Roundy,2006).To date,studieson the equatorialwaves and TCs associated w ith the fivemajor large-scale patterns are relatively limited.
Acknow ledgements.This study w as jointly supported by the National Natural Science Foundation of China(Grant Nos. 41675072,41305050,41275093,41475091 and 41305039), the National Basic Research Program of China(Grant Nos. 2013CB430301,2013CB430103 and 2015CB452803),the Jiangsu ProvincialNatural Science Fund Project(GrantNo.BK20150910), the Natural Science Foundation of the Jiangsu Higher Education Institutions of China(Grant No.14KJA170005),the Priority Academic Program Development of Jiangsu Higher Education Institutions(PAPD),the Projectof GlobalChangeand Air–Sea Interaction (Grant No.GASI-03-IPOVAI-04),and the base funding of the Atlantic Oceanographic and Meteorological Laboratory(AOML).The findingsand conclusions in this reportare those of the author(s)and do notnecessarily represent the views of the funding agency.This study isEarth System Modelling Center Contribution Number117.
Aiyyer,A.R.,and J.Molinari,2003:Evolution ofm ixed Rossbygravity waves in idealized MJO environments.J.Atmos.Sci., 60,2837–2855.
Bessafi,M.,and M.C.Wheeler,2006:Modulationof South Indian Ocean tropicalcyclonesby theMadden–Julianoscillationand convectively coupled equatorialwaves.Mon.Wea.Rev.,134, 638–656.
Bister,M.,and K.A.Emanuel,2002:Low frequency variability of tropical cyclone potential intensity 1.Interannual to interdecadal variability.J.Geophys.Res.,107(D24),ACL 26-1–ACL 26-15.
Camargo,S.J.,and A.H.Sobel,2005:Western North Pacific tropical cyclone intensity and ENSO.J.Climate,18,2996–3006.
Camargo,S.J.,M.C.W heeler,and A.H.Sobel,2009:Diagnosis of the MJO modulation of tropical cyclogenesis using an empirical index.J.Atmos.Sci.,66,3061–3074.
Chan,J.C.L.,2005:Interannual and interdecadal variations of tropical cyclone activity over thewestern North Pacific.Meteor.Atmos.Phys.,89,143–152.
Chan,J.C.L.,2008:Decadal variationsof intense typhoon occurrence in thewestern North Pacific.Proc.Roy.Soc.London, 464,249–272.
Chang,C.-P.,and G.T.-J.Chen,1995:Tropical circulationsassociatedwith southwestmonsoon onsetand westerly surgesover the South China Sea.Mon.Wea.Rev.,123(11),3254–3267.
Chen,G.H.,and C.H.Sui,2010:Characteristics and origin of quasi-biweekly oscillationover thewestern North Pacific during boreal summer.J.Geophys.Res.,115(D14),D14113.
Chen,T.C.,and J.M.Chen,1993:The 10–20-day mode of the 1979 Indianmonsoon:Its relation w ith the time variation of monsoon rainfall.Mon.Wea.Rev.,121,2465–2482.
Chen,T.C.,M.C.Yen,and P.S.Weng,2000:Interaction between the summermonsoons in EastAsiaand the South China Sea: Intraseasonalmonsoon modes.J.Atmos.Sci.,57(9),1373–1392.
Chia,H.-H,and C.-F.Ropelewski,2002:The interannual variability in thegenesis location of tropical cyclones in thenorthwest Pacific.J.Climate,15,2934–2944.
Dare,R.A.,and J.L.M cBride,2011:The threshold sea surface temperature condition for tropical cyclogenesis.J.Climate, 24,4570–4576.
Dickinson M.,J.Molinari,2002:M ixed Rossby-gravity wavesand w estern Pacific tropical cyclogenesis.Part I:Synoptic evolution.J.Atmos.Sci.,59(14),2183–2196.
Emanuel,K.A.,and D.S.Nolan,2004:Tropical cyclone activity and theglobal climate system.Preprints,26th Conf.on Hurricanesand TropicalMeteorology,Miami,FL,Amer.Meteor. Soc.,10A.2.
Frank,W.M.,and P.E.Roundy,2006:The role of tropicalw aves in tropical cyclogenesis.Mon.Wea.Rev.,134,2397–2417.
Fu,B.,T.Li,M.S.Peng,and F.Z.Weng,2007:Analysisof tropical cyclogenesis in the western North Pacific for 2000 and 2001.Wea.Forecasting,22,763–780.
Gray,W.M.,1968:G lobal view of the origin of tropical disturbancesand storm s.Mon.Wea.Rev.,96,669–700.
Gray,W.M.,1979:Hurricanes:Their formation,structure and likely role in the tropical circulation.Meteorology Over the TropicalOceans,D.B.Shaw,Ed.,Roy,Meteorological Society,155–218.
Hartmann D.L.,M.L.M ichelsen,S.A.K lein,1992:Seasonal variations of tropical intraseasonal oscillations:A 20-25-day oscillation in thewestern Pacific.J.Atmos.Sci.,49(14), 1277–1289.
Ho,C.H.,J.J.Baik,J.H.Kim,D.Y.Gong,and C.H.Sui,2004: Interdecadal changes in summertime typhoon tracks.J.Climate,17(9),1767–1776.
Hsu,H.-H.,C.-H.Weng,and C.H.Wu,2004:Contrasting characteristics between the northward and eastward propagation of the intraseasonal oscillation during the boreal summer.J. Climate,17,727–743.
Huang,P.,C.Chou,and R.H.Huang,2011:Seasonalmodulation of tropical intraseasonaloscillationson tropicalcyclone geneses in thewestern North Pacific.J.Climate,24,6339–6352.
Hu ff man,G.J.,and Coauthors,2007:The TRMM multi-satellite precipitation analysis:Quasi-global,multi-year,combinedsensor precipitation estimates at fine scales.Journal ofHydrometeorology,8,38–55.
Jiang,X.A.,T.Li,and B.Wang,2004:Structuresandmechanism s of thenorthward propagatingborealsummer intraseasonaloscillation.J.Climate,17,1022–1039.
Jiang,X.A.,M.Zhao,and D.E.Waliser,2012:Modulation of tropical cyclones over theeastern Pacificby the intraseasonal variability simulated in an AGCM.J.Climate,25,6524–6538.
Kim,J.H.,C.H.Ho,H.S.Kim,C.H.Sui,and S.K.Park,2008: Systematic variation of summertime tropical cyclone activity in thewestern North Pacific in relation to theMadden-Julian oscillation.J.Climate,21,1171–1191.
Klotzbach,P.J.,2014:The Madden–Julian Oscillation’s impacts on worldw ide tropical cyclone activity.J.Climate,27(6), 2317–2330.
K lotzbach,P.J.and W.M.Gray,2008:Multidecadal variability in North Atlantic tropicalcyclone activity.J.Climate,21,3929–3935.
Klotzbach,P.J.,and E.C.J.Oliver,2015:Variations in global tropical cyclone activity and the Madden–Julian oscillation since the midtwentieth Century.Geophys.Res.Lett.,42, 4199-4207,doi:10.1002/2015GL06396.
Lander,M.A.,1994:An exploratory analysis of the relationship between tropicalstorm formation in thewestern North Pacific and ENSO.Mon.Wea.Rev.,122,636–651.
Lau,K.-H.,and N.-C.Lau,1990:Observed structure and propagation characteristics of tropical summertime synoptic scale disturbances.Mon.Wea.Rev.,118,1888–1913.
Lee,J.-Y.,B.Wang,M.C.W heeler,X.H.Fu,D.E.Waliser,and I.-S.Kang,2013:Real-timemultivariate indices for the borealsummer intraseasonaloscillation over the Asian summer monsoon region.Climate Dyn.,40,493–509.
Li,C.Y.,and Y.P.Zhou,1995:On quasi-two-week(10-20-day) oscillation in the tropicalatmosphere.Scientia Atmospherica Sinica,19,435–444.(in Chinese)
Li,R.C.Y.,and W.Zhou,2013a:Modulation of Western North Pacific tropical cyclone activity by the ISO.Part I:Genesis and intensity.J.Climate,26,2904–2918.
Li,R.C.Y.,and W.Zhou,2013b:Modulation ofwestern North Pacific tropical cyclone activity by the ISO.Part II:Tracks and land falls.J.Climate,26,2919–2930.
Li,T.,2006:Origin of the summertime synoptic-scalewave train in thewestern North Pacific.J.Atmos.Sci.,63,1093–1102, doi:10.1175/JAS3676.1.
Li,T.,and B.Fu,2006:Tropical cyclogenesis associated with Rossby wave energy dispersion ofa preexisting typhoon.Part I:Satellite dataanalyses.J.Atmos.Sci.,63,1377–1389.
Li,T.,X.Y.Ge,B.Wang,and Y.T.Zhu,2006:Tropical cyclogenesis associated with Rossby wave energy dispersion of a preexisting typhoon.Part II:Numericalsimulations.J.Atmos. Sci.,63,1390–1409.
Liebmann,B.,H.H.Hendon,and J.D.Glick,1994:The relationship between tropical cyclones of thewestern Pacific and Indian Oceansand theMadden–Julian Oscillation.J.Meteor. Soc.Japan,72,401–412.
Liu,K.S.,and J.C.L.Chan,2008:Interdecadal variability of western North Pacific tropical cyclone tracks.J.Climate,21, 4464–4476.
Madden,R.A.,and P.R.Julian,1971:Detection of a 40–50 day oscillation in the zonalwind in the tropical Pacific.J.Atmos. Sci.,28,702–708.
McBride,J.L.,1981:Observational analysis of tropical cyclone formation.Part III:Budgetanalysis.J.Atmos.Sci.,38,1152–1166.
McBride,J.L.,R.Zehr,1981:Observational analysis of tropical cyclone formation.Part II:Comparison of non-developing versusdeveloping systems.J.Atmos.Sci.,38(6),1132–1151.
Nakazawa,T.,1986:IntraseasonalvariationsofOLR in the tropics during the FGGE year.J.Meteor.Soc.Japan,64,17–34.
Nakazawa,T.,1988:Tropical super clusters w ithin intraseasonal variationsover theWestern Pacific.J.Meteor.Soc.Japan,66, 823–839.
Onogi,K.,and Coauthors,2007:The JRA-25 reanalysis.J.Meteor.Soc.Japan,85,369–432.
Reed,R.J.,and E.E.Recker,1971:Structure and properties of synoptic-scale wave disturbances in the equatorial westernPacific.J.Atmos.Sci.,28,1117–1133.
Reed,R.J.,D.C.Norquist,and E.E.Recker,1977:The structure and properties of A frican wave disturbances asobserved during phase IIIof GATE.Mon.Wea.Rev.,105,317–333.
Ritchie,E.A.,and G.J.Holland,1999:Large-scale patternsassociatedwith tropical cyclogenesis in thewestern Pacific.Mon. Wea.Rev.,127,2027–2043.
Sobel,A.H.,and C.S.Bretherton,1999:Development of synoptic-scale disturbances over the summertime tropical northwestPacific.J.Atmos.Sci.,56,3106–3127.
Takayabu,N.Y.,and T.Nitta,1993:3–5 day-period disturbances coupled w ith convection over the tropical Pacific Ocean,J. Meteor.Soc.Japan,71,221–246.
Wang,B.,and X.H.Xu,1997:Northern hem isphere summer monsoon singularities and climatological intraseasonal oscillation.J.Climate,10(5),1071–1085.
Wang,B.,and J.C.L.Chan,2002:How strong ENSO events affect tropicalstorm activity over thewestern North Pacific.J. Climate,15,1643–1658.
Wang,B.,and X.Zhou,2008:Climate variation and prediction of rapid intensification in tropical cyclones in thewestern North Pacific,Meteor.Atmos.Phys.,99,1–16,doi:10.1007/s00703-006-0238-z.
Wang,L.,G.H.Chen,and R.H.Huang,2009:Themodulation of quasi-biweekly oscillation on tropical cyclone activity over the w estern North Pacific.Chinese Journal of Atmospheric Sciences,33,416–424.(in Chinese)
Wheeler,M.C.,and H.H.Hendon,2004:An all-season real-time multivariate MJO index:Developmentof an index formonitoring and prediction.Mon.Wea.Rev.,132,1917–1932.
Wu,L.,J.Liang,and C.-C.Wu,2011:Monsoonal Influence on Typhoon M orakot(2009).Part I:Observational Analysis.J. Atmos.Sci.,68,2208–2221.
Wu,L.,and J.Duan,2015:Extended simulation of tropical cyclone formation in thewestern North Pacificmonsoon trough. J.Atmos.Sci.,72,4469–4485.
Yasunari,T.,1979: Cloudiness fluctuations associated w ith the northern hem isphere summer monsoon.J.Meteor.Soc. Japan,57,227–242.
Yoshida,R.,and H.Ishikawa,2013:Environmental factors contributing to tropical cyclone genesis over the western North Pacific.Mon.Wea.Rev.,141,451–467.
Yoshida,R.,Y.Kajikawa,and H.Ishikawa,2014:Impactofboreal summer intraseasonal oscillation on environment of tropical cyclone genesis over the Western North Pacific.SOLA,10, 15–18.
Zhang,Q.,Q.Liu,and L.Q.Wu,2009:Tropical cyclone damages in China1983–2006.Bull.Amer.Meteor.Soc.,90,489–495.
Zhao,H.K.,and L.G.Wu,2014:Inter-decadal shiftof the prevailing tropical cyclone tracksover thew estern North Pacific and itsmechanism study.Meteor.Atmos.Phys.,125,89–101.
Zhao,H.K.,and C.Z.Wang,2015:Interdecadalmodulation on the relationship between ENSO and typhoon activity during the late season in theWestern North Pacific.Climate Dyn., doi:10.1007/s00382-015-2837-1.
Zhao,H.K.,L.G.Wu,and W.C.Zhou,2010:Assessing the influence of the ENSO on tropical cyclone prevailing tracks in the western North Pacific.Adv.Atmos.Sci.,27(6),1361–1371, doi:10.1007/s00376-010-9161-9.
Zhao,H.K.,L.G.Wu,andW.C.Zhou,2011:Interannual changes of tropical cyclone intensity in the western north Pacific.J. Meteor.Soc.Japan,89(3),243–253,doi:10.2151/jm sj.2011-305.
Zhao,H.K.,L.G.Wu,and R.F.Wang,2014:Decadal variationsof intense tropical cyclones over thewestern North Pacific during 1948-2010.Adv.Atmos.Sci.,31(1),57–65,doi: 10.1007/s00376-013-3011-5.
Zhao,H.K.,X.A.Jiang,and L.G.Wu,2015a:M odulation of Northw est Pacific tropical cyclone genesis by the intraseasonal variability.J.Meteor.Soc.Japan,93(1),81–97,doi: 10.2151/jmsj.2015-006.
Zhao,H.K.,R.Yoshida,and G.B.Raga,2015b:Impactof the madden-Julian oscillation onWestern North Pacific tropical cyclogenesis associated w ith large-scale patterns.Journal of Applied Meteorology and Climatology,54,1423–1429,doi: 10.1175/JAMC-D-14-0254.1.
Zhao,H.K.,X.A.Jiang,and L.G.Wu,2016:Boreal summer synoptic-scale waves over the western North Pacific in multimodelsimulations.J.Climate,doi:10.1175/JCLI-D-15-0696.
Zhou,C.H.,and T.Li,2010:Upscale feedback of tropicalsynoptic variability to intraseasonaloscillations through thenonlinear rectification of the surface latentheat flux.J.Climate,23, 5738–5754.
:Zhao,H.K.,C.Z.Wang,and R.Yoshida,2016:Modulation of tropical cyclogenesis in thewestern North Pacific by thequasi-biweekly oscillation.Adv.Atmos.Sci.,33(12),1361–1375,
10.1007/s00376-016-5267-z.
(Received 19December2015;revised 27May 2016;accepted 13 June2016)
?Corresponding author:Haikun ZHAO
Email:zhk2004y@gmail.com
?Institute ofAtmospheric Physics/Chinese Academy of Sciences,and Science Press and Springer-Verlag Berlin Heidelberg 2016
 Advances in Atmospheric Sciences2016年12期
- Advances in Atmospheric Sciences的其它文章
- Characteristicsof the Asian-Pacif c Oscillation in Boreal Summer Simulated by BCC CSM w ith Di ff erent HorizontalResolutions
- Role of the Oceanic Channel in the Relationshipsbetween the Basin/DipoleM ode of SST Anomalies in the Tropical Indian Ocean and ENSO Transition
- Characterizing the Urban Tem perature Trend Using SeasonalUnit Root Analysis:Hong Kong from 1970 to 2015
- AnomalousWestern Pacif c SubtropicalHigh during Late Summer in Weak La Ni?na Years:Contrastbetween 1981 and 2013
- The Upstream“Strong Signals”of theWater Vapor Transport over the Tibetan Plateau during a Heavy Rainfall Event in the Yangtze River Basin
- Simulation by CM IP5M odelsof the Atlantic M ultidecadal Oscillation and ItsClimate Im pacts