
M2LC-Net:A Multi-Modal Multi-Disease Long-Tailed Classification Network for Real Clinical Scenes
2021-10-15 09:18:44ZhonghongOuWenjunChaiLifeiWangRuruZhangJiawenHeMeinaSongLifeiYuanShengjuanZhangYanhuiWangHuanLiXinJiaRujianHuang
China Communications 2021年9期
Zhonghong Ou,Wenjun Chai,Lifei Wang,Ruru Zhang,Jiawen He,Meina Song,Lifei Yuan,Shengjuan Zhang,Yanhui Wang,Huan Li,Xin Jia,Rujian Huang
1 Beijing University of Posts and Telecommunications,Beijing 100876,China
2 Hebei Eye Hospital,Xingtai 054001,China
Abstract:Leveraging deep learning-based techniques to classify diseases has attracted extensive research interest in recent years.Nevertheless,most of the current studies only consider single-modal medical images,and the number of ophthalmic diseases that can be classified is relatively small.Moreover,imbalanced data distribution of different ophthalmic diseases is not taken into consideration,which limits the application of deep learning techniques in realistic clinical scenes.In this paper,we propose a Multimodal Multi-disease Long-tailed Classification Network(M2LC-Net)in response to the challenges mentioned above.M2LC-Net leverages ResNet18-CBAM to extract features from fundus images and Optical Coherence Tomography(OCT)images,respectively,and conduct feature fusion to classify 11 common ophthalmic diseases.Moreover,Class Activation Mapping(CAM)is employed to visualize each mode to improve interpretability of M2LC-Net.We conduct comprehensive experiments on realistic dataset collected from a Grade III Level A ophthalmology hospital in China,including 34,396 images of 11 disease labels.Experimental results demonstrate effectiveness of our proposed model M2LC-Net.Compared with the stateof-the-art,various performance metrics have been improved significantly.Specifically,Cohen’s kappa coefficient κ has been improved by 3.21%,which is a remarkable improvement.
Keywords: deep learning; multi modal; long-tail;ophthalmic disease classification
I.INTRODUCTION
The human eye is one of the most important sensory organs.The tissue structure of the eye is so fine that even a minor damage might lead to visual deterioration or even loss of vision[1].Currently,a large number of imaging modalities enable assessment and quantification of ocular changes from a healthy status.Ocular fundus imaging plays a fundamental role in monitoring the health status of the human eye[2].Optical Coherence Tomography (OCT)is a type of non-contact,non-invasive imaging technique that can provide clear pathological cross-sectional images of the macula[3].In recent years,deep learning techniques have been leveraged in medical field because of its high efficiency and accuracy.It mitigates the subjectivity of human doctors to a large extent,making diagnosis of diseases more objective and stable[4].Thus,leveraging deep learning techniques to assist diagnosing ophthalmology diseases has attracted extensive research interest.
For practical clinical diagnosis,ophthalmologists usually diagnose the type and severity of the disease based on a variety of medical images.For example,fundus images and OCT are usually employed to provide ocular pathological features from different perspectives.For most ophthalmic diseases,these two types of medical images can be combined together to make a definitive diagnosis.Nevertheless,most current studies leveraging deep learning based techniques to classify ophthalmic diseases utilize a single modal solely,i.e.,using fundus images or OCT only.For instance,Burlina et al.[5]employed a deep Convolutional Neural Network(CNN)pretrained on ImageNet[6]to extract visual features from fundus images,and then trained a linear Support Vector Machine(SVM) classifier.Lee et al.[7]trained a VGG16[8]model to classify OCT images either as normal or as Age-related Macular Degeneration(AMD).
Nevertheless,the usage of images from a single modal usually does not result in good performance.Moreover,there are a large number of ophthalmic diseases whose occurrences are severely imbalanced.Namely,a small number of diseases occur highly frequently and account for the majority in the samples,while the big number of other diseases occur very rarely.Most of the current studies focus on a small number of common ophthalmic diseases solely,and the images are evenly distributed among the diseases,which cannot deal with the complex situations in practical clinical scenarios effectively.For example,Kermany et al.[9]employed Inception-V3[10]to classify three diseases,i.e.,Choroidal Neovascularization(CNV),Diabetic Macular Edema(DME),and Drusen,by leveraging OCT images.Although the proposed model achieved competitive results,the number of diseases classified by the model is relatively small.Moreover,it cannot deal with the long-tailed data distribution effectively that may appear in realistic scenarios.
In this paper,we propose a Multi-modal Multidisease Long-tailed Classification Network M2LCNet,which leverages both fundus images and OCT to boost performance.Moreover,we present a novel twostage training pipeline to improve classification performance of few-shot categories effectively.Furthermore,we utilize Class Activation Mapping(CAM)to visualize each modal’s contribution to the overall performance.Experiments from 11 common ophthalmic diseases demonstrate that M2LC-Net outperforms the state-of-the-art schemes significantly.
Our contributions can be summarized as follows:
1.We propose a Multi-modal Multi-disease Longtailed classification network,i.e.,M2LC-Net,to classify 11 ophthalmic diseases.Both fundus images and OCT are leveraged to boost performance.
2.We present a two-stage training pipeline with class-balanced-loss to improve classification accuracy for few-shot categories.We also employ CAM to visualize each mode to improve the interpretability of M2LC-Net.
3.We conduct experiments on a large-scale realistic dataset collected from a Grade III Level A ophthalmology hospital in China,consisting of 34,395 fundus-OCT pairs covering 11 types of diseases.The size and the number of diseases in the dataset is much larger than existing studies.Experiments demonstrate the effectiveness of M2LC-Net,which outperforms the state-of-the-art to a large extent.
II.RELATED WORK
In this section,we present relevant studies to our work.We first introduce the work that leverages deep learning based techniques to classify ophthalmic diseases.We then present studies that utilize multi-modal images to assist classification.At last,we introduce the classification techniques that deal with long-tailed data distribution.
2.1 Leveraging Deep Learning Techniques to Classify Multiple Ophthalmic Diseases
With the rapid development of deep learning based techniques,an increasing number of studies tend to classify multiple ophthalmic diseases concurrently.Nevertheless,most of them investigate less than five types of ophthalmic diseases,which is much less than the common ophthalmic diseases.
Kermany et al.[9]utilized Inception-V3[10]as the base for transfer learning and realized classification of four types of OCT images,i.e.,normal,CNV,DME,and drusen.They pre-trained Inception-V3[10]on the ImageNet dataset[6],and then transferred to OCT labelled images for fine-tuning.Lu et al.[11]leveraged ResNet101[12]to classify OCT images covering four ophthalmic diseases,i.e.,cystic macular edema,serous macular detachment,epiretinal membrane,and macular hole.Fang et al.[13]proposed a Lesion-Aware Convolutional Neural Network(LACNN) to classify AMD,DME,and normal OCT images.Ghani et al.[14]presented a deep learning model combined with histogram-based pre-processing to classify diabetic retinopathy and glaucoma on fundus images.
Although the studies mentioned above achieve decent classification performance,no more than 5 types of ophthalmic diseases are able to be classified.Moreover,only single-modal medical images have been leveraged,which cannot fully utilize the strength of multi-modal images.
2.2 Multi-modal Ophthalmic Diseases Classification Based on Deep Learning
Fundus images capture feature information in the plane of the retina,whilst OCT reflects interlamellar features of the retinal section.Correspondingly,fundus images and OCT provide information in different dimensions complementing each other.In most cases,ophthalmologists need to combine fundus images and OCT to make a definitive diagnosis.Nevertheless,utilizing multi-modal images to classify ophthalmological diseases based on deep learning techniques has not been well investigated.One possible reason is that it is difficult to collect multi-modal dataset.
The first attempt was made by Yoo et al.[15].They used VGG-Net[8]pre-trained on the ImageNet dataset[6]to extract features from fundus images and OCT.They used a random forest classifier to classify AMD.Experimental results demonstrate that multimodal images can achieve better accuracy than singlemodal images.Nevertheless,the dataset used in Yoo et al.[15]consists of autopsy data,which makes the model inapplicable to patient images in real clinical scenarios and lack of interpretability.
On the basis of Yoo et al.[15],Wang et al.[16]took a step further.They proposed an end-to-end two-stream CNN and leveraged category activation heat maps to visualize the contribution of each mode.Meanwhile,they proposed a loose matching scheme to resolve the problem of lack of multi-modal dataset.Nonetheless,the ophthalmic disease studied in the work is AMD only,which cannot reflect the distribution of ophthalmic diseases in real scenes.Thus,whether two-stream models are suitable for classifying other ophthalmic diseases remains to be investigated,which inspires our work.
2.3 Classification Under Long-Tailed Data Distribution
In conventional classification tasks,the distribution of training data is usually balanced.Namely,there is no big difference among the number of samples in different classes.A balanced dataset simplifies the requirements for algorithm robustness and guarantees reliability of the obtained model to a certain extent.Nonetheless,there are a large number of rare diseases in ophthalmology that are difficult to collect samples,causing long-tailed distribution of dataset.
Kang et al.[17]decomposed the deep learning process into feature representation and classification.Their experimental results demonstrate that with representations learned from instance-balanced sampling,strong long-tailed recognition capability can be achieved by adjusting the classifier solely.Cui et al.[18]designed a reweighting scheme,which uses the effective number of samples of each class to rebalance the loss,resulting in loss of class balance.When training with class-balanced-loss,the model can achieve significant performance improvements on long-tailed dataset.
The studies mentioned above achieve improvement for long-tailed data classification,but they work on natural scenes only.Inspired by the work mentioned above,we propose a novel training pipeline to solve long-tailed data distribution in ophthalmic medical images which has similar representation.
III.PROPOSED ARCHITECTURE
As mentioned in the previous sections,existing studies mostly leverage single-modal medical images,and the number of diseases that can be classified is relatively small.Moreover,long-tailed rare diseases in realistic scenarios cannot be dealt with effectively.To resolve the problems mentioned above,we propose an architecture to address multiple-modal,multiple-disease,and long-tailed images,which we name M2LC-Net.The architecture of M2LC-Net is illustrated in Figure.1.As for the data source,doctors using OCT equipment first locate the lesion area through the infrared macular area fundus map,and then observe imaging lesions in the fundus cross-section display OCT image.The infrared macular fundus image is helpful for disease recognition.Thus,we collect macular fundus images and OCT images as multi-modal input for M2LC-Net.
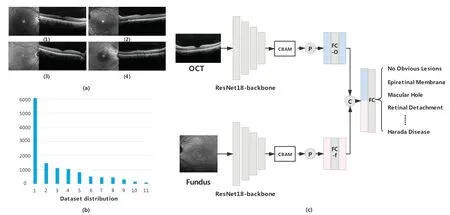
Figure 1. Data example(upper left corner),dataset distribution(lower left corner),and network structure(right).(a) In the data example,(1)is with no obvious disease,(2)is with epiretinal membrane,(3)is with macular hole,and(4)is with central serous chorioretinopathy.(b) Data distribution of 11 diseases in the dataset excluding the category of no obvious disease.The exact number of each category is listed in Table 1.(c)Network structure of M2LC-Net.P stands for the global average pooling operation,FC is the fully connected layer,and C is the concatenation operation.M2LC-Net takes a pair of fundus image and OCT image as input,and makes classification for 12 different types of diseases,including 11 ophthalmic diseases and no obvious lesions.
3.1 Model Structure
We first define datasetD={xf,xO|y},wherexfandxOare fundus images and OCT images obtained from the same eye,respectively.yis the diagnostic label of the group of images,andy ∈{No Obvious Disease,Epiretinal Membrane,Central Serous Chorioretinopathy,Macular Hole,Macular retinoschisis,Choroidal Neovascularization,AMD,Retinal Detachment,Branch Vein Occlusion,Arterial Occlusion,Central Vein Occlusion,Harada Disease}.The dataset includes 11 different types of ophthalmic diseases and no obvious lesions.M2LC-Net takes{xf,xO}as the paired input,and outputs the classification result ?yof the eye as follows:

M2LC-Net consists of two symmetrical branches.One is used to process fundus images,while the other is used to process OCT images.The weights of the two branches are not shared.Each branch employs ResNet18 removing all Fully Connected(FC)layers as the backbone network to extract feature information of the images,then CBAM[19]is connected behind the backbone.
We crop each input image to uniform size.Namely,for each fundus imagexfand OCT imagexO,xf,xO ∈ R224×224×3.LetFfbe the feature map generated by ResNet18-CBAM in the fundus image branch,thenFf ∈R7×7×512.Similarly,we define the feature map of the OCT branch asFO ∈R7×7×512.Letbe the feature map obtained byFfthrough the global average pooling operation,then.
The FC layer on the fundus image branch (FC-f in Figure 1)and the OCT branch(FC-O in Figure.1)do not change the size of the feature map.Namely,the feature mapobtained afterpasses through the FC layer,Similarly,,andAfter that,andare connected to form a 1024-dimension vector,which contains information from the two modes.For classification,the merged vector is fed into the FC layer(FC in Figure.1)to produce the score of the final outputwhich is defined as follows:
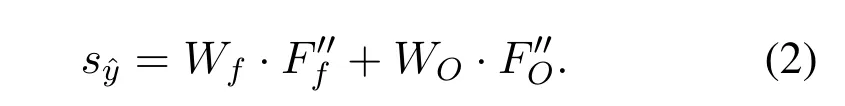
WhereinWfandWOare the class-related weights of the FC layer,Wf,WO ∈R12×512,ands?y ∈R12.The classification result ?yrepresented in Eq.(1)is obtained by selecting the category with the highest score ins?y.
3.2 Heat Map Representation
In order to display the contribution provided by the feature information of each mode effectively,we add CAM[20]to generate the heat map of each modal of input image in M2LC-Net.The part of the model that is particularly concerned is displayed in a highlighted form.DefineFf(x,y)as the value of feature mapFfat point (x,y),whereinx,y ∈{1,2,...,7},andFf(x,y)∈R512×1.Similarly,FO(x,y) is the value ofFOat point (x,y),andFO(x,y)∈R512×1.The CAM operation is defined as follows:
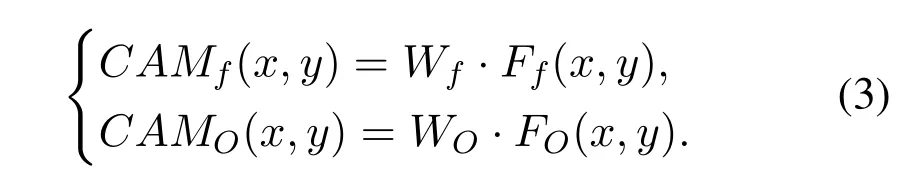
CAMf(x,y)andCAMO(x,y)represent the contribution of specific positions of fundus images and OCT images,respectively.For all (x,y),stitchingCAMf(x,y) together and up-sampling to the same sizexf,and superimposing it withxf,we can acquire the visualized heat map of fundus images.In the same way,the OCT visualization heat map can be obtained.
3.3 Class-Balanced-Loss Training Pipeline
In realistic clinical scenarios,a small number of ophthalmic diseases occurs with relatively high frequency,whilst the other diseases occur very rarely.This leads to long-tailed distribution of clinical imaging data.Our work involves 11 ophthalmic diseases,which is a fairly large number.Among the 11 ophthalmic diseases,4 types of diseases occur relatively rarely,which causes difficulty of collecting data samples for such diseases.Resolving the long-tailed data distribution is a challenging problem.
We employ the Class-Balanced-Loss(CBL)scheme proposed by Cui et al.[18]on focal-loss.To allow the model to better learn the characteristics of the data itself,and avoid the complexity of loss weighting,we let the model perform the first stage of training on the ordinary loss.We then creatively freeze the weights of the convolutional layer after training in the first stage to maintain the learned data features.In the second stage,we train the FC layer solely through re-weighted focal-loss to balance the weight of rare diseases in classification decision.Namely,at first the cross-entropy loss function is used to train the entire model.After the weights converge,the weights except the FC layer are fixed,and CBL is used to retrain the weights of the FC layer.
The number of valid samples for each class is defined as follows:
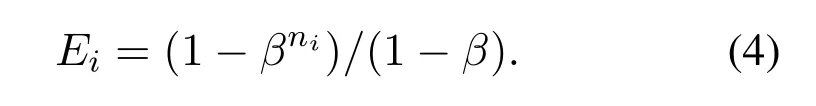
Wherein,N= 12 is the total number of classes,i ∈{1,2,...,N},niis the number of samples of theith label,andβ ∈[0,1) is a hyperparameter.We use the reciprocal of the effective sample number of each class to re-weight the loss function,improving the performance of the long-tailed dataset effectively.
Focal loss[21]is a loss function proposed mainly to solve the problem of severe imbalance in the proportion of positive and negative samples in one-stage target detection.We employ focal loss as the base loss function,which is calculated as follows:
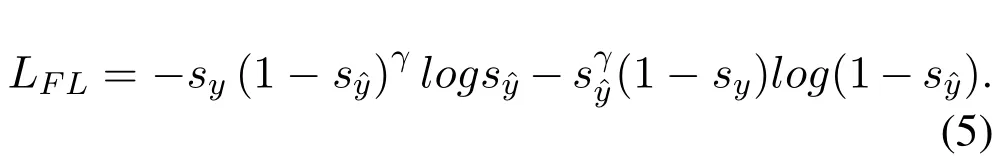
Whereinsyis the one-hot form of labely,sy ∈R12,andγ ≥0 is the focusing parameter.Then the classbalanced-loss can be defined as follows:
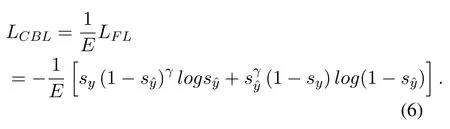
WhereinE=[E1,E2,...,EN],andE ∈R12.
IV.EXPERIMENTS
In this section,we present experimental results of M2LC-Net on the“fundus image+OCT”multi-modal dataset,collected from a Grade III Level A ophthalmology hospital in China.We conduct comparative experiments with single-modal models to verify the advantages of multi-modal models,and perform comparative experiments with the state-of-the-art schemes to demonstrate the effectiveness of our model.Meanwhile,we conduct comparative experiments on 12classes to verify the effectiveness of M2LC-Net on each class.
4.1 Dataset
We collected Electronic Medical Record(EMRs) of 11,829 patients from the ophthalmology hospital mentioned above.The EMRs were desensitized before being collected.By extracting images from the EMRs,a total of 34,396 pairs of medical images were collected,and each pair consists of one macular fundus image and one OCT image.An example of the data is illustrated in Figure.1(a).
We built an ophthalmic medical image labeling system to label the images.Overall,11 ophthalmologists from the Grade III Level A ophthalmology hospital were involved in labelling the images.The dataset contains a total of 12 labels,i.e.,epiretinal membrane,central serous chorioretinopathy,macular hole,macular split,choroidal neovascularization,AMD,retinal detachment,branch vein occlusion,arterial occlusion,central vein occlusion,harada disease,and no obvious disease.
We use 27,517 pairs of images for training,3,440 pairs of images for verification,and 3,439 pairs of images for testing.The data label distribution is illustrated in Figure.(b).Table.1 presents the specific number distribution of each category.It can be seen that the data is very much unbalanced.The ratio of the largest number of no obvious lesions compared to the smallest Harada disease is as high as 257:1.
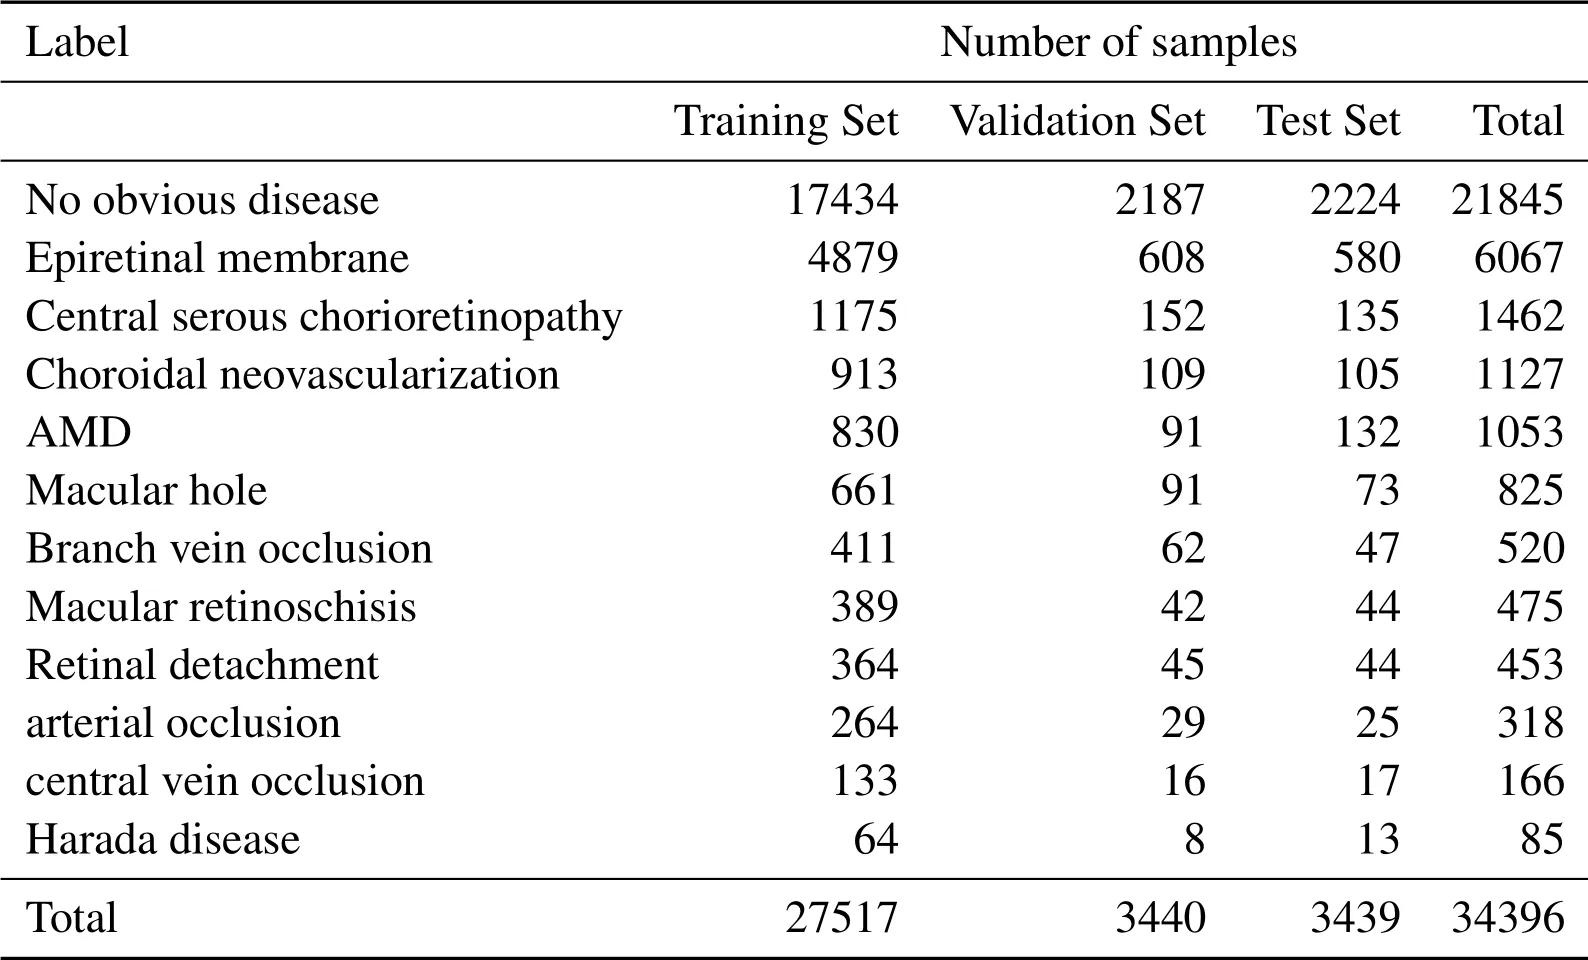
Table 1. Data label distribution.
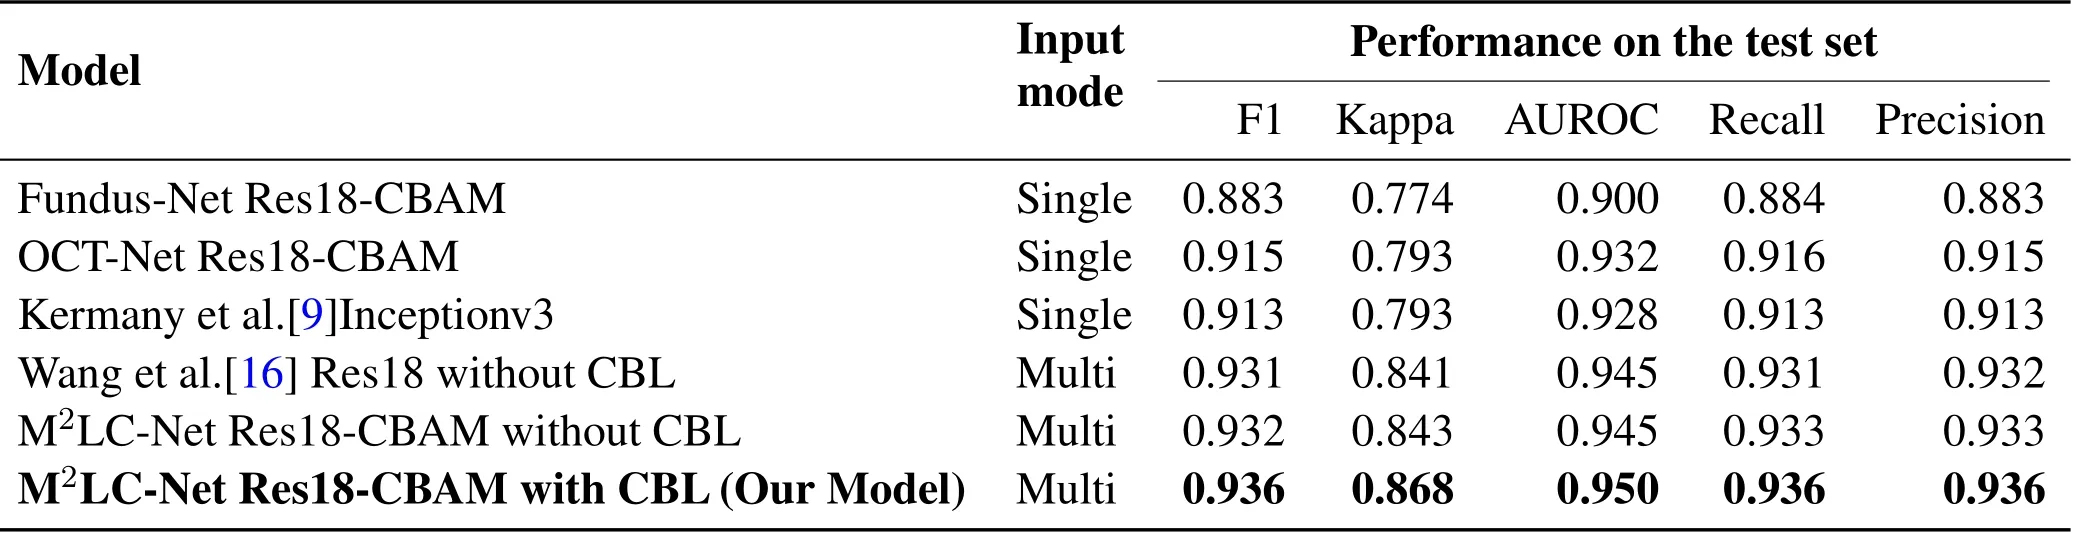
Table 2. Performance of different models on the test set.
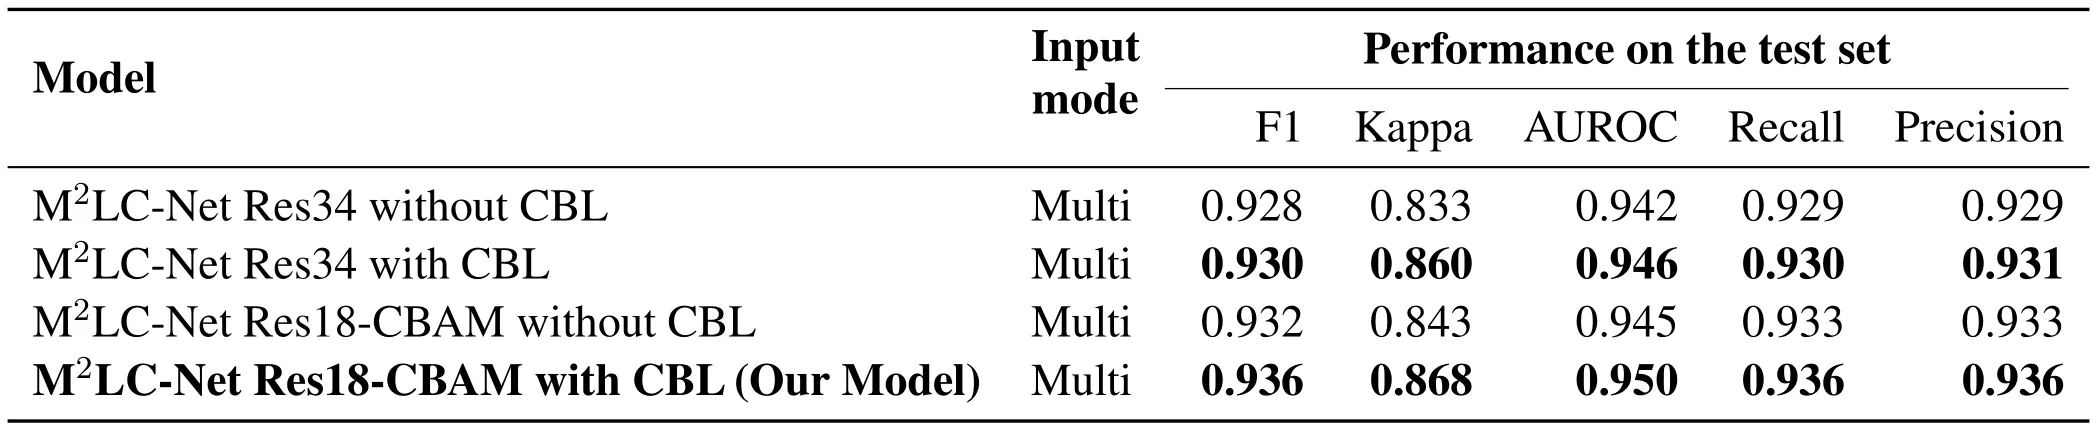
Table 3. Performance of different models using CBL on the test set.

Figure 2. CAM-based visualization of single-modal versus multi-modal models.(a)is the input images of the model,(b)is the CAM heat map of the single-modal model,and(c)is the CAM heat map of the multi-modal model.The brighter areas in(b)and(c)indicate that the model pays more attention to the specific area.
4.2 Implementation Details
The original size of the image is different,we resize it to 224×224×3 uniformly.We employ a probability of 0.5 for 0.5-1.5 degree of contrast enhancement,sharpness enhancement,color enhancement,and brightness enhancement.The images are rotated 0-30 degrees randomly on the training dataset.The framework is based on PyTorch.M2LC-Net is trained for a total of 300 epochs.The learning rate is initially set to 0.01,and decreases in an order every 20 epochs.The momentum is set to 0.9 and the minimum batch size is 32.The hyperparameters in CBL areβ=0.9999,γ=2,and the first training stage stops at the 200th epoch.All experiments are optimized using the Stochastic Gradient Descent(SGD) optimizer until the validation loss converges.All models and training settings are consistent with the original implementation.Experiments are conducted on two NVIDIA GeForce GTX 1080Ti GPUs with 12GB of RAM.
4.3 Comparison of Overall Effects of the Models
In order to demonstrate the effectiveness of multimodal against single-modal models,we use fundus images and OCT images separately to conduct experiments on the single-channel model of M2LC-Net.Namely,onlyoris used to feed the final FC layer,the effective weight of the FC layer isWforWOsolely,and the other settings remain unchanged.We define the two single-channel models as Fundus-Net and OCT-Net,respectively.The experimental results are listed in Table.2.From the table,it can be seen clearly that M2LC-Net has significant improvements in all the five metrics,compared to the two singlemodal models.For example,the Kappa coefficients of Fundus-Net Res18-CBAM and OCT-Net Res18-CBAM are 0.774 and 0.793,respectively,whilst it is 0.868 forM2LC-Net Res18-CBAM with CBL(Our Model),which is a remarkable improvement.
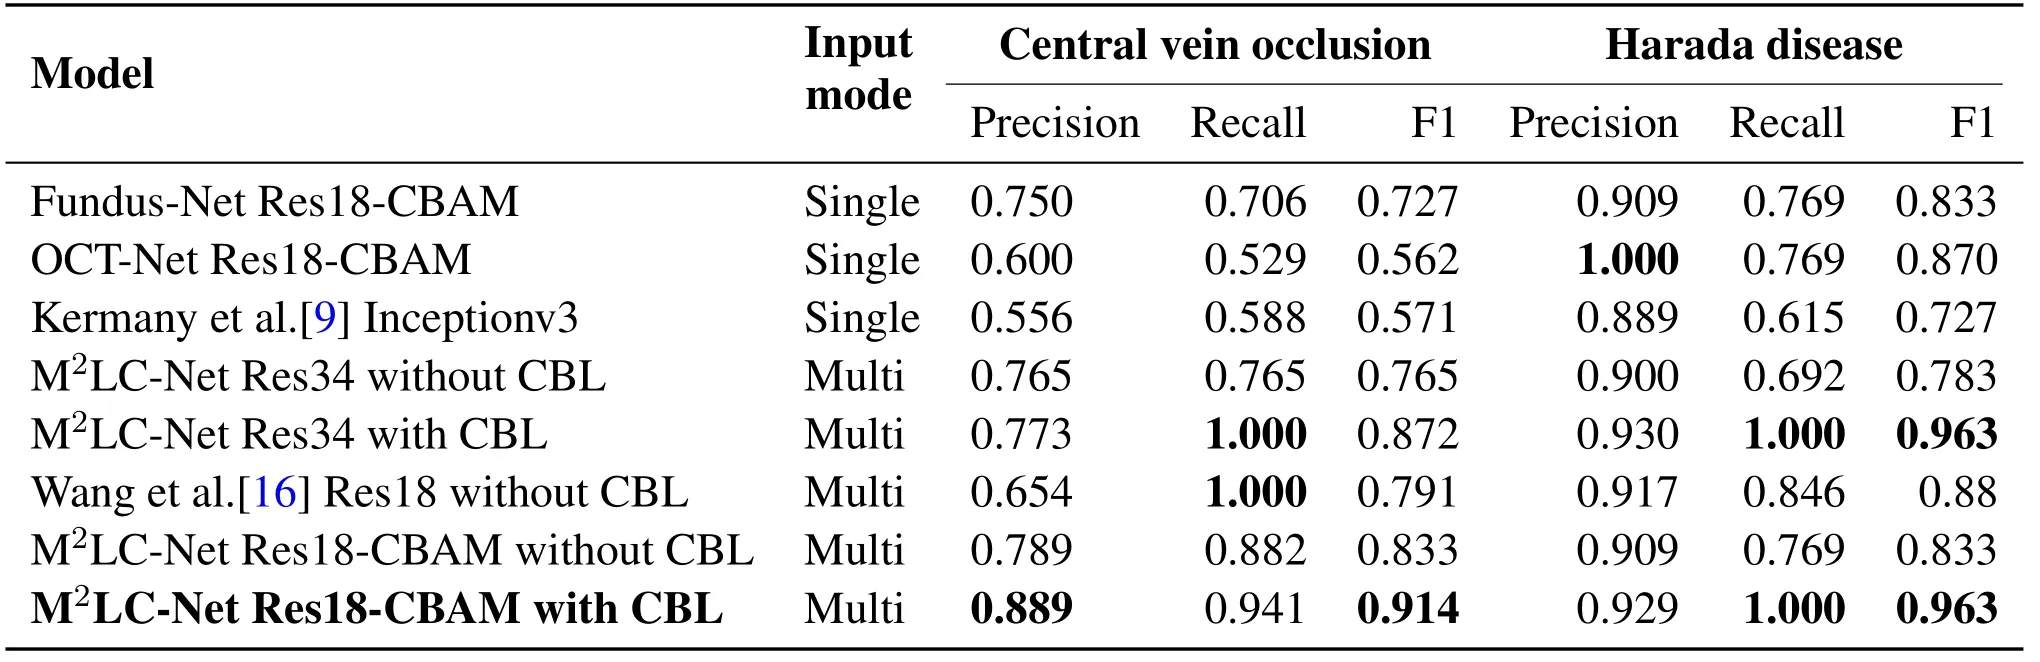
Table 4. Performance of different models on rare diseases.Details of 12 categories are presented in the Supplementary Material.
To compare the performance of M2LC-Net against the state-of-the-art,we select the model proposed by Kermany et al.[9]for comparative experiments.Since the model in Kermany et al.[9]is a single-modal model,we use the OCT images solely in our dataset.Experimental results are demonstrated in Table 2.It can be seen that the single-modal model OCT-Net Res18-CBAM using our scheme is slightly superior to the model proposed by Kermany et al.[9].
We also apply the model proposed by Wang et al.[16]to our dataset for multi-modal input comparative experiments.Since our dataset is sufficient and the number of categories is not balanced,we do not leverage the loose pair scheme proposed by Wang et al.[16]to expand the dataset.It can be seen that the multi-modal model using our scheme M2LC-Net is superior to the model proposed by Wang et al.[16].For example,the Cohen’s kappa coefficientκof ‘Wang et al.[16]Res18 without CBL’ is 0.841,whilst it is 0.868 forM2LC-Net Res18-CBAM with CBL(Our Model),which has been increased by 3.21%.
In order to verify the effectiveness of CBL for longtailed data,we perform an ablation experiment on the loss function.Namely,only the cross-entropy loss function is used to train the model.The ablation experiment is conducted on ResNet34 and ResNet18-CBAM(our model),using scheme with or without CBL.Experimental results are listed in Table 3.It can be seen that in both ResNet34 and ResNet18-CBAM,the model with CBL have been improved significantly for all the 5 performance metrics.For instance,the Kappa coefficient has been increased by 3.24% and 2.97%,respectively.
4.4 Comparison of the Effects of Models on Rare Disease
To present the effects of M2LC-Net on rare ophthalmic diseases in detail,Table 4 lists the performance of different models on rare diseases.We select central venous occlusion and harada disease as two examples,because they are with the least number of samples in our data set,in total 166 and 85 samples,while only 17 and 13 in the test set.It can be seen that the multimodal model is generally superior to the single-modal model in all the three performance metrics,which verifies the advantages of the multi-modal model.At the same time,our model M2LC-Net achieves the best performance in most of the metrics(in bold in Table 4).
4.5 Heat Map Visualization
In order to present the feature information that M2LCNet pays attention to in each modal clearly,we present the heat map generated by CAM in Figure.2.As illustrated in Figure.2(b),the Fundus-Net mistakenly predicts macular retinoschisis as choroidal neovascularization,and the OCT-Net mistakenly predicts harada disease as central serous chorioretinopathy.On the other hand,M2LC-Net can always make correct predictions in both cases,as shown in Figure.2(c).For example,at the first row of Figure.2,when the original fundus image is inputted to Fundus-Net,the neural network only relies on the image characteristics of the fundus image to infer that the patient’s disease might be choroidal neovascularization,and the inference is incorrect.When the original OCT image is inputted to OCT-Net,the neural network only relies on the image characteristics of the OCT image to infer that the patient’s disease might be macular retinoschisis,and the inference is correct this time.M2LC-Net takes two modal images as the input,because of the superiority of the two-way neural network,the characteristics of the two modal images are combined,the patient’s disease is considered to be macular retinoschisis,and the correct prediction result is given.In short,singlemodal models have a greater probability to make false predictions,while multi-modal models are capable of focusing on relevant areas to ophthalmic diseases from the image pairs.Thus,multi-modal models are able to extract feature information more accurately and make correct predictions.
V.CONCLUSION
We proposed M2LC-Net in this paper,which receives fundus images and OCT images concurrently,extracts features,and analyzes multi-modal medical images to classify 11 ophthalmic diseases.Unlike previous studies,we did not artificially balance the label distribution of the training data,but let them fully in line with the long-tailed data from real clinical scenes.To the best of our knowledge,it is the first work that takes into account multi-modal medical images,deals with longtailed data distribution,and can classify more than 10 ophthalmic diseases effectively.In the future,we will cover more rare diseases and refine experiments to add more modal information to boost performance and interpretability.And we plan to leverage text information from electronic medical records as the input of the third modality,and redesign the convolutional neural network to improve performance.
ACKNOWLEDGEMENT
This work was supported by the National Natural Science Foundation of China(No.62076035).

- China Communications的其它文章
- Correlation-Aware Replica Prefetching Strategy to Decrease Access Latency in Edge Cloud
- Secure Transmission in Downlink Non-Orthogonal Multiple Access Based on Polar Codes
- DEEPNOISE:Learning Sensor and Process Noise to Detect Data Integrity Attacks in CPS
- Beamforming Optimization for RIS-Aided SWIPT in Cell-Free MIMO Networks
- Security Risk Prevention and Control Deployment for 5G Private Industrial Networks
- Cost-Minimized Virtual Elastic Optical Network Provisioning with Guaranteed QoS