Mean Sea Level Changes near Weizhou Island from 1969 to 2010
ZHENG Zhaoyong, LI Guangxue, TANG Chaolian, and ZHOU Xiong
1) College of Marine Geosciences, Ocean University of China, Qingdao 266100, P. R. China
2) South China Sea Branch, State Oceanic Administration (SOA), Guangzhou 510300, P. R. China
Mean Sea Level Changes near Weizhou Island from 1969 to 2010
ZHENG Zhaoyong1),2), LI Guangxue1),*, TANG Chaolian2), and ZHOU Xiong2)
1) College of Marine Geosciences, Ocean University of China, Qingdao 266100, P. R. China
2) South China Sea Branch, State Oceanic Administration (SOA), Guangzhou 510300, P. R. China
Tidal data from Weizhou, Zhapo, and Shanwei stations between 1969 and 2010 and from five gauging stations in the western Pacific Ocean provided by PSMSL, and the global mean sea level data recorded between December 1992 and December 2010 by TOPEX and Jason satellites were compiled and analyzed. The results show that the perennial mean sea level near Weizhou Island is 211.7 cm (relative to the water gauge zero), and the relative mean sea level rising rate is 2.2 mm yr-1from 1969 to 2010, which is consistent with the relative mean sea level rising rate recorded at other gauging stations in the western Pacific regions and with the global mean sea level rising rate. The absolute mean sea level rising rate at Weizhou Island is 3.0 mm yr-1from 1993 to 2010, also conforming with the global mean sea level rising rate (3.1±0.4 mm yr-1) during the same time period. The highest annual tide level at Weizhou Island has a rising rate of 4.6 mm yr-1and shows a 20-year quasi-periodic variation from 1966 to 2010. The primary cause of the mean sea level rising is global warming.
climatology; mean sea level change; global climate change; Weizhou Island
1 Introduction
As the world economy grows at a high speed, global warming associated with the increased emission of greenhouse gases around the world results in melting of the polar ice sheets, thermal expansion of sea water, melting of mountain glaciers, and rising of the mean sea level (Weisset al., 2011; Alleyet al., 2005; Rignotet al., 2011; Zuoet al., 2009), which will have a significant impact on economy and environment in coastal areas. Numerous studies show that global mean sea level rising rate was about 1.5±0.5 mm yr-1in the 20th century (Nicholls and Cazenave, 2010; Douglas, 1997; IPCC, 2007) and has been accelerated in recent years. According to Church and White (2011), the sea level rising rates are 1.7±0.2, 1.9±0.4, and 3.2±0.4 mm yr-1from 1900 to 2009, 1961 to 2009, and 1993 to 2009, respectively. The present global mean sea level rising rate is 2.8±1.4 mm yr-1, the highest ever reported by IPCC AR4 (Church and White, 2011; Cazenave and Nerem, 2004; Zhang, 2006; Leulietteet al., 2004; Cabaneset al., 2001).
Weizhou Island is located in the northeast Beibu Gulf, the South China Sea, and covers an area of 24.74 km2. Built in 1955, the tide gauge station of Weizhou Island has more than 40 years of continuous tidal records. Since 2000, the tidal flood warning level of Weizhou station has been rising remarkably, which has a significant impact on the island economy. Formed in 6.9–1.2 ka BP and distributed over the Leizhou Peninsula, the west coast of Hainan Island, and the Che Islands, Vietnam, the ancient sand bars (Qiet al., 2003) along the Weizhou Island shore are ideal to be used to study Holocene climate and sea level change (Korotkyet al., 1995). Although the sand bars are located in different tectonic units and the ancient coastal elevation was only an estimate, it is believed that it is caused mainly by absolute sea-level changes. Based on 6.55–1.17 ka BP ancient coral reefs of Dengloujiao, Niuet al.(1997) concluded that the ancient sea level was 3–4 m higher than the present-day sea level. Yuet al.(2002) showed that at least four periods of high sea level had occurred in the surrounding of the Leizhou Peninsula since 7.2 ka BP. In Huangliu, Hainan Province (Sunet al., 2009), three levels of continuous Holocene marine-cut terraces, terrace sandbars and reminents of sea erosion hills are present in the coastal area, suggesting the occurrence of at least three high sea level periods. The Holocene high sea level was related to tectonic activities and climate change. The distances from the Weizhou Island to Dengloujiao and Dongfang are about 103 km and 223 km, respectively. These three places are located in three different tectonic zones. The glacial isostatic adjustment (GIA) values for these three locations ((-0.24±0.03)–(-0.23±0.03) mm yr-1) are similar to the modern sea level rising rates (Zhanet al., 2009). It is believed that the Holocene high sea level of this area is mainly caused by global warming. In early August 2010, the environmental changes were examined by us and the tidal data are analyzed in the present study, with the intention to provideaccurate data for the in-depth study of the Holocene climate and sea level changes of the Weizhou Island.
2 Data
The tidal data for this study were extracted from the‘monthly tidal gauging reports’ for the Weizhou (WZU), Zhapo (ZPO) and Shanwei (SWI) gauge stations. The tide level is relative to the water gauge zero. The Weizhou Island gauge is located at the tip of the Nanwan harbor terminal (Fig.1). The tidal gauging data were missing from July to October 1974. To fill up the data gap, the regression equation (Y=8.5538+0.7969X(cm);n=40,R= 0.87) was built by using the annual average tide levels of the Weizhou Island Station (Y) and the nearby Beihai Station (X) from 1969 to 2009. GIA data were obtained from Wanget al.(2010) and Global Mean Sea Level Time Series (GMSL) data, recorded by T/P and Jason satellites, from the University of Colorado (CU) public achievement (http://sealevel.colorado.edu, 2011-rel1 version). GMSL rising rate was calculated using the linear regression with a 60-day moving average, barometric corrections, and GIA adjustment. Tidal data in the western Pacific area (0°–30°N, 100°–180°E) came from PSMSL (http://www.psmsl. org/). Global temperature anomaly statistics were obtained from the web site of the US National Oceanic and Atmospheric Administration (http://www.cdc.noaa.gov), which covers the time period from 1880 to 2010 (the average from 1961 to 1990 is about 0.1℃ higher than the average from 1901 to 2000). Typhoon data were obtained from the ‘Typhoon Yearbooks’ and the ‘Tropical Cyclone Yearbooks’, published by the National Meteorological Center of CMA from 1969 to 2004 and 2005 to 2009, respectively. The tides around the Weizhou Island are diurnal. The Pacific tidal waves transmitted into the South China Sea enter the study area through the mouth of the Beibu Gulf (Zhang, 2009).
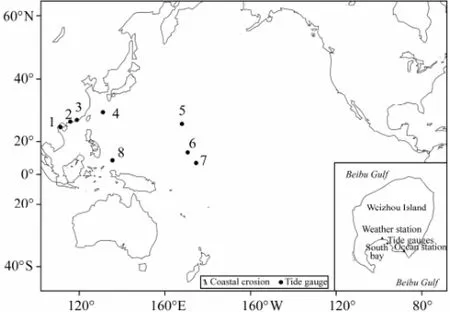
Fig.1 Tide gauge stations. 1, WZU; 2, ZPO; 3, SWI; 4, NAHA; 5, WAKE; 6, KWAJALEIN; 7, MALAKAL; 8, MAJURO.
3 Trends of Annual Mean Sea Level Change
This article mainly analyzes the relative sea level (RSL) change recorded at tidal gauging stations. Based on the Global Sea Level Observing System (GLOSS), the mean sea level from 1975 to 1993 is considered as the perennial mean sea level (hereinafter referred to as perennial) (State Oceanic Administration People’s Republic of China, 2011). The perennial mean sea level at Weizhou is 211.7 cm and the mean sea level in 2000 is 217.0 cm, relative to the water gauge zero. The monthly and yearly perennial mean sea levels are listed in Table 1.
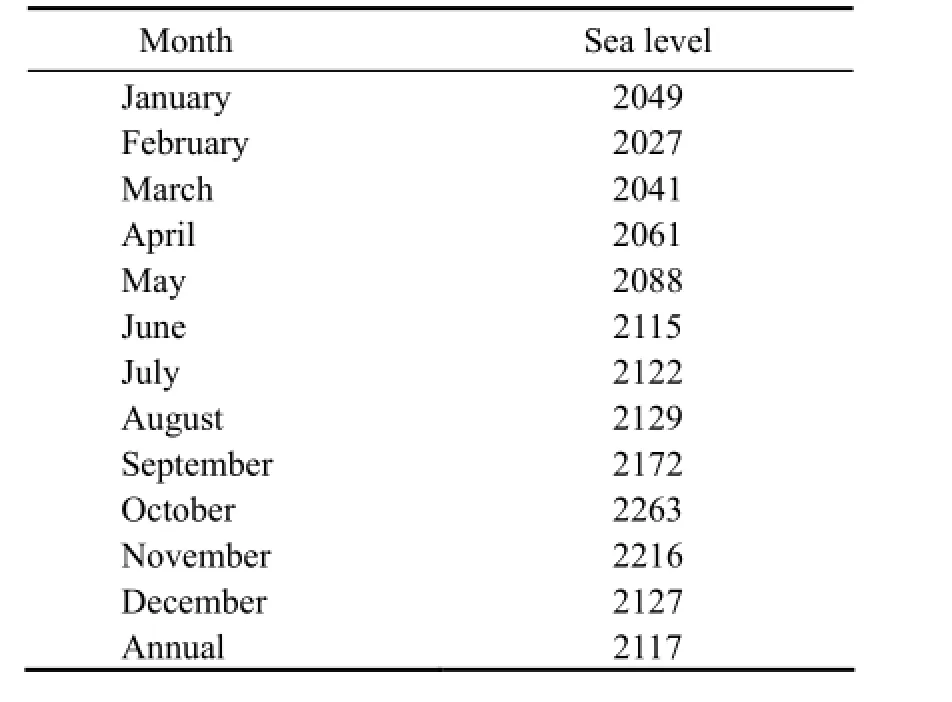
Table 1 The monthly and yearly perennial sea level at Weizhou Island Gauging Station (unit: mm)
The 1992–2010 global mean sea level data by TOPEX and Jason satellites show the fastest mean sea level rise in the western tropical Pacific region. However, out of 13 tide gauges in the region (0°–30°N, 120°–180°E), most of them do not have complete records of sea level data and only 5 tide gauges with relatively longer data records are selected for the contrast analysis below. Fig.2 shows the annual mean sea level trends at Weizhou, Zhapo, Shanwei and several other tidal gauging stations in the western Pacific from 1969 to 2010. Except for Station MALAKAL, data from all the other stations show that the annual mean sea levels after 1994 are higher than the perennial value. In the past 42 years mean sea level rising rate recorded at Weizhou station is 2.2 mm yr-1(R=0.75) and the primary sea level rise occurs after the 1990’s. This sea level rising trend is consistent with that recorded at other gauging stations in the region between 0°–30°N and 100°–180°E and with the mean sea level rising rate reported by Beckeret al.(2012).
Fig.3 shows the trend in monthly mean sea level changes at the Weizhou Island Station (relative to the annual mean sea level in 1993) and the global mean sea level change anomaly (ΔMSL) with a 60-day moving average, barometric correction, and GIA adjustment from December 1992 to December 2010. Note that the mean sea level changes display clear signals of annual, semiannual and monthly variations (Zhanet al., 2003; Shiet al., 2008; Yuet al., 2009; Shenet al., 2010; Wonget al., 2003), and are closely correlated with ENSO events (Yuanet al., 2009; Ronget al., 2008, 2009). Dinget al.(2001) indicated that during an El Nino event, the tropical Pacific trade winds blew from west to east and drove ocean water eastward, causing a relatively high sea level in the eastern tropical Pacific and a relatively low sealevel in the western tropical Pacific and South China Sea. During a La Ni?a event, however, an opposite situation occurred. Typically, an ENSO event occurs every 2 to 3 years. In order to properly compare the present calculations with previous results, moving average of 13, 18, 26 months are applied to the monthly average series in Fig.3. As shown in Table 2, the relative sea level rising rate at the Weizhou Island Station is 2.8 mm yr-1(n=18,R=0.59) from 1993 to 2010. The rate increases to 3.0 mm yr-1after the GIA adjustment is applied, which is close to the global mean sea level rising rate (3.1±0.4 mm yr-1) obtained from satellite measurements in the same time period. It should be pointed out that using data from different satellites and different data processing methods can yield a variation of 0.1–0.2 mm yr-1in the calculations of global mean sea level rising rate based on the satellite measurements in the past 18 years. For example, a rate of 3.1 ±0.4 mm yr-1was given by CU, of 3.2±0.4 mm yr-1by U.S. National Oceanic and Atmospheric Administration (NOAA), of 3.25±0.6 mm yr-1by the Archiving, Validation and Interpretation of Satellite Oceanographic (AVISO), and of 3.2±0.4 mm yr-1by Commonwealth Scientific and Industrial Research Organization (CSIRO) (data above were from http://sealevel.colorado.edu) (Tabel 3).
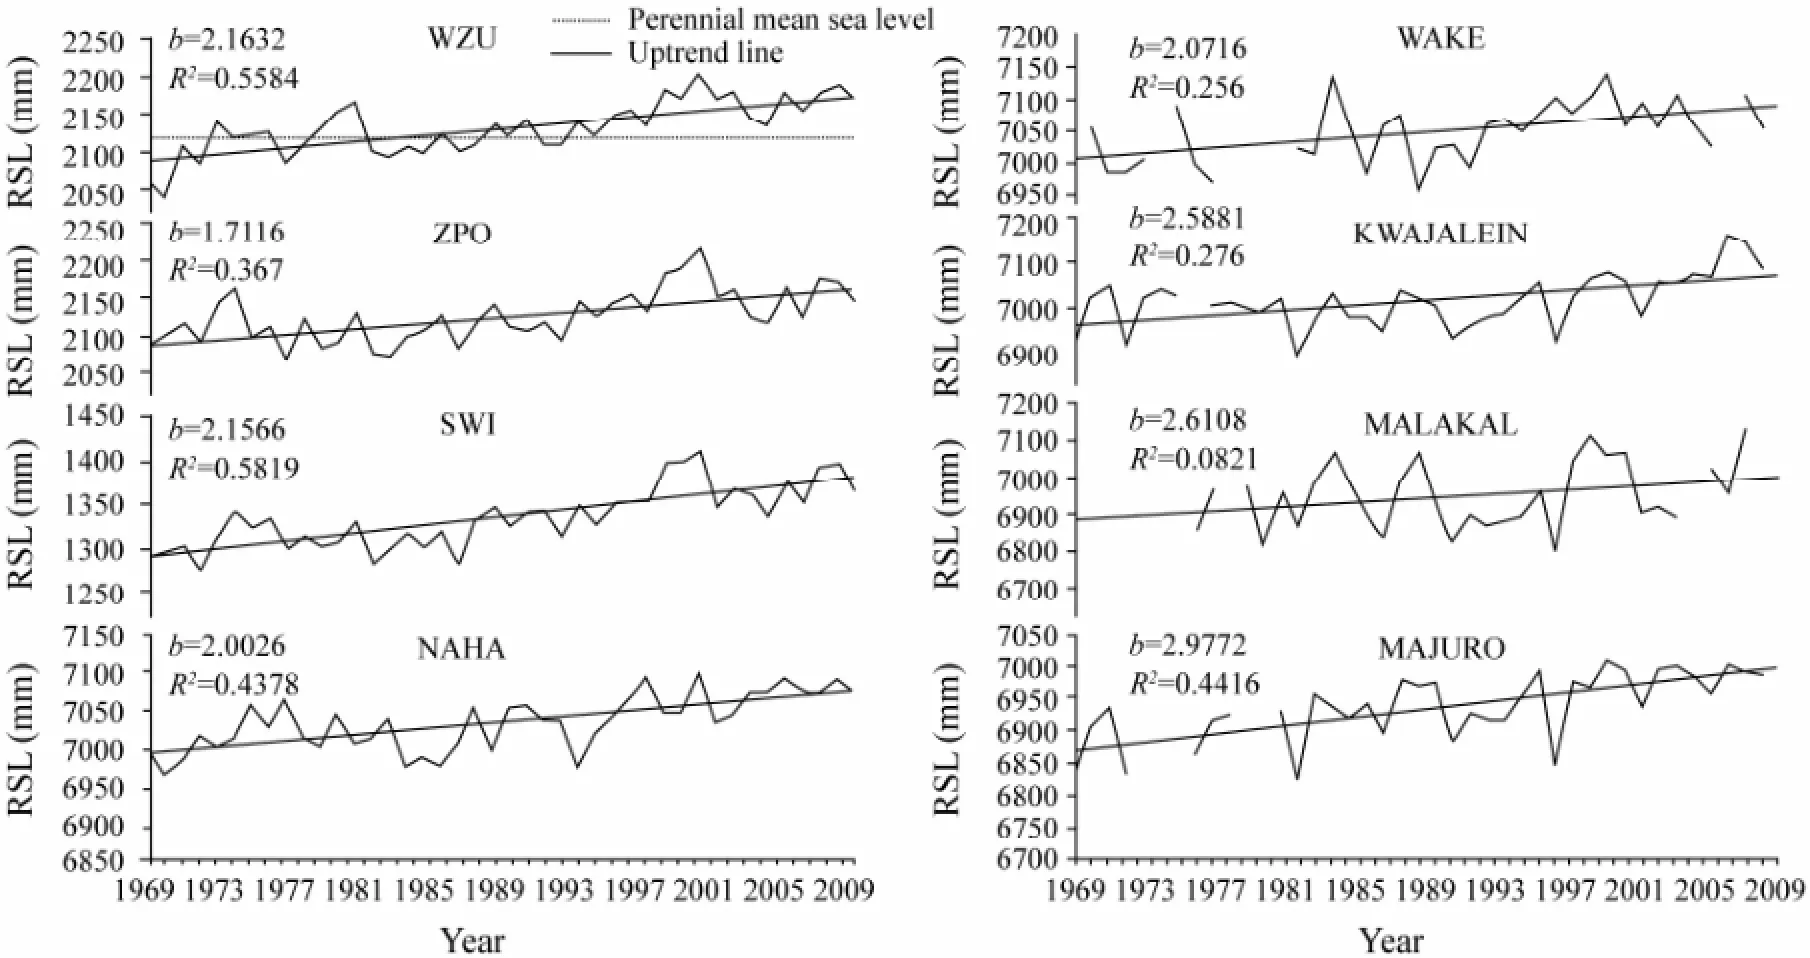
Fig.2 Trends of the mean sea level recorded at various tidal gauging stations from 1969 to 2010 (b is the rising rate (mm yr-1) and R is the correlation coefficient).

Fig.3 The comparisons of (a) sea level at the Weizhou Island station; (b) the global mean sea level (applications of the 60-day moving average, barometric correction and GIA adjustment) from December 1992 to December 2010.

Table 2 The RSL rising rate (b) and the MSL rising rate (b’) after the GIA adjustment at Weizhou from December 1992 to December 2010 (unit: mm yr-1)

Table 3 Global Mean Sea Level (GMSL) rates
Using the global mean sea level changes from 1880 to 2006 (IPCC, 2007) and the ΔMSL data (Fig.4), the average global mean sea level rising rate from 1969 to 2010 is calculated to be 2.3 mm yr-1, close to the RSL rising rate at Weizhou Island (Fig.2), which shows that the sea level changes in Weizhou Island have a good response to the global sea level changes.
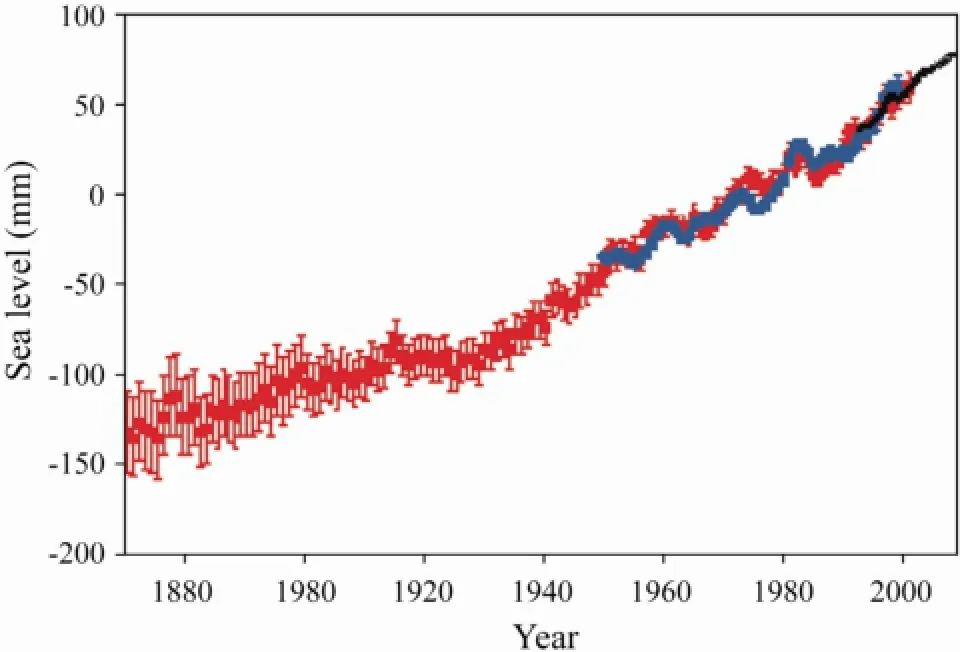
Fig.4 Change of the global sea level (IPCC AR4).
4 Changes of Annual Highest Tide Levels
Fig.5 shows the annual highest tide levels at the Weizhou Island Station from 1966 to 2010. The data clearly display an up to 0.6 m variation range and an ascending trend with a rate of 4.6 mm yr-1(n=45,R=0.38, confidence level=0.01) during this period. In the figure a 20-year quasi-period of tide level changes can also be identified. Typhoon No.8609 landed in Hepu of the Guangxi Zhuang Autonomous Region at 22:00 on July 20, 1986. Moving toward the NW, it brought SW wind and SW waves to the Beibu Gulf. The comcidence between the astronomical tide and the storm conditions resulted in great water accumulation in the Nanwan harbor and the Weizhou Island Station recorded the extremely high tide level of 5.12 m at 16:57 on July 21, 1986 (Fig.5).
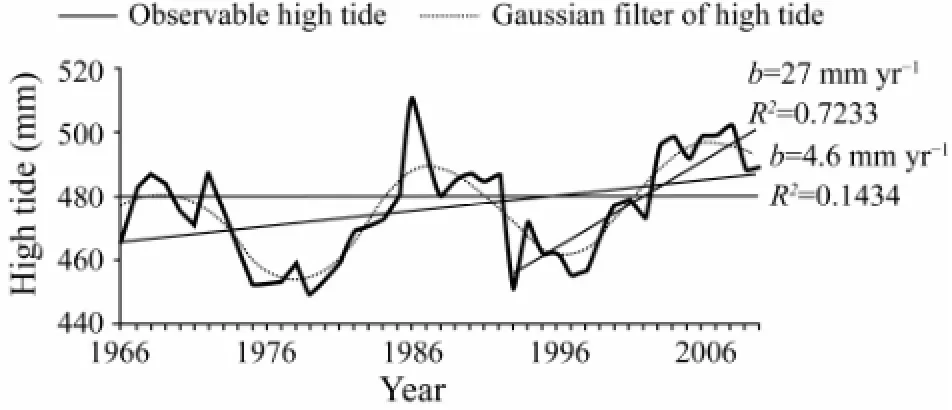
Fig.5 Annual highest tide level at Weizhou from 1969 to 2010 (b is the rising rate (mm yr-1) and R is the correlation coefficient).
5 The Influence and Future Trends of Seal Level Rise
According to the investigations in the past 10 years, the direct impact of the mean sea level rise at Weizhou Island is evaluated by the number of days that sea level exceeds the flood warning level in the coastal area. Fig.5 shows that from 1986 to 1992 the number is 16 d or about 2.3 d per year on average, whereas it increases to 41 d or about 5.1 d per year from 2003 to 2010. In 2008, the number of days that sea level exceeds the flood warning level is 10 d, a maximum since 1986.
There is a 2 km long recreational beach with a 10° slope in the middle of the Weizhou Island’s west coast, along which is the well-grown shelter-forest. With the rapid economic development in the last 20 years, huge amount of sand was mined on Weizhou Island (Fig.6). The waves with a height of ≥3.8 m appeared 13 times from June to October in nearly 10 years. On July 17, 2010, Typhoon‘Conson’ moved into the Beibu Gulf with the low atmospheric pressure of 970 hPa and the maximum wind speed of 33 m s-1at the center. The maximum wave height of 5.2 m was recorded at Weizhou Island and the beach was submerged. Storm surges and coastal waves aggravated coastal erosion, which is clearly displayed in Fig.6.
In the fourth assessment report of the intergovernmental panel on climate change (IPCC, 2007) global warming was considered the main reason for global sea level rise. The report also shows that global average temperature has risen by 0.74±0.18℃ from 1906 to 2005. Following this trend the global temperature at the end of the 21st century would be 1.4–3.8℃ higher than that in the period 1980–1999, and the global mean sea level could rise by 20–43 cm under the condition of low to middle CO2emissions (B2). Miller and Douglas (2004) indicated that the increase of sea water volume due to global warming results in the global mean sea level rise. The close relationship between global temperature and global mean sea level was also demonstrated by the high correlation coefficient of 0.801 between global temperature and GMSL based on the data from 1993 to 2010 (Market al., 2007; Zheng, 1996; Rahmstorf, 2007a, b).
Mean sea level change near Weizhou Island is closely related to the global temperature change. Using the data from 1969 to 2010 a quadratic regression line between annual average tide level at Weizhou Island (RSL, cm) and global temperature anomaly (Δt, ℃) was obtained:

The correlation coefficient of the regression line is 0.67 and the confidence level is 0.01. The standard deviation (SD) between the reported and measured values is ±3.587, suggesting that the mean sea level rising recorded at the Weizhou Island Station is mainly affected by global warming.
Wang and Wu (2011) analyzed the global temperature fluctuations due to human activities and natural factors, and projected the trend of future temperature change, based on the NOAA global temperature and global carbon emission data from 1880 to 2009. Their study concluded that 2005 is the warmest year in the past 120 years and that by the end of the 21st century, the annual mean global temperature would be 1.4℃ higher than that between 1961 and 1990, and 2.0℃ higher than pre-industrial temperature (Fig.7). Using Eq. (1) and 1.5 SD as the upper and lower limitations, the mean sea level at Weizhou Island at the end of the 21st century would be 38–48 cm higher than the perennial mean sea level. The calculated results are 5 cm lower than the projected low limit by eight synthesis models (Schaefferet al., 2012) and fairly close to the median value of global mean sea level rise (40–43 cm) projected by Church and White (2011) at the end of the 21st century.

Fig.6 Coastal erosion in the southwest of Weizhou Island (photos a and b: courtesy of Weizhou Island gauging station taken on February 25, 2011; photos c and d: courtesy of Zheng Zhaoyong taken on November 13, 2012).
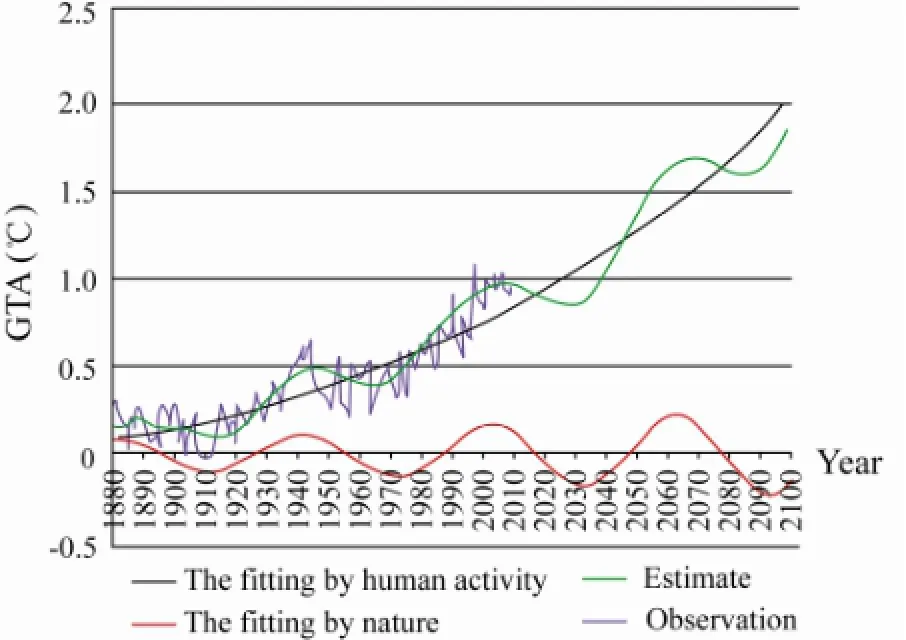
Fig.7 Prediction of global temperature anomalies (GTA) relative to that before industrialisation.
6 Conclusions
Based on the tide data at 8 tide gauges in the northern South China and the western Pacific Ocean between 1969 and 2010, and the global mean sea level data recorded by TOPEX and Jason satellites between 1992 and 2010, the sea level change characteristics in Weizhou Island have been analyzed. The results show that the average relative sea level rising rate is 2.2 mm yr-1during the past 42 years, and is mainly related to global warming. The absolute sea level rising rate is 3.0 mm yr-1in the past 18 years, close to the global sea level rising rate of 3.1±0.4 mm yr-1observed by satellites during the same time period. Sea level changes in Weizhou Island have a good correspondence to the global sea level changes. Human activities and storms have induced coastal erosion along the west coast of Weizhou Island, which will be aggravated due to future sea level rise.
Acknowledgements
This study was supported by the Youth Ocean Science Foundation of SOA, China (2010208) and the Nationa1 Natural Science Foundation of China (41030856).
Alley, R., Clark, P., Huybrechts, P., and Joughin, I., 2005. Ice sheet and sea level changes. Science, 310: 456-460, DOI: 10.1126/science.1114613.
Becker, M., Meyssignac, B., Letetrel, C., Llovel, W., Cazenave, A., and Delcroix, T., 2012. Sea level variations at tropical Pacific islands since 1950. Global and Planetary Change, 80-81: 85-98, DOI: 10.1016/j.gloplacha.2011.09.004.
Cabanes, C., Cazenave, A., and Leprovost, C., 2001. Sea level rise during past 40 years determined from satellite and in situ observations. Science, 294: 840-842, DOI: 10.1126/science. 1063556.
Cazenave, A., and Nerem, R. S., 2004. Present-day sea level change: Observations and causes. Reviews of Geophysics, 42, RG3001, DOI: 10.1029/2003RG000139.
Church, J. A., and White, N. J., 2011. Sea-level rise from the late 19th to the early 21st century. Surveys in Geophysics, 32 (4/5): 585-602, DOI: 10.1007/s10712-011-9119-1.
Church, J. A., Gregory, J. M., and White, N. J., 2011. Understanding and projecting sea level change. Oceanography, 24 (2): 130-143, DOI: 10.5670/oceanog.2011.33.
Ding, X. L., Zheng, D. W., Chen, Y. Q., Chao, J., and Li, Z.,2001. Sea level change in Hong Kong from tide gauge measurements of 1954–1999. Journal of Geodesy, 74 (10): 683-689, DOI: 10.1007/s001900000128.
Douglas, B. C, 1997. Global sea rise: A redetermination. Surveys in Geophysics, 18: 279-292, DOI: 10.1023/A:1006544227856.
IPCC, 2007. Climate Change 2007: The Physical Science Basis. Solomon, S., et al., eds., Cambrige University Press, 996pp.
Korotky, A. M., Razjigaeva, N. G., Ganzey, L. A., Volkov, V. G., Grebennikova, T. A., Bazarova, V. B., and Kovalukh, N. N., 1995. Late Pleistocene-Holocene coastal development of island of Vietnam. Journal of Southeast Asian Earth Sciences, 11 (4): 301-308, DOI: 10.1016/0743-9547(94)E0016-7.
Leuliette, E. W., Nerem, R. S., and Mitchum, G. T., 2004. Calibration of TOPEX/Poseidon and Jason altimeter data to construct a continuous record of mean sea level change. Marine Geodesy, 27 (1): 79-94, DOI: 10.1080/01490410490465193.
Mark, F. M., Mark, B. D., Ursula, K. R., Shad, O., Pfeffer, W. T., Robert, S. A., Suzanne, P. A., and Andrey, F. G., 2007. Glaciers dominate eustatic sea-level rise in the 21st century. Science, 317 (5841): 1064-1067, DOI: 10.1126/science.1143906.
Miller, L., and Douglas, B. C., 2004. Mass and volume contributions to twentieth-century global sea level rise. Nature, 428: 406-409, DOI: 10.1038/nature02309.
Nicholls, R. J., and Cazenave, A., 2010. Sea level rise and its impact on coastal zones. Science, 328 (5985): 1517-1520, DOI: 10.1126/science.1185782.
Nie, B. F., Chen, T. G., Liang, M. T., Zhong, J. L., and Yu, K. F., 1997. Coral reef and high sea level in the holocene in Leizhou Peninsula. Chinese Science Bulletin, 42 (5): 511-514 (in Chinese).
Qi, F. Q., Li, G. Z., Sun, Y., F., Liang, W., and Du, J., 2003. Basic geomorphologic features of the Weizhou Island of the Beibu Bay. Advances in Marine Science, 21 (1): 42-50 (in Chinese with English abstract).
Rahmstorf, S., 2007a. A semi-empirical approach to projecting future sea-level. Science, 315 (5810): 368-370, DOI: 10.1126/ science.1135456.
Rahmstorf, S., 2007b. Response to comment on ‘A semi-empirical approach to projecting future sea-level’. Science, 317 (5846): 1866, DOI: 10.1126/science.1141283.
Rignot, E., Velicogna, I., van den Broeke, M. R., Monaghan, A., and Lenaerts, J. T. M., 2011. Acceleration of the contribution of the Greenland and Antarctic ice sheets to sea level rise. Geophysical Research Letters, 38 (5): L05503/1-L05503/5, DOI: 10.1029/2011GL046583.
Rong, Z. R., Liu, Y. G., Chen, M. C., Zong, H. B., Xiu, P., and Wen, F., 2008. Mean sea level change in the global ocean and the South China Sea and its response to ENSO. Marine Science Bulletin, 27 (1): 1-8 (in Chinese with English abstract).
Rong, Z. R., Liu, Y. G., Zong, H. B., and Xiu, P., 2009. Long term sea level change and water mass balance in the South China Sea. Journal of Ocean University of China, 8 (4): 327-334, DOI: 10.1007/s11802-009-0327-y.
Schaeffer, M., Hare, W., Rahmstorf, S., and Vermeer, M., 2012. Long-term sea-level rise implied by 1.5℃ and 2℃ warming levels. Nature Climate Change, 2: 867-870, DOI: 10.1038/ NCLIMATE1584.
Shen, D. F., Gong, Z., Cheng, Z. M., and Yang, H., 2010. Sea level change in coastal eastern Guangdong (Shanwei) in 1970–2009. Tropical Geography, 30 (5): 461-465 (in Chinese with English abstract).
Shi, X. J., Chen, T. G., and Yu, K. F., 2008. Sea-level changes in Zhujiang Estuary over last 40 years. Marine Geology & Quaternary Geology, 28 (1): 127-134 (in Chinese with English abstract).
State Oceanic Administration People’s Republic of China, 2011. China Sea Level Public Notice 2010, 1-32 (in Chinese).
Sun, G. H., Qiu, Y., and Zhu, B. D., 2009. The tectonic implications of Holocene sea-level relics in the South China Sea and adjacent areas. Acta Oceanologica Sinica, 31 (5): 58-68 (in Chinese).
Wang, H. S., Jia, L. L., Patrick, W., and Hu, B., 2010. Effects of global glacial isostatic adjustment on the secular changes of gravity and sea level in East Asia. Chinese Journal Geophysics, 53 (11): 2590-2602 (in Chinese with English abstract), DOI: 10.3969/j.issn.0001-5733.2010.11.007.
Wang, Z., and Wu, J., 2011. Analysis on global temperature anomalies from 1880 based on genetic algorithm. Quaternary Sciences, 31 (1): 66-72 (in Chinese with English abstract), DOI: 10.3969/j.issn.1001-7410.2011.01.09.
Weiss, J., Overpeck, J. T., and Strauss, B., 2011. Implications of recent sea level rise science for low-elevation areas in coastal cities of the conterminous U.S.A. Climatic Change, 105 (3): 635-645, DOI: 10.1007/s 10584-011-0024-x.
Wong, W. T., Li, K. W., and Yeung, K. H., 2003. Long term sea level change in Hong Kong. Hong Kong Meteorological Society Bulletin, 13: 24-40.
Yu, K. F., Zhong, J. L., Zhao, J. X., Shen, C. D., Chen, T. G., and Liu, D. S., 2002. Biological-geomorphological zones in a coral reef area at southwest Leizhou Peninsula unveil multiple sea level high-stands in the holocene. Marine Geology & Quaternary Geology, 22 (2): 27-33 (in Chinese with English abstract).
Yu, Z. Y., Yuan, L. W., Lv, G. N., Xie, Z. R., Zhang, J. Y., and Mei, W. C., 2009. Multi-scale analysis of sea-level change and its spatial characteristics in northwest Pacific Ocean marginal seas. Geographical Research, 28 (6): 1644-1655 (in Chinese with English abstract), DOI: 10.11821/yj2009060020.
Yuan, L. W., Yu, Z. Y., Xie, Z. R., Song, Z. Y., and Lv, G. N., 2009. ENSO sigals and their spatial-temporal variation characteristics recorded by the sea-level changes in the northwest Pacific margin during 1965–2005. Science in China Series D: Earth Sciences, 52 (6): 869-882, DOI: 10.1007/sl1430-009-0072-5.
Zhan, J. G., Wang, Y., and Cheng, Y. S., 2009. The analysis of China sea level change. Chinese Journal of Geophysics, 52 (7): 1725-1733 (in Chinese with English abstract), DOI: 10.3969/j. issn.0001-5733.2009. 07.007.
Zhan, J. G., Wang, Y., and Liu, L. T., 2003. Time-frequency analysis of the inter-seasonal variations of China-neighboring seas level. Chinese Journal of Geophysics, 46 (1): 36-41 (in Chinese with English abstract).
Zhang, G. H., 2009. Analysis of tide characteristics in coastal area in Guangxi. People Pearl River, 30 (1): 29-30 (in Chinese).
Zhang, J. L., 2006. The variability of global sea level and the influence of the variability of the steric. PhD thesis, Ocean University of China.
Zheng, W. Z., 1996. Forecasting of sea levels at coast tide gauge stations and any places in China and the world in the twenty first century. Marine Science Bulletin, 15 (6): 1-7 (in Chinese with English abstract).
Zuo, J. C., Zhang, J. L., Du, L., Li, P. L., and Li, L., 2009. Global sea level change and thermal contribution. Journal of Ocean University of China, 8 (1): 1-8, DOI: 10.1007/S11808-009-0001-4.
(Edited by Xie Jun)
(Received April 4, 2012; revised November 26, 2012; accepted October 28, 2013)
? Ocean University of China, Science Press and Springer-Verlag Berlin Heidelberg 2014
* Corresponding author. Tel: 0086-532-66782542
E-mail: estuary@ouc.edu.cn
 Journal of Ocean University of China2014年3期
- Journal of Ocean University of China的其它文章
- Combined Action of Uniform Flow and Oscillating Flow Around Marine Riser at Low Keulegan-Carpenter Number
- Effects of Sulfate Chitosan Derivatives on Nonalcoholic Fatty Liver Disease
- Modal Strain Energy Based Structural Damage Localization for Offshore Platform using Simulated and Measured Data
- Dynamic Response Analysis of a Floating Mooring System
- Fully Coupled Time-Domain Simulation of Dynamic Positioning Semi-Submersible Platform Using Dynamic Surface Control
- Laboratory Application of Laser Grain-Size Analyzer in Determining Suspended Sediment Concentration
