Laboratory Application of Laser Grain-Size Analyzer in Determining Suspended Sediment Concentration
LIU Xiao, FENG Xiuli, LIU Jie, and LIN Lin
College of Marine Geosciences, Ocean University of China, Qingdao 266100, P. R. China
Laboratory Application of Laser Grain-Size Analyzer in Determining Suspended Sediment Concentration
LIU Xiao, FENG Xiuli*, LIU Jie, and LIN Lin
College of Marine Geosciences, Ocean University of China, Qingdao 266100, P. R. China
Suspended sediment concentration (SSC) is an important parameter in marine sedimentology. With the development of technology, many acoustic and optical devices, such as the Laser In-Situ Scattering and Transmissometry, have been designed to measurein situSSC and grain size distribution. But due to fund or other restrictions, many experiments were only conducted in laboratory, using an indoor laser grain-size analyzer and gravimetric method to measure grain size distribution and concentration, respectively. In this study the laboratory experiment is simplified by omitting the tiring step of gravimetric method. The connections between SSC and other parameters (obscuration, D50and sorting index) were investigated based on 124 surface sediment samples collected from different offshore areas. A new method is developed for determining SSC in laboratory using a laser grain-size analyzer.
suspended sediment concentration; laser grain-size analyzer; grain size parameters; obscuration
1 Introduction
and Xu, 2006; Chen and Xu, 2008). With the development of technology, many acoustic and optical devices have been developed to measurein situSSC (Lynchet al., 1994; Fugate and Friedrichs, 2002; Wrenet al., 2000; Zhaiet al., 2005; Tanet al., 2007).
The Laser In-Situ Scattering and Transmissometry (LISST), produced by Sequoia Scientific Inc., can be used to conduct measurements of grain size distribution and volume concentration of suspended sediment, and has become popular in field applications (Du and Song, 2010; Panget al., 2010; Zenget al., 2010). LISST is successful in measuringin situvolume concentration and size distribution of suspended sediments. However, SSC commonly refers to mass concentration and not to volume concentration, so the results of LISST have to be calibrated with sediment density. Meanwhile, due to fund or other restrictions, many experiments were only conducted in laboratory, using an indoor laser grain-size analyzer and gravimetric method to measure grain size distribution and concentration, respectively. Therefore, if the indoor laser grain-size analyzer can determine both grain size distribution and concentration simultaneously, the gravimetric method can be simplified.
Laser diffraction particle sizing technique has been used in laboratory for three decades (Traykovskiet al., 1999). Some researchers applied the laser diffraction particle size analyzer for the measurement of particle number concentration (Keizo and Kanji, 1999; Blacket al., 1996).
In this study a series of laboratory tests is performed to seek for the relationship between SSC, size distribution, and laser analyzer parameters, and to derive empirical equations based on the relationship.
Understanding grain size distribution of suspended particles in marine sedimentology is important for the exploration of ocean hydrodynamic and sedimentation processes. Suspended sediment concentration (SSC) is also an important element in the research of sediment transport processes, primary production, and water color remote sensing. Jianget al.(2002) studied the relationship between SSC and ocean hydrodynamic processes in the Bohai Sea. Baoet al.(2010) examined the seasonal variations of sediment distribution features in 9 sections in the North Yellow sea. Songet al.(2006) analyzed the source and the influential factors of SSC in the South Yellow Sea during spring and autumn, based on the characteristics of the grain size distribution of suspended sediment samples.
For many years, measuring SSC has been a part of routine in sediment transport studies. In general, three methods are used to determine SSC: gravimetric method, satellite remote sensing method and acoustics or optics method. The gravimetric method is traditional, but also complex and tiring. Zhouet al.(2004) reported a key technique on the analysis of SSC by the gravimetric method involving drying temperature, drying time, and constant weight time of samples. The satellite remote sensing method is a new technique that estimates SSC through the color of satellite images (Liet al., 2006; Ye
2 Samples and Method
The present experiment could be divided into three steps: 1) Prepare water sediment samples. 2) Determine the grain-size distribution of and record the obscuration (which is a basic parameter of a laser grain-size analyzer) of each sample. 3) Calculate particle parameters and establish their correlations with SSC.
124 surface sediment samples were collected from different sites in the Bohai and Huanghai offshore areas with an averaged water depth of less than 10 m and a wide variety of sediment properties. Water sediment samples of known concentration were prepared as follows: First, 0.1–1.5 g of a sample was added to a beaker, and dried at 70℃ for 24 h. Next, the sample was kept in the dryer for 4 to 5 h, and the dry weight was then determined using a balance scale (to the accuracy of 0.0001 g). To remove aggregates, the samples were dispersed by adding 5 mL of Na-hexametaphosphate solution (51 g L-1) and soaked for 24 h. And then, a certain volume of distilled water was added based on the mass and characteristics of each sample. The laser grain-size analyzer used to determine the grain-size distribution is Mastersizer 2000 (Malvern, England), which is applicable to the grain size ranging from 0.02 to 2000 microns (theoretical) (Table 1). For each sample the obscuration was also recorded, an important parameter in establishing the relationship between SSC and particle parameters. Each sample was measured under the same conditions: 2800 r min-1stirring rate, 3 min sonication, 10%–20% obscuration. Part of the samples should have an obscuration higher than 20% or lower than 10% in order to make the data representative.
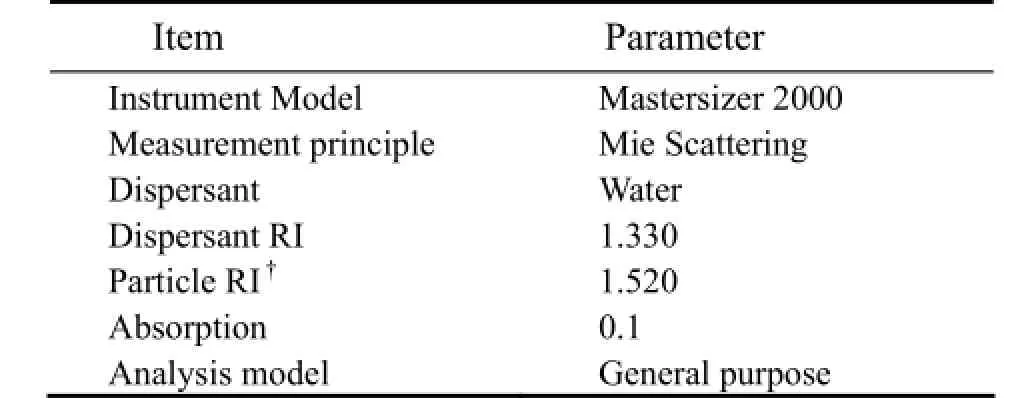
Table 1 Laser diffraction analyzer parameters
Grain-size parameters were calculated using the formulas of Folk and Ward (1957). Sediment texture was determined according to the classification of Shepard (1954).
3 Results
All the samples were divided into two types according to the Shepard triangular classification method: clayey silt and sandy silt. Each type is discussed here.
3.1 Samples of Clayey Silt
Experiment results with 80 samples of clayey silt are shown in Table 2, with the fitting curve shown in Fig.1, which satisfies the following formula:

whereSSChas a unit of mg L-1;Obrepresents the obscuration measured by the laser grain-size analyzer;D50represents the median size of the suspended sediment (μm);σIis the sorting index (standard deviation), which shows the diffusion degree of the frequency distribution;Ris the correlation coefficient.
The squared correlation coefficient based on Formula (1) is as high as 0.9843, which implicates that for suspended clayey silt sediment, the sorting index (σI) and median grain size (D50) are directly proportional to SSC.
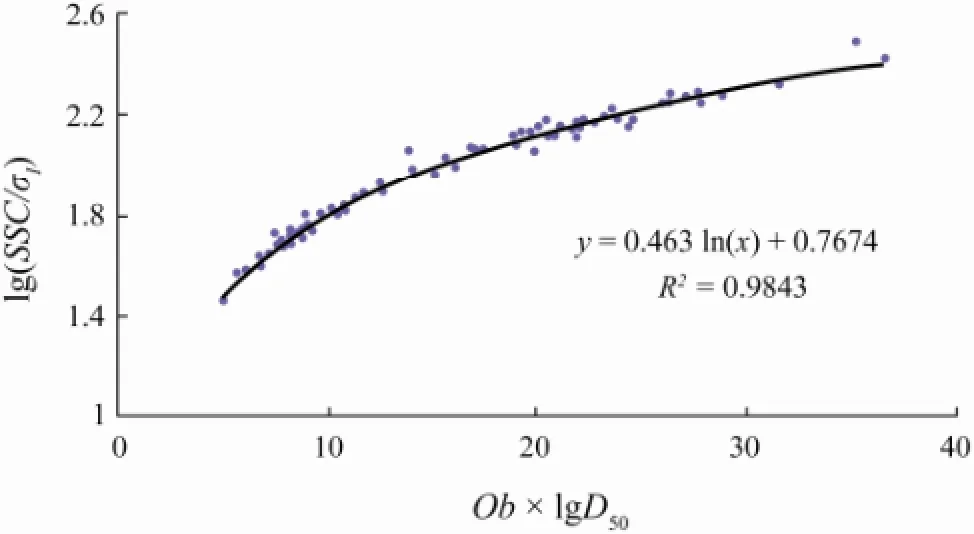
Fig.1 The relationship among SSC, grain size parameters and obscuration of clayey silt samples.

Table 2 The SSC, obscuration, sorting index (σI), and median size (D50) of clayey silt samples

(continued)
3.2 Samples of Sandy Silt
The analytical results of 44 sandy silt samples are shown in Table 3, and the corresponding fitting curve, shown in Fig.2, can be expressed by the following formula:

The squared correlation coefficient of Formula (2) is 0.9447, which indicates that a high correlation exists be-tween SSC and other parameters (obscuration, D50and sorting index): for suspended sandy silt sediment, the median size (D50) is proportional to SSC and the sorting index (σIi) is inversely proportional to SSC.

Table 3 The SSC, obscuration, sorting index (σIi) and median size (D50) of sandy silt samples
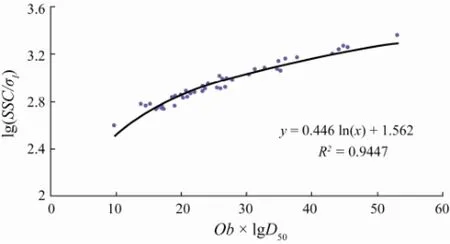
Fig.2 The relationship among SSC, grain size parameters and obscuration of sandy silt samples.
4 Verification-Compared with Gravimetric Method
Nine water samples collected from the Fujian coast were used to verify the above results. The median size, sorting index and obscuration of the samples were measured using the laser grain-size analyzer (Mastersizer 2000). The SSCs shown in Table 4 were obtained with the formulas derived in the previous section and the gravimetric method, respectively. The results show that there is little difference between the two sets of results, which indicates that SSC has close correlations with other parameters (obscuration,D50and sorting index) (Fig.3). Therefore, the new method can be used as an alternative to obtain SSC based on obscuration and grain size parameters.
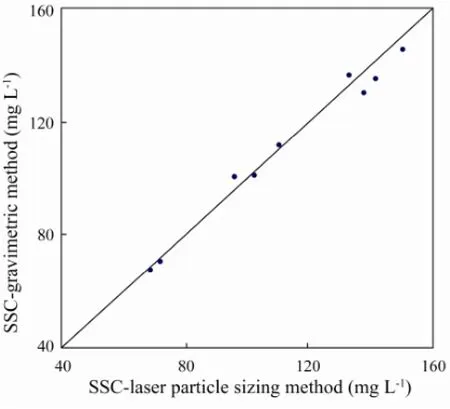
Fig.3 Correlation between the SSC results derived from the laser particle sizing and the gravimetric methods.

Table 4 SSCs determined by two methods
5 Discussion
5.1 Representativeness of Samples
To test the relationship between SSC and other parameters, surface sediment samples should have a representative area coverage. In this study, 124 sediment samples were collected from different sites in the Bohai and Huanghai offshore areas. These samples have a wide variety of sediment properties and a broad representativeness, covering different formation conditions, grain size distribution, and specific weight of particles.
All the sediment samples were mapped on Shepard’s Classification diagram (1954) (Fig.4). Sediment samples collected for this study fall in two of the ten classes, clayey silt and sandy silt. Thus, the two formulas developed based on these samples should be universal and appropriate for these two kinds of sediments.
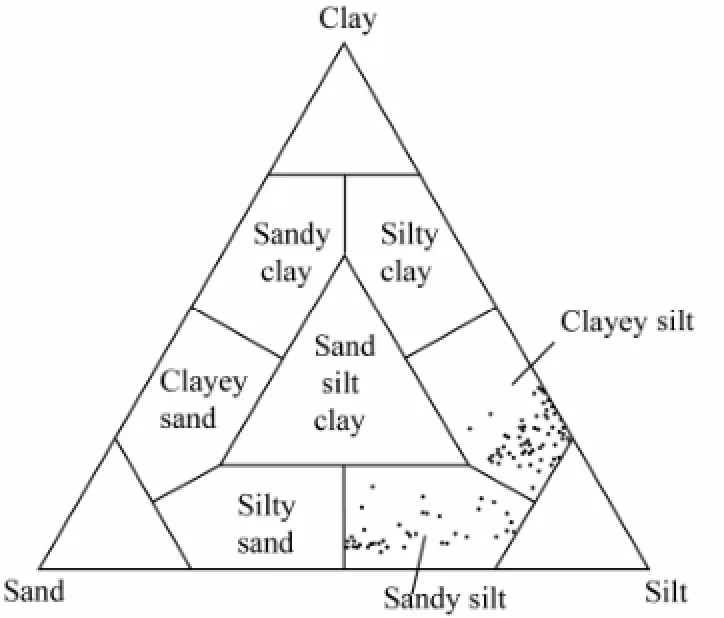
Fig.4 Distribution map of sediment samples on Shepard’s ternary diagram.
5.2 Formula Parameters
5.2.1 Obscuration
As a key parameter to describe SSC, the obscuration is defined as the fraction of light ‘lost’ from an analyzer beam by either scattering or absorption and is indicatingthe number of particles (sample concentration) added to the dispersant liquid (Mastersizer 2000 Operators Guide, 1999; Storti and Balsamo, 2010). Tables 2 and 3 show that obscuration and SSC are in direct proportion to one another,i.e., SSC increases with the increase of obscuration and decreases with the decrease of obscuration. This relationship between the two variables is expressed in formulas (1) and (2).
Based on full Mie theory, the Mastersizer 2000 laser diffraction particle size analyzer has an ideal range of obscuration, which is about 10%–20% for wet measurements. If obscuration is lower than that, weak signal would adversely affect the accuracy and multiple scattering would occur at high obscuration (Mastersizer 2000 Operators Guide, 1999). Therefore, formulas (1) and (2) can be better applied to suspended sediment samples within the recommended levels of obscuration.
5.2.2 Grain size parameters
While discussing the relationship between SSC and other parameters for different water bodies, the influence of grain size distribution should be considered. There are two grain size parameters in the formulas, median grain size and sorting index. Median grain size (D50) refers to the size relative to which 50% of particles are smaller or larger. Sorting index (Standard deviation) describes the spreading of grain sizes and is calculated using Folk and Ward graphical method (1957) as

According to Shepard triangular classification method two types of sediment are identified from the sediment samples collected in this study. If suspended sediment is clayey silt, both sorting index and median size are proportional to SSC; but if suspended sediment is sandy silt, only median grain size is proportional to SSC while sorting index is inversely proportional to SSC. Formulas (1) and (2) also reflect the difference between two types of sediment.
5.3 Mass Concentration
LISST-measured SSC is volume concentration, which needs to be converted to mass concentration. In this study grain size parameters and obscuration are used to connect the ‘volume’ and ‘mass’ and SSC is determined as mass concentration directly.
While soil particle density is mainly determined by mineral compositions and varies with size classes, the particle density is commonly taken as a constant close to 2650 kg m-3for earth materials (Beuselincket al., 1998; Stefanoet al., 2010). Because organic matter has a much lower density (Blake and Hartge, 1986), it could influence sediment density to a great extent. Thus the sediment samples collected in this experiment must be low in organic matter. Consequently, formulas (1) and (2) should be applicable to suspended sediment samples with low content of organic matter.
5.4 Formula Applicability
The two formulas are obtained based on 124 surface sediment samples in different offshore areas. In Section 4, formula (1) is verified through 9 suspended samples collected at different sites along the Fujian sea area, which well demonstrates the applicability and credibility of this formula as a method to determine SSC.
Besides two types of sediment analyzed above, many other types of sediment samples were collected and studied, but more reliable formulas like formulas (1) and (2) have not yet been established. Suitable sandy silt samples still need to be collected for the verification of formula 2.
6 Conclusions
Using the laser grain-size analyzer the relationship between SSC and some other parameters (obscuration, D50and sorting index) is investigated and two formulas are developed as a new method to determine SSC of sediment water samples.
For clayey silt,

and for sandy silt,

Acknowledgements
This study was sponsored by Marine Commonweal Scientific Research Foundation (201005009).
Bao, X. W., Li, Z., Wang, Y. Z., and Li, N., 2010. Sediment distribution features in the North Yellow Sea during summer and winter. Journal of Sediment Research, 2: 48-56.
Beuselinck, L., Govers, G., Degraer, G., and Froyen, L., 1998. Grain-size analysis by laser diffractometry: Comparison with the sieve-pipette method. Catena, 32: 193-208.
Black, L. D., Mcquay, Q. M., and Bonin, P. M., 1996. Laser-based techniques for particle-size measurement: A review of sizing methods and their industrial applications. Energy Combust, 22: 267-306.
Blake, G. R., and Hartge, K. H., 1986. Methods of Soil Analysis: Part 1: Paticle Density. Soil Science Society of America, Madison, USA, 377-382.
Chen, J. H., and Xu, H. Q., 2008. Modeling of the suspended solid concentration of the Jin River based on high-spectral resolution data. Remote Sensing Technology and Application, 23 (6): 653-657.
Du, Y. D., and Song, X. Y., 2010. Study on sediment concentration calculation method based on LISST-100X. Yangtze River, 41 (12): 71-73.
Folk, R. L., and Ward, W. C., 1957. Brazos River bar: A study in the significance of grain size parameters. Journal of Sedimentary Petrology, 27: 3-26.
Fugate, D. C., and Friedrichs, C. T., 2002. Determining concentration and fall velocity of estuarine particle populations using ADV, OBS and LISST. Continental Shelf Research, 22 (11-13): 1867-1886.
Jiang, W. S., Su, J., Yang, H., Zhang, Y. J., and Jiang, H., 2002. The relationship between SPM concentration and hydrodynamic condition in the Bohai Sea. Acta Oceanologica Sinica, 24 (1): 212-217.
Keizo, I., and Kanji, M., 1999. The development of the measurement of particle concentration using a commercial laser diffraction particle size analyzer. Advanced Powder Technology, 10 (1): 89-103.
Li, Y. M., Huang, J. Z., Lu, W. N., and Shi, J. Z., 2006. Modelbased remote sensing on the concentration of suspended sediments in Taihu Lake. Oceanologia et Limnologia Sinica, 37 (2): 171-177.
Lynch, J. F., Irish, J. D., Sherwood, C. R., and Agrawal, Y. C., 1994. Determining suspended sediment particle size information from acoustical and optical backscatter measurements. Continental Shelf Research, 14 (10-11): 1139-1165.
Malvern Instruments Ltd., 1999. Mastersizer 2000 Operators Guides.
Pang, C. G., Yu, W., and Yang, Y., 2010. Characteristics and its forming mechanism on grain size distribution of suspended matter at Changjiang Estuary. Environmental Science, 31 (3): 618-625.
Shepard, F. P., 1954. Nomenclature based on sand-silt-clay rations. Journal of Sedimentary Petrology, 24: 151-158.
Song, Z. J., Huang, H. J., Du, T. Q., Liu, F., and Ni, J. L., 2006. Suspended sediment near radial sand ridge area in the South Yellow Sea. Marine Geology and Quaternary Geology, 26 (6): 19-25.
Stefano, C. D., Ferro, V., and Mirabile, S., 2010. Comparison between grain-size analyses using laser diffraction and sedimentation methods. Biosystems Engineering, 106: 205-215.
Storti, F., and Balsamo, F., 2010. Particle size distributions by laser diffraction: Sensitivity of granular matter strength to analytical operating procedures. Solid Earth, 1: 25-48.
Tan, L. M., Li, Y., and Feng, L. H., 2007. Discussion on the determination of the suspended solid in wastewater by spectrophotometry. Industrial Water Treatment, 27 (6): 66-67.
Traykovski, P.., Latter, R. J., and Irish, J. D., 1999. A laboratory evaluation of the Laser In Situ Scattering and Transmissometery instrument using natural sediments. Marine Geology, 159 (1): 355-367.
Wren, D. G., Barkdoll, B. D., Kuhnle, R. A., and Derrow, R. W., 2000. Field techniques for suspended-sediment measurement. Journal of Hydraulic Engineering, 126 (2): 97-104.
Ye, L., and Xu, H. Q., 2006. Remote sensing analysis of suspended sediment concentration variation of the Lower Min River (Fuzhou Portion) in Fujian of China. Remote Sensing Technology and Application, 21 (6): 497-501.
Zeng, M., Fan, D. J., Sun, X. G., Wang, S., and Yang, Z. S., 2010. The grain-size distribution of the suspended particulate matter in the Huanghe Estuary and its adjacent area in winter. Acta Oceanologica Sinica, 32 (4): 129-138.
Zhai, S. K., Zhang, H. J., Fan, D. J., Yang, R. M., and Cao, L. H., 2005. Corresponding relationship between suspended matter concentration and turbidity on Changjiang Estuary and adjacent sea area. Acta Scientiae Circumstantiae, 25 (5): 693-699.
Zhou, H. L., Zhu, J. H., Han, B., and Chen, J., 2004. Research on the key technique of the analysis of suspended matter by weighting method. Ocean Technology, 23 (3): 15-20.
(Edited by Xie Jun)
(Received March 14, 2012; revised September 4, 2012; accepted December 23, 2013)
? Ocean University of China, Science Press and Springer-Verlag Berlin Heidelberg 2014
* Corresponding author. Tel: 0086-532-66782057
E-mail: fengxiuli@ouc.edu.cn
 Journal of Ocean University of China2014年3期
- Journal of Ocean University of China的其它文章
- Combined Action of Uniform Flow and Oscillating Flow Around Marine Riser at Low Keulegan-Carpenter Number
- Effects of Sulfate Chitosan Derivatives on Nonalcoholic Fatty Liver Disease
- Modal Strain Energy Based Structural Damage Localization for Offshore Platform using Simulated and Measured Data
- Dynamic Response Analysis of a Floating Mooring System
- Fully Coupled Time-Domain Simulation of Dynamic Positioning Semi-Submersible Platform Using Dynamic Surface Control
- Mean Sea Level Changes near Weizhou Island from 1969 to 2010
