Spatial and spectral investigation of turbulent kinetic energy in cavitating flow generated by Clark-Y hydrofoil*
Xiao-rui Bai,Huai-yu Cheng,Bin Ji,2,Xin-ping Long
1.State Key Laboratory of Water Resources and Hydropower Engineering Science,Wuhan University,Wuhan 430072,China
2. Science and Technology on Water Jet Propulsion Laboratory,Shanghai 200011,China
Abstract: In the present paper,the turbulent cavitating flow generated by a Clark-Y hydrofoil is investigated by large eddy simulation(LES) combined with Zwart-Gerber-Belamri (ZGB) cavitation model.In order to shed light on the influence of cavitation on turbulent energy distribution among scales,energy spectrum obtained from the three-dimensional velocity field is firstly applied to turbulent cavitating flow.Spatial and spectral distributions of turbulent kinetic energy are studied for both non-cavitating flow and cavitating flow.Cavitation is found to have a significant effect on the original turbulent flow by inducing more large-scale turbulent structures.The energy spectrum of cloud cavitating flow also experiences a periodic evolution as cavitation develops,and a large amount of turbulent kinetic energy is found to generate as the first shedding,cutoff and second shedding of cavities happen.
Key words: Cavitating flow,energy spectrum,large eddy simulation (LES),turbulent kinetic energy,cloud cavitation
Cavitation phenomenon has a close relationship to turbulent flow in all kinds of hydraulic machines,which may happen if the local pressure drops below the saturation vapor pressure,due to fluctuations and vortical motions in turbulent flow[1].The interaction between them has attracted much attention and has been discussed for decades,involving the inception of cavitation in turbulent shear layers[2],cavitation development in turbulent vortices[3]and the mechanisms of cavitation-vortex interaction[4].
Partial cavitation,introduced by hydrofoils and wedges for instance,is highly unsteady intrinsically,which is characterized by quasi-periodic temporal evolution,shedding and collapsing of cloud cavitation processes.Re-entrant jets and condensation shocks are suggested to be the main factors contributed to the dynamics of cavitation[5].The shedding and collapsing behavior may bring extensive variations to the turbulent flow field,producing vibration and noise[3].The dynamics of the flow can be altered locally and globally in the presence of cavitation in a turbulent shear flow[6].It was observed by Laberteaux and Ceccio[7]experimentally that cavity collapse could lead to the generation of vorticity baroclinically and create a turbulent wake.It was also evidenced by Ji et al.[8]numerically and theoretically that cavitation and vortices influenced each other mainly through dilatation and baroclinic terms in the vorticity transport equation.Cheng et al.[9]researched into turbulent coherent structures in the cavitating turbulent flow from the Lagrangian viewpoint and found a close connection between cavitation and Lagrangian coherent structures (LCSs).Recently,Ohta and Sugiura[10]performed direct numerical simulation and proved that the occurrence of vortex cavitation resulted in turbulent modification by altering the redistribution term.However,more quantitative works are still needed to further understand the mechanisms of how cavitation modifies the turbulent flow.It is worth mentioning that bubbles and cavities in the multiphase flow can make a difference in turbulence,which is reflected by the distributions of turbulent kinetic energy in spectral space of the flows.
Inspired by previous works,Large eddy simulation(LES) and the Zwart-Gerber-Belamri (ZGB) cavitation model are used to investigate the turbulent cavitating flow around a Clark-Y hydrofoil in the present study,with special emphasis on the modification of cloud cavitation to turbulent kinetic energy spectrally and spatially.Energy spectrum obtained from the threedimensional velocity field is utilized to understand the influence of cavitation on turbulent energy distribution among scales.The results of energy spectra of the fluctuation and turbulent kinetic energy distributions are presented for both cavitating and non-cavitating flow fields.A discussion about the relationship between cavitation dynamics and turbulent fluctuation field is further conducted.
The computational domain and the boundary conditions are shown in Fig.1 in accordance with the experiments[3],in which chord length of the Clark-Y hydrofoilC= 0.07 m and the angle of attackα=8°.The computational domain is 10.0Cand 2.7Cin horizontal and vertical directions respectively.The spanwise length is set as 1Cto capture more three-dimensional features of turbulent structures.An incoming flow velocityV∞=10 m/s is imposed on the inlet boundary,and the static pressurep∞at the outlet is fixed according to the cavitation numberThe hydrofoil surface is subject to no-slip boundary condition.Three sets of Cartesian cut-cell meshes,named mesh 1-3,are generated with a deliberate refinement around the foil and in its wake.The Cartesian cut-cell method shows high orthogonality,which will facilitate the computation of energy spectrum in the present study.The meshes consist of about 7.2×106,10.3×106and 14.2×10⁶cells,respectively,for different resolutions in the refined region.Twenty layers of mesh nodes are put in the near-wall region of the foil to resolve the laminar sublayer.Detail distributions of the grids are displayed in Fig.2.LES coupled with ZGB cavitation model are adopted to simulate the cavitating turbulent flow,initialized with a fully wetted profile obtained withk-ωSST model.
Comparisons between numerical results and experimental measurement[4]are conducted first to validate the simulation of turbulent cavitating flow in the present study.Figure 3 shows the distributions of mean volume fraction of vapor at the mid-span of the foil predicted by mesh 1-3.By comparing with the experimental result,it is observed that the computed cavitation profiles obtained with all three meshes are basically correct.However,mesh 1 underestimates the time-averaged cavitating flow with an overall lower vapor volume fraction in the domain.On the contrary,mesh 3 overestimates it by enlarging the distribution region of vapor.Result of mesh 2 agrees well with experimental data in both magnitude and spread,except a slight underestimation downstream the trailing edge,which will not be a major problem because the concern of the present paper is mainly the region over the hydrofoil.Therefore,discussions centering on the results of mesh 2 are conducted hereinafter considering the balance between accuracy and computational resources.
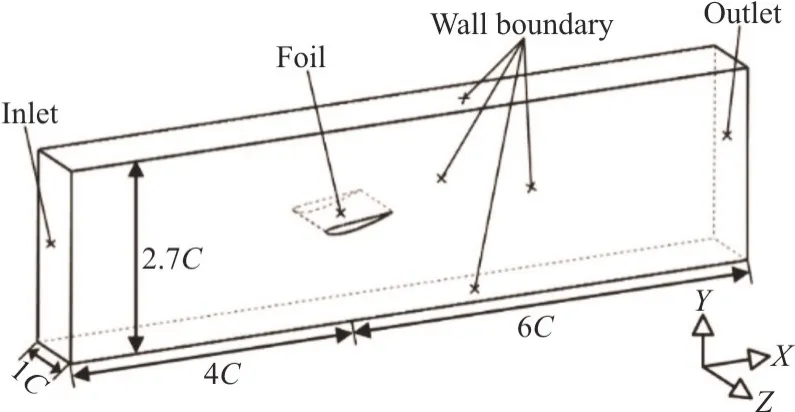
Fig.1 Computational domain and boundary conditions
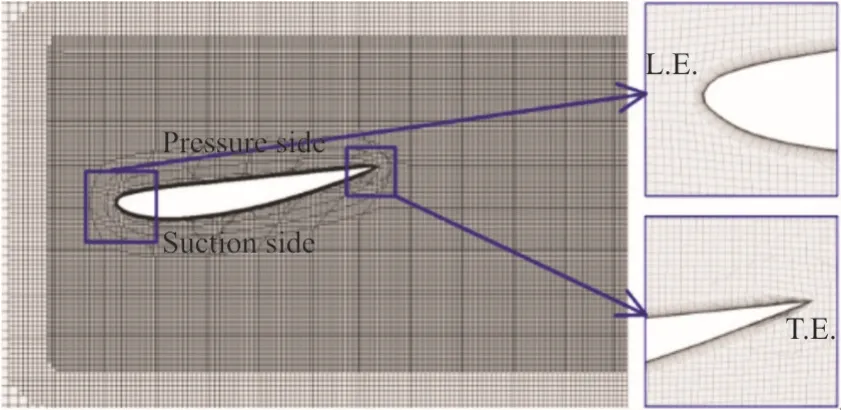
Fig.2 (Color online) Grid distributions around and in the wake of the foil
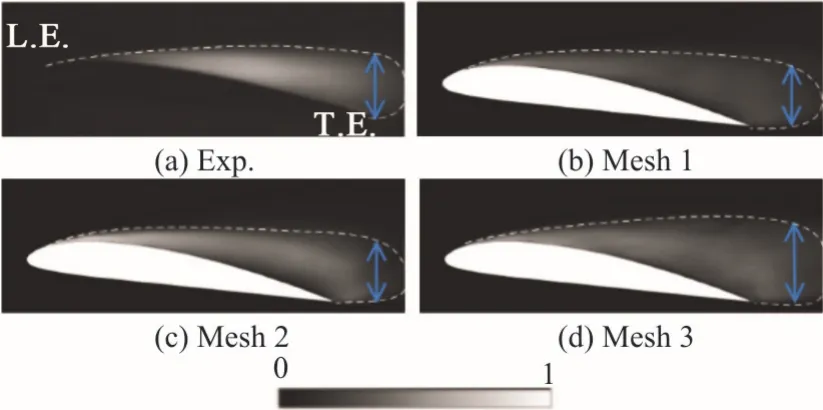
Fig.3 (Color online) Comparisons of the simulated time averaged vapor volume fraction distribution and experimental result[4]
Cloud cavitation is highly turbulent,to further validate the numerical results conducted in the present study,a criterionQcthat represents the ratio between modeled and total turbulent kinetic energy is adopted.Qcat mid-span of the foil in a typical instant for mesh 2 is shown in Fig.4,with interface of liquid and vapor marked with a black dashed line.The magnitude ofQcis mostly below 0.2 surrounding the foil,that ensures proportion of more than 80% of the overall turbulent kinetic energy being explicitly resolved.It is indicated that mesh 2 is sufficient for LES adopted here,and hence sufficient to capture coherent structures and energy spectrum of the turbulent cavitating flow field.

Fig.4 (Color online) Distribution of Qc at mid-span of the foil
To have a better insight in the mechanisms of cavitation-turbulence interaction,the spectral and spatial turbulent kinetic energy distributions around the foil are investigated for both cavitating and non-cavitating flows.Figure 5 shows energy spectrum of velocity fluctuation in the cubic region of 0 m ≤x≤ 0 .07 m,- 0 .035 m ≤y≤ 0 .035 m and 0 m ≤z≤ 0 .07 m as illustrated in Fig.6(a) by the grey cube that encloses the foil.There is a noticeable difference in the spectral intensity at small wave numbers between cavitating and non-cavitating flows,which indicates that a large amount of turbulent kinetic energy is transported to large scale structures when cavitation happens.The spectrums at large wave numbers are similar for the cases with and without cavitation,especially in the trend in inertial subrange,which are both decaying.Nevertheless,the slope of the spectrum is closer to -3 for cavitating flow,and -5/3 for non-cavitating flow,which is mainly because of turbulent wake introduced by the cavities[11].The spectral intensity for cavitating flow is higher across a wide range of wave numbers,except the dissipation scales.In order to explain the phenomenon,spatial distributions of vortical structures and turbulent kinetic energy are shown in Fig.6.Small scale hairpin vortices on the suction side of the foil are covered by large scale vortices due to the flow separation caused by cavitation.The turbulent kinetic energy shows an intense increase around the sheet and cloud cavities.As a consequence,turbulent kinetic energy is much higher for cavitating flow regime mainly in large scales.
As cloud cavitation is unstable and experiences a quasi-periodic evolution,the variation of turbulent fluctuation along time is discussed.Spatial and spectral distributions of turbulent kinetic energy in a typical cycle of cavitation evolution is displayed in Fig.7.Turbulent fluctuation is more violent in cloud cavitation than that in sheet cavitation,as shown in Fig.7(a).As the first shedding happens at the tail of the cavity (t2=0.148T),there is an increase in turbulent kinetic energy in the same region,accompanied by an increase of spectral intensity in large wave numbers and a decrease in small ones,which means that more small turbulent structures originate in the flow field due to the shedding of little cavitating vortices.Att3=0.370Tandt4=0.629T,the cavity is completely cutoff by the re-entrant jet and the whole cloud cavity experiences a second shedding to the downstream of the foil.The cutoff and shedding process are characterized by generation of a large amount of turbulent kinetic energy,which correspond to the highest energy spectrum in the period.As the second shedding cavity condenses and is transported away from the foil att5=0.888Tandt6=1.000T.The spectral turbulent kinetic energy falls back to a relatively low intensity level.
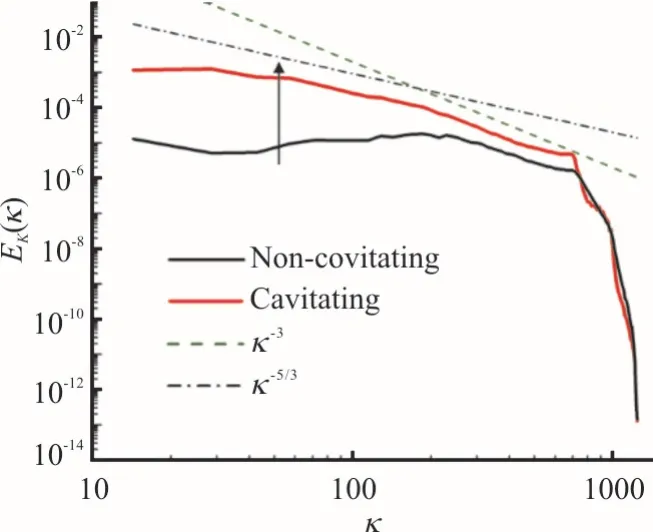
Fig.5 (Color online) Energy spectrum for cavitating and noncavitating flow configurations
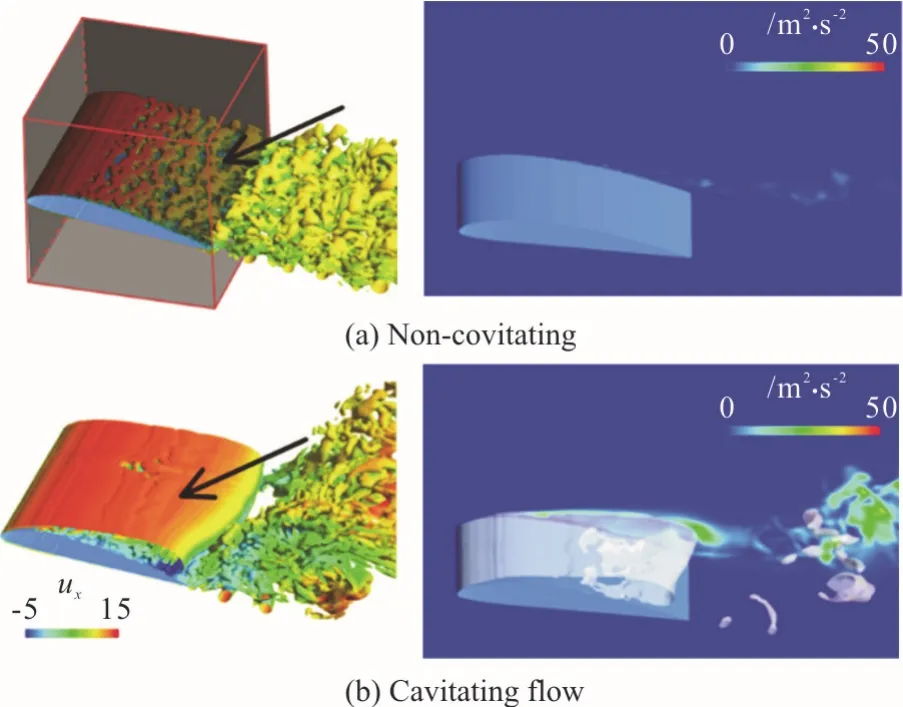
Fig.6 (Color online) Spatial distributions of vortical structures(left:Q=104 s -2) and turbulent kinetic energy(right) for non-cavitating and cavitating flows
In this paper,turbulent cavitating flow around a Clark-Y hydrofoil is investigated with LES.Energy spectrum obtained from the three-dimensional velocity field is firstly applied to turbulent cavitating flow to understand the influence of cavitation on turbulent energy distribution among scales.The main conclusions are drawn as follows:
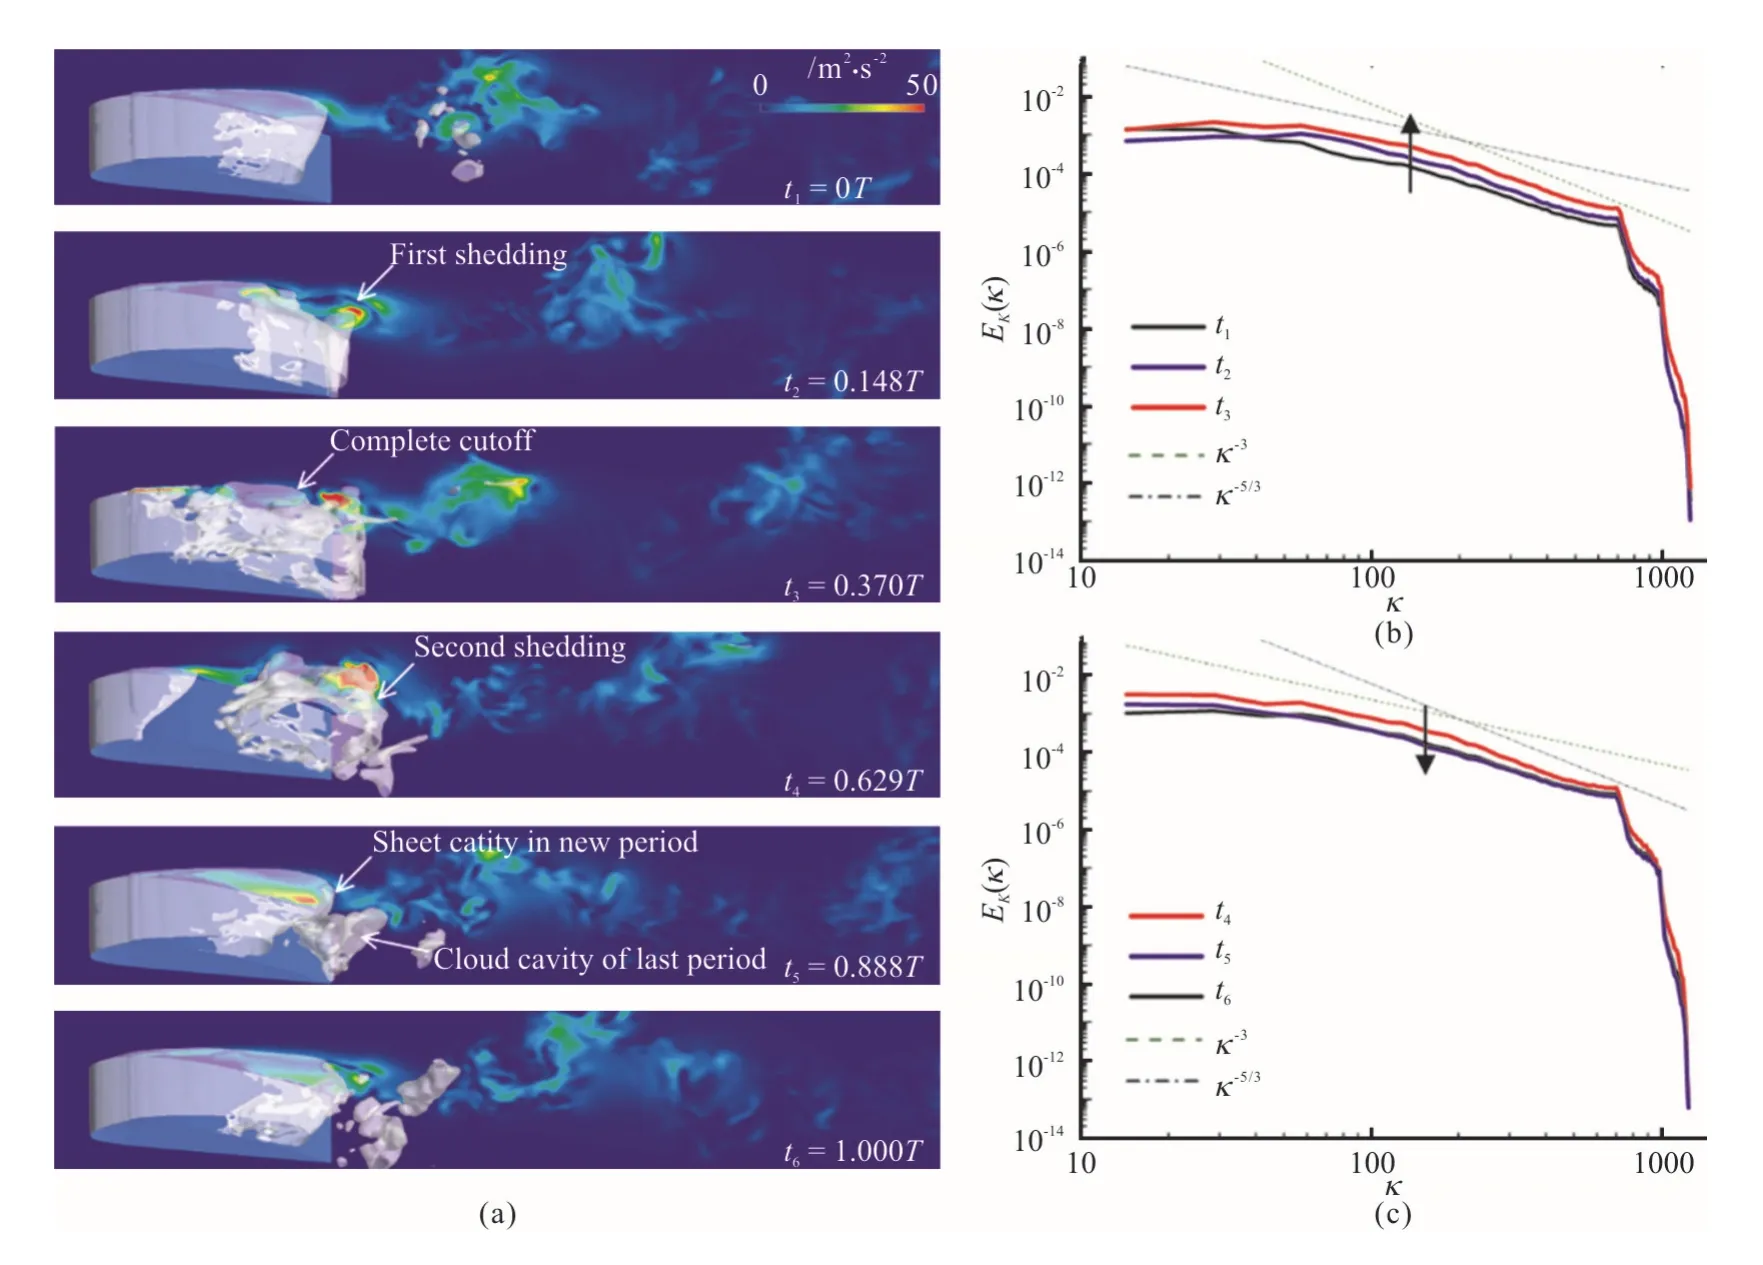
Fig.7 (Color online) Time evolution of the spatial and spectral turbulent kinetic energy distribution in a typical cycle
(1) Cavitation has a significant effect on the original turbulent flow.According to the energy spectrum,it is found that the occurrence of cavitation may shift the decaying slope of the energy spectrum from nearly -5/3,which is closer to the classical Kolmogorov spectral slope in the inertial subrange,to a steeper slope close to -3.
(2) The spectral intensity in small wave numbers for cavitating flow is higher than that of non-cavitating flow due to the flow separation caused by cavitation,which leads to an increase in large scale turbulent structures.
(3) Turbulent fluctuation is more violent in cloud cavitation than that in sheet cavitation.The energy spectrum of cloud cavitating flow experiences a periodic evolution as cavitation develops.The first shedding,cutoff and second shedding of cloud cavities are accompanied by the production of turbulent kinetic energy.
 水動(dòng)力學(xué)研究與進(jìn)展 B輯2020年1期
- 水動(dòng)力學(xué)研究與進(jìn)展 B輯的其它文章
- Numerical simulation of condensation shock in partial cavitating flow on a hydrofoil*
- Flow regime and energy dissipation of SFS-type flip buckets*
- A design of T-foil and trim tab for fast catamaran based on NSGA-II*
- Adaptive mesh refinement immersed boundary method for simulations of laminar flows past a moving thin elastic structure*
- Reconstruction of 3-D surface waves generated by moving submerged sphere based on stereo imaging principle*
- Study of parametric roll in oblique waves using a three-dimensional hybrid panel method*
